R E G U L A R A R T I C L E
Open Access
Error and attack tolerance of collective
problem solving: The DARPA Shredder
Challenge
Nicolas Stefanovitch
1†, Aamena Alshamsi
1†, Manuel Cebrian
3,4and Iyad Rahwan
1,2**Correspondence:
1Masdar Institute of Science and
Technology, Abu Dhabi, 54224, UAE 2School of Informatics, University of
Edinburgh, Edinburgh, UK †Equal contributors
Full list of author information is available at the end of the article
Abstract
The Internet has unleashed the capacity for planetary-scale collective problem solving (also known as crowdsourcing), with ever increasing successful examples. A key hypothesis behind crowdsourcing is that, at a critical mass of participation, it has the capacity not only to agglomerate and coordinate individual contributions from thousands of individuals, but also to filter out erroneous contributions, and even malicious behavior. Mixed evidence on this front has arisen from limited
observational data and controlled laboratory experiments with problems of moderate difficulty. We analyze behavioral data from our participation in the DARPA Shredder Challenge, an NP-hard combinatorial puzzle beyond computational reach, which involved 3,500 participants from five continents over three consecutive weeks. We study thousands of erroneous contributions and a number of large-scale attacks, and quantify the extent to which the crowd was able to detect, react, and recover from them. Whereas the crowd is able to self-organize to recover from errors, we observe that participants are (i) unable to contain malicious behavior (attacks) and (ii) the attacks displayed persistence over the subsequent participants, manifested in decreased participation and reduced problem solving efficiency. Our results raise caution in the application of crowdsourced problem solving for sensitive tasks involving Financial Markets and National Security.
Keywords: crowdsourcing; collective intelligence; error and attack tolerance
1 Introduction
Crowdsourcing [] allows us to harness human intelligence and skills in order to solve problems beyond the reach of current algorithms and computers [–]. Solving a prob-lem using crowdsourcing typically proceeds through a dedicated Web site or social media outlet, and inviting almost any willing individual over the Internet to join in and con-tribute. The system collects answers from these individuals (volunteers or paid workers) from the crowd and combines their answers into a complete solution. The crowd of in-centivized users can either parallelize and speedup the completion of a batch of tasks [], or solve problems beyond the reach of any individual even if given sufficient time to do so [].
A successful crowdsourcing platform requires a sufficiently large pool of users who ac-tively engage their time and effort. In order to build such a user base, Web sites need to incentivize people to participate, for example using small payments. Among the platforms
following this principle, Amazon Mechanical Turk is the best known. Crowdsourcing projects relying on financial rewards have to satisfy time, budget and quality constraints [–].
In many cases, people are also willing to participate freely in a crowdsourcing project when they see it as fun, or useful to a greater good. Examples of crowdsourcing projects based on voluntary work areWikipedia, the collaboratively edited encyclopedia,FoldIt, a gamification of protein folding for biomolecular research [] andTomnod, a company specialized in rapid natural disaster response by providing crowd-based satellite image analysis [, ].
Crowdsourcing systems adopt different incentives and algorithmic strategies to both enhance the quality of the collective endeavor and to protect it from malicious behavior [, –, –]. However, there is no incentive scheme that is foolproof. Users might commit errors either due to lack of sufficient motivation, due to honest mistakes, or as part of trial-and-error exploration of the task.
A typical approach to dealing with such errors is to replicate a single task, then aggregate the answers of several users, for example using fusion algorithms []. The simplest form is to average numerical answers, but sophisticated machine learning techniques can also be used to cluster answers and detect outliers []. Some platforms, such asWikipedia, tolerate errors assuming that erroneous contributions will be corrected by other genuine users after some time [].
Deviation, however, seems possible and quite pervasive. In the context of paid crowd-sourcing, users often exert the minimum effort possible in order to secure the pay. This form of deviation is well understood. Platforms like Mechanical Turk employ several safe guards to counter it, such as a reputation system that can be used to filter workers who do not meet quality standards [].
While errors and deviations from incentivized users received much attention, an im-portant and largely unaddressed problem is dealing with users willing to invest time and resources to actively attack a crowdsourcing system [–].
Crowdsourcing systems are particularly vulnerable to attacks due to their accessibility, allowing attackers to easily feed the platforms with false information [, –]. The increasing appeal of crowdsourcing solutions from governments and companies exposes them to the risk of suffering deliberate attacks from competing or adverse agents. Crowd-sourcing can also be used to promote distributed denial of service attacks performed by politically [] or financially [, ] motivated attackers.
In this paper, we study the capacity of a crowdsourcing system to cope with errors, lone-wolf attacks, and distributed attacks. We use data collected during a month-long crowd-sourcing effort led by the University of California, San Diego (UCSD) to solve the DARPA Shredder Challenge []. In this challenge, contestants were asked to solve five puzzles of increasing difficulty. Puzzles were the result of documents being processed through dif-ferent commercial shredders. A prize of $, was at stake for the first team able to answer a set of questions that required re-assembling the shredded documents.
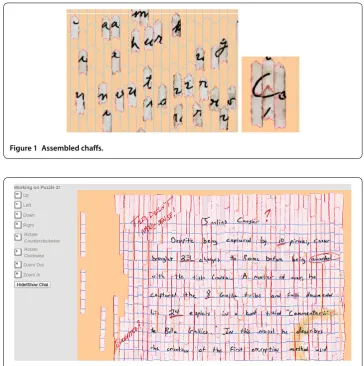
Figure 1 Assembled chaffs.
Figure 2 Virtual board.Screenshot of the board used by the participants to solve the puzzles. Depicted is the solution of Puzzle 2. The rich features of this puzzle, red ink, mug stain and lines made it easier to be solved than subsequent puzzles.
The UCSD team was not the only team to use crowdsourcing []. It is, however, the only one that succeeded at using an open platform, while all other teams kept their solution and methods closed. The UCSD team provided users with a virtual puzzle board, depicted in Figures and , over which anybody could directly modify the solution state. In doing so, the team was able to leverage the collective capacity of the crowd []. Users were incentivized to contribute effort and to recruit additional users by dividing the prize using a split contract scheme in case of winning [].
The UCSD team entered late (two weeks into the challenge) but was able to solve the first three puzzles in days. The team managed to reach the same level of achievement as the top contenders, reaching as far as the second place on the scoreboard put in place by the challenge organizer to keep track of progress.
One day after the attacks, the attackers sent an anonymous email to the UCSD team summarily describing their intentions, actions and how they changed their attack strat-egy to defeat the protective measures put in place by the team and exhibited by the crowd. Noteworthy is their claim to have recruited a crowd of attackers throughchan, an anony-mous image hosting and discussion board with a large and reactive following [] that is regularly involved in massive distributed pranks and militant attacks [].
To our knowledge, this is the first detailed dataset documenting an attack on a deployed crowdsourcing system. The dataset provided a rare opportunity to explore the behavior of crowdsourcing under two different regimes (i)normal:when only genuine users interact with the system; and (ii)attack:when one or more attackers are active. While it is im-possible to obtain perfect understanding of the underlying processes behind the crowd’s behavior, we made substantial progress in this direction, and drew several key observa-tions that can inform future crowdsourcing deployment.
To identify suspicious behavior, we developed a set of domain-independent features and domain-specific quality measures to evaluate the behaviors of individual users and the crowd. In the normal regime of puzzle assembly, we find that only a small proportion of users (at most %) drove most of the progress. We also found that recovery from errors follows a long-tailed distribution with an exponential cut-off. This implies that the crowd can cope with small perturbation with high efficiency.
Under the attack regime, we find that just few attackers are able to inflict considerable damage even when numerous genuine users react in real-time, giving the upper hand to attackers. However, we could not find conclusive evidence that the platform sustained a distributed attack from a large number of recruited attackers. This has an important consequence that only motivated attackers can be harmful.
Moreover, we find that attacks on crowdsourcing systems are successful not because they destroy progress made by the crowd, as this can be easily restored from backups. Rather, it is attackers undermine the confidence of the crowd, eventually leading to the destruction of the user base. In particular, we find an order of magnitude decrease in ac-tivity subsequent to the attacks on the platform.
Crowdsourcing systems are complex socio-technical systems [], whose behavior is de-termined by technical design, individual human cognition, and social interaction among workers. The DARPA Shredder Challenge data provides a rare glimpse into some of those dynamics, particularly in relation to error and attack tolerance. We believe that the in-sights gained from this study are important in the development of future crowdsourcing platforms where state security or money are at stake. Our study highlights the importance of taking into account the security of crowdsourcing systems at the core of its design, and motivates the need to adapt reputation systems for these settings [].
2 Results
2.1 Crowdsourcing under normal regime
The crowdsourcing approach to puzzle-solving proved effective as it was able to solve the first three puzzles within almost one day each. It was able to do so despite the necessary transient errors of users exploring different combination of pieces. This section describes the mechanisms behind this.
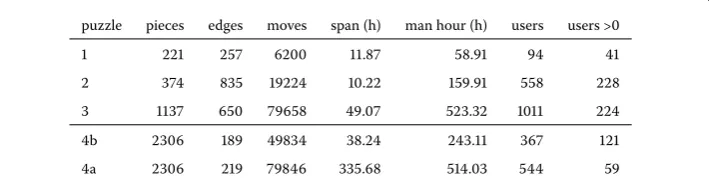
puzzle pieces edges moves span (h) man hour (h) users users >
. .
. . . . b . . a . .
Figure 3 Puzzle characteristics and crowd performance statistics.Piecesis the number of pieces in a puzzle,edgesis the number of correctly assembled edges - which correspond for the first three puzzles the minimum number of edges required to solve the puzzles,movesis the total number of moves,spanis the difference in time between the last and first move on a puzzle,man hourcolumn is the cumulative total number of hours spent on the system collectively by the users,usersis the total number of users participating in a puzzle,users> 0 is the number of users which assembled at least one correct edge. The last two rows describe two separate periods of Puzzle 4: before (4b) and after (4a) the attacks.
the evolution of cumulative achievement. Of particular importance are theprogressand
explorationmeasures, which are related to the linking and unlinking of correct (respec-tively, incorrect) links between pieces. The cumulative or instantaneous value of these measures will be used throughout the paper (refer to Section for details on their com-putation).
Characteristics of the puzzles and statistics of the crowd performance are given in Fig-ure . While Puzzle was never solved as a consequence of the attacks, we report the statistics relative to the two longest stable periods: before (b) and after the attacks (a). We focus in this section only on the first three puzzles. The impact of attacks is the topic of Section ..
.. Crowd efficiency
While the complexity of solving a puzzle increases with the number of pieces to be as-sembled, this measure fails to capture actual difficulty. First, puzzles possess an increasing number of characters written in a decreasing font size. Second, puzzles differ in the num-ber and richness of extraneous features (e.g. different colors, stains, line markers) that add significantly to the difficulty. Third, the puzzles need to be solved only to the extent that they can provide the answer to the set of questions laid by the organizers, possibly requir-ing only a subset of the pieces to be reconstructed. For all these reasons it is not possible to precisely compare the difficulty of the puzzles. Note that Puzzle is actually a sparse black and white image, with mostly featureless pieces, making it equivalent to a puzzle of a smaller size.
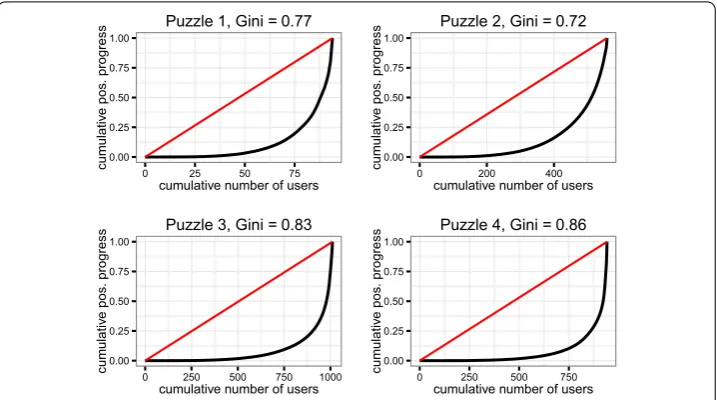
Figure 4 Effort repartition.The 4 panels represent the Lorenz curves of individual user contribution to positive progress (i.e. the number of correct links assembled) for the different puzzles, and the corresponding Gini index. The Lorenz curve represent the cumulative distribution of the positive progress of users, where users are ordered increasingly along this measure on thex-axis. It exhibits the relative importance of difference in contribution to total progress across users. The Gini index is the proportional area between an hypothetical uniform repartition (red line) and the actual repartition (Lorenz curve, in black). A high Gini index indicates a high inequality in the contributions of different users.
.. Work repartition
We study the inequality among users’ contributions by studying the Lorenz curves [] and respective Gini index [] of the different puzzles, reported in Figure . The curves indicate large inequality of contributions across users. Consistently, half of the progress has been made by at most % of the users, while in puzzle and this ratio is close to % of users. Moreover, as the platform gains momentum, the Gini index increases, except for Puzzle , which implies that the proportion of highly active user tends to decrease as the pool of participants gets larger. This can also be seen in Figure , under the column of users with a positive count of correct links created: the ratio of those active users to the total number of users is decreasing, except for Puzzle b, which is the part of Puzzle after the attack.
We can conclude that most of the progress has been achieved by a small proportion of users. While the contribution of others cannot be downplayed, it nevertheless indicates that the primary driving force behind crowdsourcing are motivated overachieving indi-viduals. The pool of such users is scarce or hard to reach, as their proportion decreases with respect to the total number of participating users.
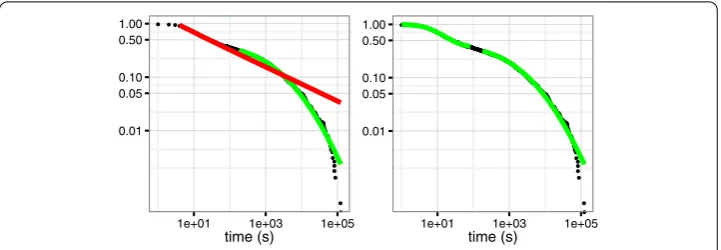
Figure 5 Error response time.Empirical complementary cumulative distribution function (ccdf ) of error recovery time in Puzzle 3 on a log-log scale. The ccdf indicates the proportion of errors that takes more than a given amount of time to be recovered. (Left panel) Log-normal best fit, shown in green, captures the empirical distribution better than a power law, shown in red; (Right panel) The data is best fitted by two log-linear models (thick green lines): a fast and lightly skewed one between 1 and 84 seconds representing 62% of the cdf and a slower heavily skewed one starting from 178 s representing 31% of the cdf, suggesting at least two error correction behaviors from the crowd: the initial, which covers most of the data, with extremely fast responses time, and another one with a slower response time.
.. Error recovery
An error is defined here as the unlinking of a correct edge between two pieces. Correct edges are defined as belonging to hand-picked clusters of correctly assembled pieces on the final state of the board. Correct edges between these pieces can be created and de-stroyed several times during the solving procedure. We study the error recovery capacity of the crowd by measuring how long it takes for a destroyed correct edges to be re-created. We focus on the recovery capacity exhibited by the crowd on Puzzle , which is the largest solved puzzle that did not experience an attack. Figure shows the empirical com-plementary cumulative distribution function (ccdf ) of error recovery times in Puzzle . The ccdf shows the proportion of errors that have been solved after a given amount of time. Most errors are recovered quickly with % of the errors corrected in under min-utes, % in under ten minmin-utes, and % in less than an hour.
The distribution is heavy tailed which is an important factor behind the efficiency of the crowd to cope with errors. We fit a power law, log-normal and exponential models to the data following the procedure of [], and compare them using the Vuong test []. The Vuong test is a likelihood ratio test able to discriminate which of two models better fits the data and is able to tell whether it can confidently do so. While close fits do not provide a proof that the data follow the best model, they nevertheless pose a basis for studying the generating process. The log-normal model is the most supported one, with a high test statistic andp-value close to zero, indicating that it is a better fit than the power law. The fitted model has a location (i.e. mean in a logarithmic scale) of . and a shape (i.e. standard deviation in logarithmic scale) of .. This distribution has a mode of s but is heavily skewed with a median of min and a mean of . hours.
Figure 6 Returning users.The entries above the diagonal gives the return rate of users of puzzlei(row) in puzzlej(column). The lower triangle gives the proportion of users of puzzlej(column) returning from puzzlei(row). Return rate of users in Puzzle 4 from before the attacks to after the attacks is 0.98 and 1.0 in the opposite direction (no new user have been recruited after attacks).
. . . . . . . . . . . . . . . .
is lightly skewed, with a mode of . s, a median of s and a mean of s. Unaccounted in the data are the errors which have never been solved, which represent .% of the error and are therefore negligible. Thus, the data suggest that the crowd is able to respond to errors in at least two different ways with different characteristic times.
.. User engagement
As seen previously, the bulk of progress relies on the number and dedication of a few talented users. It is therefore important to attract and retain such users. We report the proportions of shared users across pairs of puzzles in Figure . Given the sequential solving of the puzzles, we can quantify the attrition rate, which is about % for all puzzles except Puzzle . The reason behind the peculiarity of Puzzle may lie in the fact that only a few users participated, and that these users were likely more tightly connected to the social network of the UCSD team.
Figure also shows that Puzzle has about twice as many users as Puzzle , but has actually the same number of performing users. This indicates that despite the increase in crowd size, the number of people willing to participate is small and increases more slowly than the number of people visiting the site. The rarity of talented users, combined with a high attrition rate, means it is necessary to keep new users coming as previous users leave.
2.2 Crowdsourcing under attack
Our analysis reveals that the attacks sustained by the UCSD varied in scale, duration and nature. The attackers adapted to the defensive behavior exhibited by genuine users and the UCSD team. We were able to identify five different attack intervals. Each interval corre-sponds to one or more attackers attacking either once or several times, giving short breaks to genuine users before attacking again. To compare crowd behavior under the normal and attack regimes, we define a set of time series. Moreover, in order to help identify attackers, videos replaying the moves of all users have been produced (see Additional files and ). We refer the reader to Section for more details.
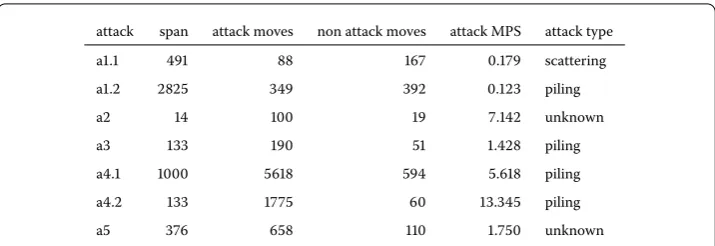
Figure summarizes the identified attacks and their diversity characteristics. The dura-tion of the attacks ranged from minutes to . hours, and the scale varied between less than moves to more than ,. The average moves-per-second (MPS) of a period is the ratio of number of moves by the crowd during this period and the length of this pe-riod (we similarly define the user MPS as the number of moves s/he performed divided by participation span). The MPS of the attacks ranges from . to more than . High MPS is a combination of at least three factors: fast motivated attackers, parallel attackers and imperfect times-tamp collection.
attack span attack moves non attack moves attack MPS attack type a. . scattering a. . piling
a . unknown
a . piling
a. . piling a. . piling
a . unknown
Figure 7 Attacks statistics and type.Attacks a1 and a4 proceeded in two phases and as such are considered separately in this table, labeled .1 and .2. Reported are thespan, the duration of each phase of an attack (in seconds), the total number ofattack movesandnon attack moves, the average moves per second (MPS) of attacks, thetypeof the attack, as it can be observed on the videos. Attacks of typeunknownare perpetrated by reported attackers whose mode of operation is unfathomable. Note that total span of attack a4 is of 72 min, consisting of 19 min of actual attacks and 54 min of recovery between the two phases.
.. Unrolling of attacks
The first attack happened about two days after the start of Puzzle and proceeded by scattering the pieces of the largest assembled clusters (attack a.). However, the attacker quickly changed his strategy from scattering to piling (attack a.), as the other users de-tected and repaired the damage. By piling up the pieces, the attacker made the work of genuine users much more complex, as they had first to unstack the pieces and then search for correct matches. While dedicated users were able to counter the attack, albeit slowly (refer to Section ..), the system was put offline for hours and the state of the board reverted to a previous safe state (first rollback). The team also reacted by banning the IP addresses and logins used by the attacker, which was only a temporary solution.
The next attack (attack a) was very small in scale and its nature is dubious, as it did not have any impact on progress and does not show any piece displacement on the video. The two subsequent attacks (attacks a, a) were clear, involving only piling moves. Thanks to the small scale of a, it did not have a lasting impact (we discuss this attack later in more detail). Attack a was the largest, and it disrupted the system for about two hours, which was then put offline for more hours before being reverted again to a safe state (rollback ).
Attackers adopted different strategies because the crowd was able to observe the un-usual behavior and react accordingly by unpiling, unscattering and possibly reconnecting edges. This is reported by the attackers in the email they sent to the UCSD team. While we observed additional attacker activity after a, examination of the video does not con-clusively support the attackers’ claims. This last attack, a, was undetected at the time and no rollback was performed.
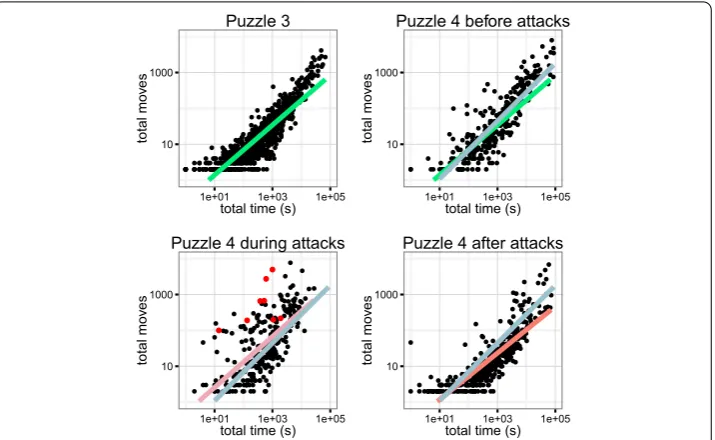
Figure 8 Impact of attacks on user behavior in Puzzle 4.Each dot represent a user plotted along two features: the total participation time (x-axis) and the total number of contributions, i.e. moves (y-axis) on a log-log scale. Large red dots in Puzzle 4 represent reported attackers. Thick lines are linear fits. In all three panels of Puzzle 4, the fit of Puzzle 4 before the attacks (blue) is represented to provide a reference point to visually assess the effect of the attacks. For the same purpose the fit of Puzzle 3 (green) is represented in the panel of Puzzle 4 before the attacks. Note that Puzzle 4 before and after the attacks contain about as many users although they lasted respectively 1.5 and 14 days. Moreover these are about the same set of users with 98% of users of Puzzle 4 before the attacks returning after the attacks.
.. Immediate impact of attacks on user behavior
The total duration of the attacks, from the first to the last move made by an attacker, spans only about two days. We assess the immediate impact of attacks by looking at the features of users during and after the attacks and comparing them to baseline behavior. This baseline is given by Puzzle and Puzzle before the attack.
In Figure users are plotted along two behavioral features: the total time spent on the system and the total number of moves. Linear regression lines are plotted for each panel, along the baseline in Puzzle . Reported attackers are indicated by red dots.
Across all panels except Puzzle during attacks, a relationship between total time spent and total number of moves is apparent. This relationship however varies across panels as the linear regression coefficient shows: . in Puzzle , a faster . in Puzzle before the attacks and a slower . after the attacks, all with comparable intercepts.
The attacks have an immediate impact of slowing progress and changing the behavior of genuine users. The relation between time spent on the system and number of moves does not hold any more: a large proportion of users (about half ), makes a large number of moves within a short period of time. The slope of the linear fit not only decreases to . but also the intercept is higher. The behavior of six out of the eight reported attackers departs from the baseline, but so does an even higher number of genuine users, compelled to match the speed of attackers to respond to the attacks. The two attackers which do not depart significantly from the baseline of behavior correspond to the logins used during attack a, which was short and small paced.
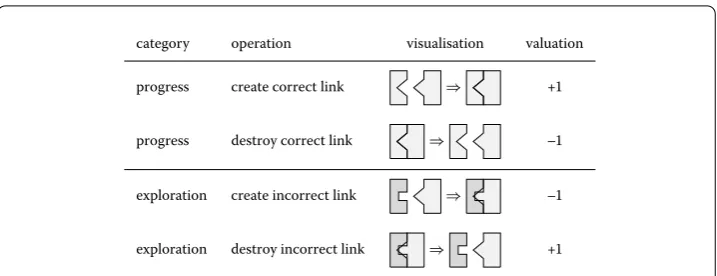
category operation visualisation valuation
progress create correct link ⇒ +
progress destroy correct link ⇒ –
exploration create incorrect link ⇒ –
exploration destroy incorrect link ⇒ +
Figure 9 Move evaluation and time series.Moves are numerically evaluated with respect to their impact on the overall puzzle completion. Moves that involves two pieces that should be connected fall under the progresscategory, moves that involves other pieces fall under theexplorationcategory. Progress moves have a direct impact over the completion, while exploration move have an indirect impact. A move is valuated +1 if it creates a correct edges or destroy an incorrect edges, and –1 if it destroys a correct edge or create an incorrect edges. Given the time at which a move is performed, we obtain time series for each categories. We define an additionalcompletiontime series as the sum of the cumulative progress and exploration time series. More details can be found in Section 4.
and the number of exploration moved performed by the user. This combination of two kinds of features is able to highlight the pilling attackers, which clearly stand apart, with a high number of exploratory moves within a short time span.
.. Long term impact of attacks on crowd behavior
Attacks had a long lasting impact over the performance of the system, reducing its activity. It is noteworthy that after the attacks, no new users have been recruited, while % of the users before the attacks contributed at least once after the attacks. The same set of users are therefore being compared, ruling out difference that could arise from different user sets.
The long term impact of attacks can already be seen in Figure , when comparing the panel of Puzzle before and after the attacks. The overall reactivity of users measured by the linear regression lines decrease from its highest before attacks at . to its lowest after attacks at ., thereby requiring more time to achieve a given number of moves.
To further assess the long term impact of the attacks, we first define three discrete time series: progress, exploration and completion. These time series are based on a numerical evaluation of each move, which is given in Figure . Progress corresponds to the actual solving of the puzzle, exploration captures moves that do not directly lead to the creation of correct links. Completion is defined as the sum of the cumulative progress and explo-ration.
An illustration of the attacks unrolling is given in Figure . The figure represents the cumulative progress and exploration time series, highlighting the attacks and their direct impact. While none of these time series is sufficient by itself to capture different kinds of attacks, their combination is more informative. For this reasons we use the completion time series as the basis of our study of crowd behavior.
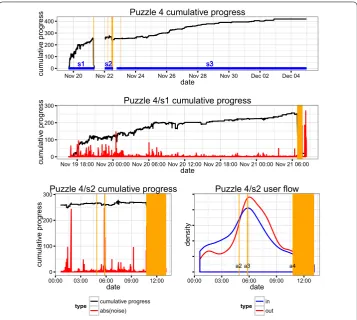
Fig-Figure 10 Progress and user flow in Puzzle 4.The first three panels represent the time series of the cumulative progress (black) and absolute value of instantaneous exploration (red) in Puzzle 4, plotted on the same scale, from top to bottom and left to right: (a) across the whole span of the solving, (b) during the section s1, as indicated in blue in the first panel (spanning from the start of the puzzle to before first rollback) and (c) during the section s2 (spanning between two rollbacks). The lower right panel (d) also corresponds to the section s2 and is the smoothed time series of users first moves (blue) and last moves (red). Spans of reported attacks are indicated in shaded orange area.
ure ). The two last measures capture the reactivity of the crowd, while the first captures its efficiency.
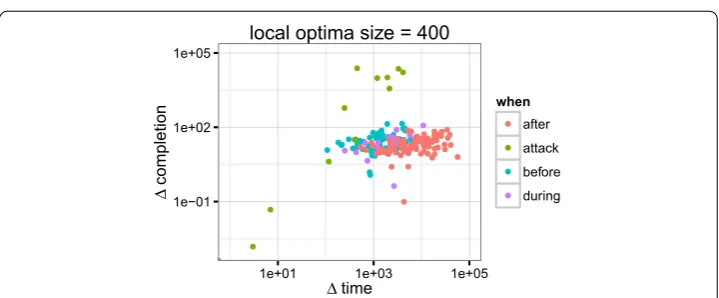
In order to rule out the impact of a particular choice of local optima size on the analysis, we computed the ratio before attack over after attack for each feature and for values of local optima size ranging from s to s. The ratios are remarkably stable, indicating that crowd behavior is invariant to the time resolution. Here we report their mean and standard error: completion= .±., time = .±.,same level= .± .. We can already see that on average, after the attack, the crowd is about ten times slower to recover from a drop in completion, and that it is about . times less efficient. We further refine analysis of the crowd behavior by studying it in details for a given size of the local optima size of s. See Section for more details on this particular choice. The local optima of Puzzle are plotted in Figure along two dimensions:timeand
completion. Optima are partitioned along a qualitative variable indicating when the optima
Figure 11 Measurement of crowd behavior.A set of 3 features is defined in order to numerically evaluate the behavior of the crowd. These features are based upon the set of local optima of the completion time series which measures the global achievement of a puzzle. This time series (black dots) is highly noisy and in order to focus on overall behavior the time series is first smoothed (green line) prior to finding the local optima. Local optima indicate remarkable points of the time series whose position in time and value summarize the progress and the efficiency of the crowd (local maxima are orange, local minima are yellow). We further refine this information into three measures to capture crowd behavior:completionthe difference
in completion between an optima and the next optima,timethe difference in time between an optima and
the next optima, andsame levelthe difference in time between a local maxima and the moment at which
the completion reaches back for the first time the same level as the maxima (indicated in purple for the first maxima of the figure). The local optima are local within a windows of a given size, as a consequence not all optima are included in the final features. Details about the choice of a particular local optima size are given in Figure 12.
Figure 12 Impact of attacks on crowd behavior.Scatter plot of two of the features (timeandcompletion)
for a given size of 400 s for the local optima of Puzzle 4. While the completion is discrete, the optima are based on a smoothed time series, resulting in a continuous scale for the featurecompletion. All attack local optima
but one clearly stand apart from the local optima outside attacks, their position correspond to different attack scales and operating modes. The clouds of point corresponding to normal regime indicates a progressive shift in crowd behavior between before and after attacks.
First, crowd behavior during attacks stands apart from the normal behavior. Second, there is a marked slowdown in crowd response time after the attacks.
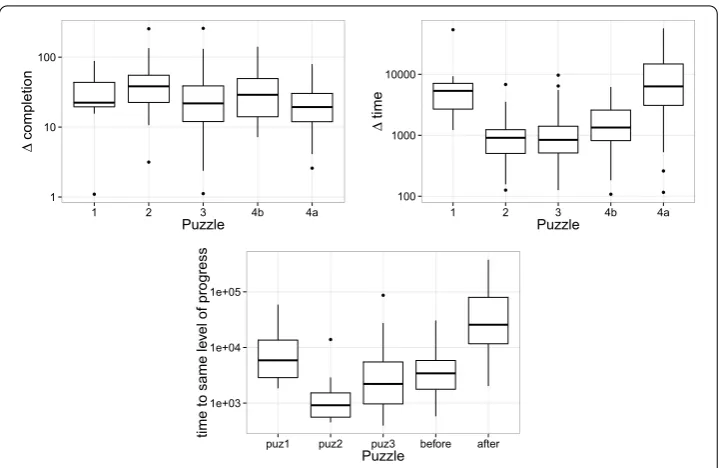
Figure 13 Impact of attacks on crowd behavior.Box-plots for each puzzle of the three crowd behavior features:completion(left panel),time(right panel), andsame level(lower panel). Puzzle 4b and 4a are Puzzle
4 respectively before and after the attacks. The box delimits the first and third quartile of the data, the dashed line the median. The whiskers extend to the most extreme points within 1.5 the interquartile range, others points are represented as outliers.
When considering the box-plot oftime, Puzzle and Puzzle after attacks clearly stand apart with a median difference in time magnitude slower than the baseline of the other puzzles. Specifically, Puzzle has a mean of min, which makes Puzzle before attacks . times slower and Puzzle after attacks . times slower. A likely explanation for the low reactivity in Puzzle is because the crowdsourcing effort had just started and the platform did not have enough users (c.f. Figure ), while Puzzle after the attacks lost momentum due to the attack itself.
When considering the box-plot ofsame level, Puzzle and Puzzle after attack stand apart even more clearly: Puzzle and before attacks have a mean time of about . hour, which is . times faster than Puzzle after attacks. This order of magnitude slow-down indicates the drastic impact of attacks on crowd performance.
.. Distributed attacks
Despite the attackers’ claim that they recruited a crowd of attackers onchan, it is diffi-cult to corroborate this claim from the data. Log analysis shows that all of the anonymous logins and IP addresses related to massive attacks are related to two real name emails. Moreover, at no time has there been more than two reported attackers acting simultane-ously. We are thus led to conjecture that there were only two individuals behind all the known attacks.
We have already seen, in Figure , that during the attacks the behavior of attackers and genuine users gets entangled. Nevertheless, Figure reassures us that we did not miss any important attacker as these clearly stand apart from the rest of the users.
of fact, the bulk of participants contribute only a few moves before leaving the system. Attackers with such a behavior are impossible to detect as their profile is too similar to normal users. Indeed, the only two such reported attackers were detected thanks to the acquaintance network inferred from logs.
It is therefore not possible with these methods to detect a crowd of unrelated distributed attacker, which is our concern in this section. This is a matter of concern as the combined effect of a large crowd of several low scale attackers could do as much damage as one large scale attacker and would also be significantly harder to detect.
However, upon further inspection of the data, it is possible to find clues, pointing to-wards a distributed attack. The span between the first rollback and the start of the large attack a is the time during which the alleged crowdsourced attack is most likely to have happened. Incidentally, it is also during this span that the behavior of users deviates most from the norm. This change in behavior is characterized by a high number of pileups, high user MPS and a low total number of moves.
Additionally, the smoothed time series of first and last moves within this span, reported in Figure (d), shows a sharp influx and outflux of users peaking during attack a. This indicates a massive wave of users joining and leaving immediately, which is what would be expected after an announcement onchan. During this time, significant noise is added to the system while no significant progress is achieved. However, such is also the case during the beginning of Puzzle , which experienced a massive influx and outflux of users with similar consequences.
We are therefore not able to elucidate whether achancrowdsourced attack actually took place. We can argue that if it did, its impact was negligible; and if it did not, this would mean that the original attackers failed to recruit even a small crowd of attackers. In both cases, we can conclude that for a crowdsourced attack to work, it is necessary and sufficient for the participants to be motivated as it is illustrated by the very large damage that only few users were able to infringe. Effective attackers may have belonged to a rival team and were clearly motivated by the $, prize at stake. Such was not the case for attackers recruited through the Internet. They had no incentive to attack the UCSD platform as it was not involved in any controversial (e.g. political) activity, and they had no financial gain from doing so. In contrast, the UCSD team’s strategy was altruistic, and promised to redistribute the potential prize wholly among the participants.
.. Attack recovery
Out of the five attacks the system sustained, two shattered all progress, and two had almost no effect. The two phases of attack a were separated by minutes without attacks during which users, despite trying, were unable to recover from the first phase. Thanks to the rollbacks, users did not have to start from scratch, but this prevents us from adequately measuring how users recover from attacks.
We were nevertheless able to study the recovery of a smaller undetected attack, attack a, which did not call for a rollback. This attack was not significant enough to be detected by the UCSD team but important enough to be detected by the crowd. We will therefore be able to describe crowd recovery only on this single attack. However, because of its small in scale, the conclusions we can draw from it are limited. The precise recovery capacity remains an open question that requires targeted experiments.
as the time to reach the same level of completion as before the attack, lasted second and involved moves from unique users that recovered of the disconnected correct edges.
Interestingly, recreating what has been destroyed took genuine users about . times the duration it took to perform the destruction. However, it took them about times more effort by times more users. The attack MPS was . for the attackers against . for the defenders, which is significantly above the average MPS of . around this attack. This indicates that users identified an attack and deployed frantic effort to counter it.
Most of the users present during recovery were genuine and actively reacted to the at-tack as indicated by Gini index of their move count which is .. This indicates a clear imbalance of power between attackers and defenders. Moreover, counting the number of moves as a proxy for the time individual users spent on recovery, we observe . man hours of work to defeat the damages inflicted in . man hours of works, i.e. an -fold increase in required effort.
Although the small scale of this particular attack made it easier to resist, it nonetheless illustrates the power imbalance that attackers have over genuine user. It can be expected that the time required to recover from an attack is super-linear in the number of pieces involved, while the destructive effort is linear.
.. Destructive effort
Rather than measuring the effort it takes to recover from an attack, we can also consider the efforts an attack needs to destroy what had been previously done. We also have a unique sample of this phenomenon: the effort it required the first attack to destroy most of the progress that was made since the beginning of puzzle . During this attack, all the assembled clusters were first scattered and then pieces were randomly piled on top of each others. After this attack the system was rolled back to a safe state.
Reaching the state of the puzzle before attack required , moves by users over hours. Destroying all progress required moves by one user and was done in minutes of scattering and minutes of piling. The user MPS of the attacker was ., which is considerably slower than normal behavior, and much slower than the MPS of subsequent massive attacks. This can be explained due to the low reactivity of genuine users who contributed only a total of moves by users during the span of this attack and an average period MPS ..
One attacker destroyed progress in about /th of the moves and /th of the time it took a crowd of several hundred users to create. The defenders were hapless. The im-balance of power is even starker in this sample.
3 Discussion
The question of how people organize to solve complex problems has always fascinated sci-entists. Of particular interest is the way incentives that shape individual behavior impacts the performance of the group [–], and how people are often able to overcome their self-interest to create sustainable communities []. However, it is often very difficult to observe a system of collective problem solving by observing every individual action. The data we collected from the DARPA Shredder Challenge provided us with unique oppor-tunity to do just that.
technique for problem solving, yet highly vulnerable to disruption. The crowdsourcing approach proved itself highly effective, as in a matter of days, the first three puzzles were solved. However, in the two remaining weeks the fourth puzzle, which was twice as large as the third puzzle, got completed only up to approximately %.
Crowd reaction to errors was efficient and seamless, with most errors recovered within minutes. However, the crowd was helpless against motivated attackers that could inflict damage far quicker than the crowd’s recovery.
Long term impact of the attacks has been a sharp decrease in participation and activity. Previously active users were driven away and new users possibly discouraged. If no dead-line is set for a crowdsourcing project, slowing down would not be an issue. However, such was not the case for the DARPA Shredder Challenge and each additional delay decreases the likelihood of winning, thereby reducing the motivation of users even further. Thus, the real impact of the attack was not to destroy the assembled pieces but to destroy the user base of the platform, and to disrupt the recruitment dynamics. We believe this is the main reason behind the inability of the UCSD team to win the challenge, which finished in the sixth position despite persistent large-scale attacks.
Openness is both the strength and the weakness of crowdsourcing. The power of crowd-sourcing lies in allowing a large number of individuals to contribute freely by giving them unfettered access to the problem. However, because the power and the freedom given to the users are important, crowdsourcing stops working as soon as users start abusing this power. Such abuse can happen to any crowdsourcing project. However, large widely-publicized projects, which naturally attract more attention, or projects involving political or financial stakes, may easily find highly motivated opponents.
A number of safeguards have to be placed in crowdsourcing systems. Monitoring is the first component, as prompt measures have to be taken in case of attacks. Monitoring and behavior assessment are not trivial issues, and require the design of problem-specific mea-sures for detecting attacks modes.
However, monitoring by itself cannot protect the system from damage. Actions such as banning users or IP addresses can help, but are inefficient against motivated, skilled, relentless, and adaptive attackers. Effective safeguards require constant (possibly auto-mated) monitoring to detect unusual behavior and, more importantly, to lower the po-tential threat of attackers by temporarily closing parts of the system. Such measures could control or restrict one or several mechanisms, such as user recruitment, reach and actions. It has to be noted thatWikipedia, arguably the largest open crowdsourcing platform in the world, is vulnerable to attacks. Such attacks, in the context of collaborative editing, can take the simple form of page defacing, or the more subtle biased rewriting. Page defacing can be easily detected by returning users and are easy to revert thanks to the edit history. To prevent small-scale attacks, a set of tools monitoring both the behavior and content of modification have been deployed to alert the crowd to suspicious updates. While users are not financially motivated inWikipedia, they are often politically motivated to establish their point of view.Wikipedia’s code of honor and neutral point of view policy does not prevent regular politically motivated attacks. In such a case the only effective measure is to lock down sensible page and only let reputable users contribute to them.
used proposing higher paid tasks only to users that have proved their efficiency on lower paid ones.
No security solution can be fully automated and all ultimately rely on the supervision of the behavior of the system by the crowd or the organizers []. While this may seem to de-feat the purpose of crowdsourcing, we believe that integrating security in crowdsourcing system design and investing resources in monitoring is fundamental. Any attacked crowd-sourcing project risks not only converging to the wrong solutions but, more importantly, losing its core driving force: its user base.
Crowdsourcing can be viewed as apublic good gamein which a group of strangers get to-gether to promote their collective well-being []. While these games create opportunities for individuals to free ride, thus leading to thetragedy of the commons[], competitive crowdsourcing has the added dimension of inter-group competition [–]. Although our data is insufficient to study inter-team dynamics, capturing such data is possible in future experiments. Nevertheless, our analysis of the limited anonymous attacks provide a glimpse of what such analysis might look like. Simulation-based models can potentially be helpful in exploring these types of complex dynamics [].
The recently proposedcrowdsourcing contest dilemmagame provides a starting point
for studying inter-group conflict in crowdsourcing []. Moreover, game-theoretic anal-ysis of incentives provides opportunities for designing mechanisms that encourage indi-viduals to fix errors, as we have demonstrated elsewhere []. These incentives are non-trivial. For example, one can explicitly reward people who contribute to ‘error recovery,’ but this may create incentives to collude with attackers who create an artificial need for such recovery.
4 Methods and dataset
All data collection was conducted using our custom-built crowdsourcing platform. A ded-icated web site includes further details about the system, recruitment etc. [].
4.1 Data and features .. Puzzle
The Shredder Challenge provided puzzles of increasing complexity. The puzzles were the result of processing papers through document shredders. As a result, the pieces were tiny but had a regular size. All of these documents were handwritten text of increasing density and quantity, except for Puzzle which was an image. It must be noted that the contestant were not required to solve all the puzzle to win the prize but had to answer specific questions. In order to do so, the answers had to found in part or totality of a document. Some artificial features like coffee mug marks, capital letters, different writing colors were introduced in the document to make solving the puzzles and answering the specific questions easier. As a consequence, the connection between puzzle time, solving time and effort is loose. Figure is a screenshot of the virtual board provided by the UCSD team to the public. The figure also depicts the solution of Puzzle .
.. Dataset
state before attacks and afterward study the behavior of the crowd and the reaction of the crowd in presence of disruption (this study). Among the data collected, two tables are of particular importance, the login table and the moves table. The login table is consti-tuted of: email, IP address and time stamps. It was used to detect connected components of users and help in classifying users into two groups: genuine users and attackers. This table contains , entries. The move table consists of the following tuples: update_id, piece_id, piece position ( coordinates:X,Yand rotation), email, IP address, time stamp. This table contains , entries made by , distinct users. From this raw data, we derived several measures and features that have been subsequently used to perform all the analysis presented in this paper.
We define a set of simple features that are associated with each move. As a result, we construct a time series for the resolution process and a set of simple features that are asso-ciated with each user. We also define complex measures for the crowd behavior through processing and aggregating the feature information in the time series. User features are also used to distinguish between attackers and genuine users, while the complex measures are able to distinguish most of the attacks from normal regime and allow us to quantify the impact of the attackers over the crowdsourcing process.
.. Features
We define several measures based on the dataset and from these we construct simple fea-tures that describe the progress of individual moves and the behavior of individual users. Also, we construct complex features that describe the aggregated behavior of the crowd.
These different features are used to understand the normal behavior of the system and accordingly to detect unusual behaviors that follow attacks and to assess their impact.
Progress.In order to capture how each move contributes to the solution of the puzzle, we define several progress measures associated with the move. Each of these measures is computed by comparing the neighboring pieces of the moved piece before and after the move to the actual neighboring pieces in the final state of the board when the puzzle is completed. More precisely, we count the progress related only to correct clusters of pieces that are hand identified in the final state of the board. We say that two pieces are placed correctly when they are linked in a final cluster, and incorrect otherwise. During the resolution, each piece can be linked and unlinked several times. We define the features CC (correct create) and CD (correct destroy) and associate them with the value of + or – when two correct pieces are respectively linked or unlinked. We similarly define IC (incorrect create) and ID (incorrect destroy) to refer to incorrect pieces and associate them respectively with a value of – or +. See Figure for illustration. The contribution made by correct edges is called progress and the contribution made by incorrect edges is called exploration or noise in the case of attacks. When a piece is piled over another one, that is to say two piece share the same location on the board. We discard the progress of both pieces if they are piled and count the move as a pile up.
Theexplorationtime series captures how incorrect links are created and destroyed. Ex-ploration is necessary to test the matching of different pieces. It is reported in the figures using its absolute value to show the quantity of effort that is put into exploration. The ac-tual value of exploration is null on average. Thecompletiontime series is defined as the sum of the cumulative progress and exploration. It is used to measure the crowd perfor-mance at solving puzzles. Time series of the number of first and last participation has been built in order to study the flux of users.
User behavior.In order to study the users’ behaviors, we define a set of features which are computed based on the progress related measures and the timing of their moves. Users’ contribution is irregular. They can participate only once but can also participate several times across the week, the day or the hour. As such, we distinguish continuous period of participation by setting a threshold of min. If two moves are made during the threshold, they are counted as being part of the same participation. Otherwise, they belong to two different participations. Once we define the participations of a user, we define also: the sum of moves, sum of duration, mean of moves and mean of duration and mean of moves per second (average user MPS over each participation). We also include the span of users’ participation and the time of their first and last move.
Crowd behavior.Crowd behavior is the combined effect of the action of different users. To study it, we define a set of complex features that are all based on the local optima of the completion time series. More precisely, we are interested in measuring the crowd reactiv-ity and its work qualreactiv-ity. For this purpose, we define three features: the time between two successive local optima (time), their difference in completion (completion) and the time between a local maxima and the moment when the completion reaches again the same level as the local maxima for the first time (same level). An illustration of their computa-tion are given in Figure . We define the MPS as the number of moves performed by the crowd during a given period divided by its length.
Because the completion time series is highly noisy, a smoothing is performed in order to remove the most important instantaneous fluctuation with a kaiser window of size and parameter beta set to . The corresponding smoothing time span is a function of the MPS which varies across several order of magnitudes. The parameters have been manually selected in order to remain close to the original time series while reducing the number of local optima due to instantaneous fluctuations, thereby focusing on the global behavior of the crowd. A side effect of the smoothing is that thecompletionis a lower bound of the actual variation of completion.
The impact of the choice of different local optima size over the values of the features is depicted in Figure . Small optima sizes can exhibit changes in the time series at an arbi-trary small scale, while large optima size are better able to characterize the global behavior of the crowd. Larger optima size makes also the attacks stand out more clearly.
While the actual value of the features for each size is different, the ratio of the values, as reported in Section .., is almost constant. This allow us to choose any particular value of local optima size for a detailed study of crowd behavior. We select a local optima size of s to focus more on the global behavior of the crowd and because it is the smallest value for which attacks become clearly separated from normal behavior.
.. Data cleaning
Figure 14 Impact of attacks on crowd behavior.The panels depict the influence of the local optima size over the mean and standard error of the features defined in Figure 11. A local optima is selected to be part of the computation of the features only if it is optimum within a centered time window. Colors denote the time at which the optima happened with respect to the attacks: before, after, during (the non-attack period between the first and last attack move) and during the attacks themselves. We can observe that while the value of the features of non-attack periods increase, their ratio remains constant.
take into account these time boundaries by considering them separate time series because of the sharp discontinuities. The computation of the complex features necessitated to take into account these same limits. This is the reason why for the time to same level feature, there are no points corresponding to attacks for local optima size larger than s: the system never had the time to fully recover from important loss before rollback. This lim-its our ability to quantify how efficiently the crowd reacted to attacks. However among the several attacks withstood by the system, one was important enough to have an impact over the progress but not enough important to require a rollback as the crowd was able to seamlessly fully recover from it.
4.2 Attacker detection
In order to detect attacks and attackers, we proceed in a layered way using increasingly sophisticated approaches. The first step is to use the database to perform a replay of each move of Puzzle and manually identify suspicious sets of moves. In order to do so, we generate a video where each moved piece left a trail on the board between its initial po-sition to its final popo-sition. Each frame of the video is comprised of hundred consecutive moves, thereby giving us a stepped global view of the crowdsourcing process. Figure gives an instance of such a video frame.
Figure 15 Attacker detection through user behavior.Each dot represents a user plotted along two features: the difference in time between his/her last and first move (span,x-axis) and the total number of exploratory moves (y-axis) on a log-log scale. A move is exploratory if it does not help or hinder progress directly. Large red dots in Puzzle 4 represent reported attackers. The two outliers on the upper left of Puzzle 4 are the fictitious users used to perform the rollbacks. Note that the term ‘exploration’ supposes a genuine intention behind the move. When the move is performed by an attacker, the term ‘noise’ is more accurate as the attacker intentionally adds unnecessary information to the system.
Figure 16 Video frame.Sample frame of the videos generated from the database. The videos replay all the moves that were performed on the virtual puzzle boards. Static pieces are white. Moved pieces are gray. Pieces moved by attackers are red and rollbacks are blue. The gray lines indicate the displacement of every moved piece. Timing and progress information are given in the lower left corner. Videos are available at the following URL: http://vimeo.com/user27628641.
Average users are small or medium scale contributors who participate outside the attacks, while they can also do detrimental move. There is no reasonable reason to attribute them as being part of a wider coordinated attack. Most of the subsequent work has been done in order to classify suspicious users as either genuine users, attackers or average users.
(a) independent (b) group (c) scatter (d) pile
Figure 17 Piece move patterns.Four most common patterns of pieces’ moves observable in the videos. The first two patterns correspond to normal behavior:(a)corresponds to crowd behavior of different users acting independently on different parts of the board,(b)corresponds to a single user behavior rearranging coherent cluster of pieces. The last two patterns are the attack. It has to be noted that pattern(c)is also used by genuine user to counter the effect of attackers using the pattern(d).
the videos four patterns of crowd behavior as depicted in Figure : () independent users moving pieces uniformly across the board, () a user focusing over a cluster: arranging the precise location of its pieces or moving all of them to a new position, () scattering stable clusters of pieces to random positions () piling up pieces. The first two patterns of behavior were used solely by genuine users while we doubt about the last two patterns. The last two patterns are mostly used by reported attackers. Nevertheless they have been used by some genuine users as well.
Using this simple method, we are able to identify two of the four groups of attacks. The attacks of smaller scales are evading us. Given these large scale attacks, it is easy to identify the attackers’ emails in the database by looking which email did massive participation at the same moment. However, attackers always acted while genuine users were presented in the system. The genuine users who spent a long time during solving the puzzle or partici-pated a lot, were easy to tell apart from attackers. They can be identified by looking at their participation records, plotting user names along side the videos and identifying the ones corresponding to moves that could not have been done by attackers: unstacking and rear-ranging pieces. However, this method remains imprecise, yielding many suspected users, principally among the ones with medium or small scale participation.
Social network.Through the previous method, we are able to identify emails of at-tackers. We then built from the login database, that provided IP-email relation, an ac-quaintance graph of users. Two users are accounted if they logged in at some point from the same IP or if there exists a path in the acquaintance graph between them. By using this method, we are able to identify several connected components of non trivial size (> users). Users with UCSD email addresses are connected to a dummy “UCSD” node in the graph. A user is considered genuine if the user belonged to the UCSD cluster or to a cluster that is reported as genuine.
The UCSD component contained the largest number of users. The second largest com-ponent of users is the one to which all of the five identified attackers belong to. Among the newly identified users of this component, only users made moves. Their naming pattern and disposable email address system that they used allow us to identify two more active attackers.
User features: progress related.In order to make sure that suspected attackers were ac-tual attackers, we have to look into the user features. Progress-related measures give a good indication of attackers, even though they are not perfect. No single user feature that is considered alone can group attackers together. It is remarkably also the case for progress. However, this feature as well as exploration and the number of pile ups can give a loose indicator.
By grouping these features together, we get much better classification rules. However, there is no combination of rules that is able to classify perfectly the reported attackers. Considering the sum of the cumulative progress and the exploration, it is possible to get a much better decision rule as out of the attackers that performed moves clearly stand apart in one group. One of these attackers made a negligible number of contributions, but the other was the attacker removing pieces and totally evaded this mode of detection as its impact over the progress was null.
Having a decision rule that is learned on the reported attacker would allow us to filter the database and automatically classify users as attackers or genuine users. However, it is impossible to perfectly classify the few reported attackers, since attacks employed different behaviors in reaction to the defensive strategies exhibited by the crowd. Therefore attacks had different impact on progress measures. Scattering destroyed progress but generated no noise; pilling had a low impact over progress while generating considerable noise; and piece removal was transparent on any progress related measure.
User features: behavior related.For each kind of attack, we have to find the suitable set of features that is able to isolate attackers. However, no such choice makes attackers perfectly separable from the rest of the users and each one of them would detect the set of suspicious users. When looking at progress related measures, users looked strongly suspicious. However, looking at behavior related features was possible to classify them as genuine user as we explain as follows.
By behavioral features, we refer to non-problem specific measures which are more generic features like the span of participation, number of contribution and average con-tribution length. In Figure , each user represents a point and is plotted according to the total number of moves he/she performed and the total number of seconds he/she partic-ipated. The color indicates the type of the users: black dots denote genuine users and red dots reported attackers. All suspicious users, when looking a their progress feature, had a behavior totally in par with the one of genuine users. It has to be noted that the two attackers in the middle of the genuine users correspond to the two emails sent during the first attack which was very slow paced. All subsequent reported attacks had a much faster pace, making them stand clearly apart.
re-move the ambiguity for half of the suspicious users but not all of them. They might be part of a crowdsourced attack or not.
Additional material
Additional file 1: Video of Puzzle 2 (successful completion).Video of every move made by the crowd in solving puzzle 2. Each shred is shown as a circle (content is not shown to simplify the visualization).
Additional file 2: Video of Puzzle 4 (crowd response to sabotage).Video of every move made by the crowd in solving puzzle 4. Recognized attacks are indicated and slowed down.
Competing interests
The authors declare that they have no competing interests.
Authors’ contributions
MC collected and preprocessed the data. MC and IR designed the research. NS and AA performed the numerical calculations. MC and IR analyzed the results. IR was the lead writer of the paper. NS, AA, MC and IR wrote the paper.
Author details
1Masdar Institute of Science and Technology, Abu Dhabi, 54224, UAE.2School of Informatics, University of Edinburgh,
Edinburgh, UK. 3National Information and Communications Technology Australia, University of Melbourne, Melbourne, Victoria 3010, Australia.4Department of Computer Science and Engineering, University of California at San Diego, La Jolla, CA 92093, California, USA.
Acknowledgements
We would like to thank Karyn Benson, Andrea Vattani and Daniel Rickets for collecting and preprocessing the behavioral dataset. MC is supported by NICTA, which is funded by the Australian Government as represented by the Department of Broadband, Communications and the Digital Economy and the Australian Research Council through the ICT Centre of Excellence program.
Received: 13 March 2014 Accepted: 26 August 2014
References
1. Howe, J (2006) The rise of crowdsourcing. Wired Magazine 14(6) 2. Hand E (2010) Citizen science: people power. Nature 466(7307):685-687
3. von Ahn L, Maurer B, McMillen C, Abraham D, Blum M (2008) reCAPTCHA: human-based character recognition via web security measures. Science 321(5895):1465-1468
4. von Ahn L (2006) Games with a purpose. Computer 39(6):92-94
5. Salesses P, Schechtner K, Hidalgo CA (2013) The collaborative image of the city: mapping the inequality of urban perception. PLoS ONE 8(7):e68400
6. Horowitz D, Kamvar SD (2010) The anatomy of a large-scale social search engine. In: Proceedings of the 19th international conference on world wide web. ACM, New York, pp 431-440
7. Huberman BA, Romero DM, Wu F (2009) Crowdsourcing, attention and productivity. J Inf Sci 35(6):758-765 8. Cooper S, Khatib F, Treuille A, Barbero J, Lee J, Beenen M, Leaver-Fay A, Baker D, Popovi´c Z, Players F (2010) Predicting
protein structures with a multiplayer online game. Nature 466(7307):756-760
9. Mason W, Suri S (2012) Conducting behavioral research on Amazon’s Mechanical Turk. Behav Res Methods 44(1):1-23 10. Hellerstein JM, Tennenhouse DL (2011) Searching for Jim Gray: a technical overview. Commun ACM 54(7):77-87 11. Zhang H, Horvitz E, Chen Y, Parkes DC (2012) Task routing for prediction tasks. In: Proceedings of the 11th
international conference on autonomous agents and multiagent systems - volume 2. International Foundation for Autonomous Agents and Multiagent Systems, Richland, pp 889-896
12. Alstott J, Madnick SE, Velu C (2013) Predictors of social mobilization speed. CoRR abs/1303.3805 13. Barrington L, Turnbull D, Lanckriet G (2012) Game-powered machine learning. Proc Natl Acad Sci USA
109(17):6411-6416
14. Rahwan I, Dsouza S, Rutherford A, Naroditskiy V, McInerney J, Venanzi M, Jennings NR, Cebrian M (2013) Global manhunt pushes the limits of social mobilization. Computer 46(4):68-75
15. Pickard G, Pan W, Rahwan I, Cebrian M, Crane R, Madan A, Pentland A (2011) Time-critical social mobilization. Science 334(6055):509-512
16. Bernstein MS, Little G, Miller RC, Hartmann B, Ackerman MS, Karger DR, Crowell D, Panovich K (2010) Soylent: a word processor with a crowd inside. In: Proceedings of the 23nd annual ACM symposium on user interface software and technology, pp 313-322. ACM
17. Surowiecki J (2004) The wisdom of crowds: why the many are smarter than the few and how collective wisdom shapes business, economies, societies and nations.
18. Mason W, Watts DJ (2010) Financial incentives and the performance of crowds. ACM SIGKDD Explor Newsl 11(2):100-108
19. Tran-Thanh L, Venanzi M, Rogers A, Jennings NR (2013) Efficient budget allocation with accuracy guarantees for crowdsourcing classification tasks. In: Proceedings of the 2013 international conference on autonomous agents and multi-agent systems, pp 901-908. International Foundation for Autonomous Agents and Multiagent Systems 20. Karger DR, Oh S, Shah D (2011) Budget-optimal task allocation for reliable crowdsourcing systems. CoRR