R E S E A R C H
Open Access
Homeobox gene expression in acute myeloid
leukemia is linked to typical underlying molecular
aberrations
Karolina Skvarova Kramarzova
1, Karel Fiser
1, Ester Mejstrikova
1,2, Katerina Rejlova
1, Marketa Zaliova
1,
Maarten Fornerod
4,6, Harry A Drabkin
5, Marry M van den Heuvel-Eibrink
4, Jan Stary
3, Jan Trka
1,2*and Julia Starkova
1Abstract
Background:Although distinct patterns of homeobox (HOX)gene expression have been described in defined cytogenetic and molecular subsets of patients with acute myeloid leukemia (AML), it is unknown whether these patterns are the direct result of transcriptional alterations or rather represent the differentiation stage of the leukemic cell.
Method:To address this question, we used qPCR to analyze mRNA expression ofHOXAandHOXBgenes in bone marrow (BM) samples of 46 patients with AML and sorted subpopulations of healthy BM cells. These various stages of myeloid differentiation represent matched counterparts of morphological subgroups of AML. To further study the transcriptional alterations ofHOXgenes in hematopoiesis, we also analyzed gene expression of epigenetic modifiers in the subpopluations of healthy BM and leukemic cells.
Results:Unsupervised hierarchical clustering divided the AMLs into five clusters characterized by the presence of prevalent molecular genetic aberrations. Notably, the impact of genotype onHOXgene expression was significantly more pronounced than that of the differentiation stage of the blasts. This driving role of molecular aberrations was best exemplified by the repressive effect of thePML-RARafusion gene onHOXgene expression, regardless of the presence of theFLT3/ITDmutation. Furthermore,HOXgene expression was positively correlated with mRNA levels of histone demethylases (JMJD3andUTX) and negatively correlated with gene expression of DNA methyltranferases. No such relationships were observed in subpopulations of healthy BM cells.
Conclusion:Our results demonstrate that specific molecular genetic aberrations, rather than differentiation per se, underlie the observed differences inHOXgene expression in AML. Moreover, the observed correlations between epigenetic modifiers andHOXex pression that are specific to malignant hematopoiesis, suggest their potential causal relationships.
Keywords:Acute myeloid leukemia, Homeobox genes, Myelopoiesis, Epigenetic modifiers
* Correspondence:jan.trka@lfmotol.cuni.cz
1CLIP–Childhood Leukaemia Investigation Prague, Department of Paediatric Hematology and Oncology, 2nd Faculty of Medicine, Charles University Prague, Prague, Czech Republic
2CLIP–Childhood Leukaemia Investigation Prague, Department of Paediatric Hematology and Oncology, 2nd Faculty of Medicine, University Hospital Motol, Prague, Czech Republic
Full list of author information is available at the end of the article
Introduction
The clustered homeobox (HOX) genes encode a large family of transcription factors characterized by the pres-ence of a highly conserved nucleotide sequpres-ence called the homeodomain. This 61-amino-acid helix-turn-helix do-main is responsible for the binding of HOX proteins to their target DNA sequences. In humans, the 39 HOX genes are organized into four genomic regions (theHOXA,
B, C and D clusters) located on four chromosomes
(chromosomes 7, 17, 12 and 2, respectively). Each cluster consists of 9–11 genes arranged in the same orientation and in paralogous groups [1,2].
HOX genes play essential roles during embryogenesis by controlling cell fate along the anterior-posterior axis and specifying segment identity [3-5]. The characteristic expression ofHOXgenes can also be detected in various adult tissues [6,7]. During hematopoiesis, the highest
ex-pression of HOX genes occurs in the stem and early
hematopoietic progenitor cells. During maturation,HOX expression gradually decreases, and it is minimal in dif-ferentiated hematopoietic cells [8,9]. The expression of HOXgenes throughout the maturation of hematopoietic cells is tightly regulated, suggesting that disruption of this regulation contributes to the process of malignant transformation.
The oncogenic potential ofHOXgenes in leukemia has been intensively studied for more than two decades. Sev-eral chromosomal translocations in leukemia involveHOX genes either directly (e.g.,NUP98-HOXfusion) or via their upstream regulators (e.g., MLL rearrangements) [10-13]. Moreover, the overexpression of certain HOX genes and their cofactors are known as poor prognostic markers in leukemia patients [14-16]. The overexpression of HOX genes is believed to induce myeloproliferation, which to-gether with additional aberrations, may lead to leukemia.
The regulation of gene expression during hematopoie-sis is controlled by the cooperation of transcription fac-tors and the dynamic architecture of chromatin. The specific epigenetic landscape influences target gene ac-cessibility. As major executors of epigenetic regulation, chromatin-modifying enzymes mediate DNA and his-tone modifications responsible for the unique dynamics of chromatin observed throughout hematopoiesis. The deregulation of this process likely contributes to the ma-lignant transformation of hematopoietic cells.
In embryogenesis, spatio-temporal expression of HOX genes is regulated by the trithorax-group (TrxG) and
polycomb-group (PcG) proteins. PcG genes maintain
HOXgene silencing through methylation of histone 3 ly-sine 27 (H3K27). In contrast,TrxGgenes are responsible for maintaining previously establishedHOXgene expres-sion through trimethylation of histone 3 lysine 4 (H3K4) [8,17]. A similar effect ofPcG andTrxG genes has been proposed in the regulation of HOX gene expression in
hematopoiesis as suggested by the severe defects of hematopoietic cells that have been reported in PcGand TrxG knock-out models [18,19]. In addition, the H3K4
demethylase LSD1 and JmjC-domain-containing H3K27
demethylasesJMJD3 (KDM6B)and UTX (KDM6A)have
been shown to contribute to HOX gene regulation in
embryonic development [20,21]. LSD1 establishes an in-active chromatin configuration by H3K4 demethylation, whereas JMJD3 and UTX activate chromatin by demeth-ylation of H3K27. Finally, DNA methdemeth-ylation has been shown to participate in the establishment ofHOX gene expression patterns, further supporting the role of epi-genetics in the regulation of these genes [22].
In this paper, we sought to determine whether the
pat-tern of leukemic HOX gene expression was primarily
driven by the differentiation stage of hematopoietic cells or determined de novo during the process of malignant transformation. To approach this question, the expres-sion patterns of theHOXgenes were correlated with the molecular genetics and morphological characteristics of the leukemic cells of patients with childhood acute mye-loid leukemia (AML). To further study the regulation of HOX gene expression, we also examined the relation-ships of chromatin modifiers andHOX genes in normal and malignant myelopoiesis.
Methods
BM samples of healthy donors and patients with AML Subpopulations of healthy BM representing developmen-tal stages of hematopoiesis were sorted from the samples of healthy volunteers or minimal residual disease (MRD)-negative leukemia patients in long-term complete remis-sion (Fluorescence Activated Cell Sorter (FACS) Aria, BD, San Jose, CA, USA). The combination of surface markers that was used to identify the particular stages of myeloid lineage differentiation is listed in Table 1. To ensure ad-equate analysis sensitivity, we pooled the sorted samples of each subpopulation from five control donors and proc-essed them as described below.
In total, 46 patients with childhood AML enrolled in the study were diagnosed and treated from 1998 to 2010 at the Czech Pediatric Hematology Working Group cen-ters (Additional file 1: Table S1). Following the University Hospital Motol ethical committee's approval number P304/12/2214 and written informed consent, mono-nuclear cells were isolated from the diagnostic BM sam-ples using a density gradient medium (Ficoll-Paque Plus, GE Healthcare Life Sciences, Uppsala, Sweden) and stored at−80°C.
Real-time quantitative polymerase chain reaction (qPCR) The quantification of gene expression was performed using the iCycler iQ System (BioRad, Hercules, CA, USA). The primer design and qPCR conditions for amplification of theHOXAandHOXBgenes in the sorted populations (HOXA3, A4, A5, A6, A7, A9, A10, B2, B4, B5, B6,and B7) and patient samples (HOXA1, A3, A4, A5, A6, A7, A9, A10, A11, A13, B1, B2, B4, B5, B6, B7, B8, andB9) as well as the chromatin modifier genes (PcG family: EZH2 and BMI1; Trx family: MLL; DNMTs: DNMT1, DNMT3a,andDNMT3band histone demethylases:JMJD3, UTX and LSD1) were performed as previously described [14,15,20,23-25]. To normalize the gene expression levels, we used theABL1 gene, which is known to be stably ex-pressed during the development of myeloid lineage cells.
Mutation analysis
The mutation statuses of theNPMI, NRAS, KRAS, CEBPa, c-KITandFLT3genes were determined in 12 patients for whom material was available and who were negative for the presence of the four major molecular aberrations (Additional file 1: Table S1). The analysis was performed by qualitative PCR followed by the sequencing of particu-lar amplicons with the primers and PCR conditions as de-scribed earlier [26-29].
Statistical analysis
Data were analyzed using the statistical software packages Prism (GraphPad, La Jolla, CA, USA), Excel (Microsoft Corporation, Redmond, WA, USA), StatView (SAS Institute, Cary, NC, USA) and R-project (Vienna, Austria). The statistical significance of the differences among the sub-groups of samples was assessed using non-parametric tests (Mann–Whitney and Kruskal–Wallis tests with Dunn’s multiple comparison post test). Gene expression correlations were estimated by Spearman’s rank correlation.
Unsupervised hierarchical cluster analysis (HCA), per-formed with the Genesis software (Institute for Geno-mics and Bioinformatics, Graz University of Technology (IGB-TUG), Graz, Austria), was used to identify the subgroups of samples with similar gene expression patterns.
Results
Expression patterns ofHOXgenes in sorted
subpopulations of healthy BM cells representing different stages of myelopoiesis
Using FACS, we obtained eight subpopulations of normal BM donor cells, based on characteristic surface markers, which represent distinct stages of myeloid differentiation. The subpopulations corresponding with particular matur-ation stages were selected based on our expertise and pre-viously published studies (Table 1) [30-32]. Notably, we frequently observed the asynchronous expression of anti-gens and the overlap of immunophenotypic maturation stages in the leukemic blasts.
To better demonstrate the dynamics of HOX gene
expression throughout hematopoiesis, data from the subpopulations of the two developmental lineages of myelopoises (granulocytic and monocytic) with the par-allel differentiation stage were pooled together. This re-sulted in the discernment of four consecutive stages of myeloid development (stage 1 = G1 + M1, stage 2 = G2 + M2, stage 3 = G3 + M3 and stage 4 = G4 + M4). In accord-ance with previously published data, the expression of
HOXAand particularHOXB(HOXB2andHOXB4) genes
gradually decreased during myeloid maturation (Figure 1A and Additional file 2: Figure S1). As assessed by compari-sons on an one-to-one basis we also observed a clear posi-tive correlation of HOX gene expression within HOXA cluster andHOXBcluster as well as between both clusters (Additional file 3: Figure S2).
Table 1 Identification of subpopulations of healthy BM cells
Normal sorted populations of myeloid lineage Counterparts with FAB AML
Granulocyte lineage subpopulations
G1 myeloid progenitor CD117+CD15-CD11b- AML M1 AML M2
G2 promyelocyte CD117+CD15+CD11b- AML M3 AML M2
G3 promyelocyte-myelocyte
CD117-CD13++CD16-G4 myelocyte
CD117-CD13dimCD16-Monocyte lineage subpopulations
M1 myeloblast CD34+SSc++HLA DR+CD33- AML M1-M0
M2 myelo/monoblast CD34+Ssc++HLA DR+CD33+ AML M2
M3 promonocyte CD34-FSc and Ssc corresponding to monocytes CD33+CD14- AML M4 - AML M5a
M4 monocyte CD34-FSc and Ssc corresponding to monocytes CD33+CD14+ AML M5b
Expression patterns ofHOXgenes in BM samples from patients with childhood AML
DistinctiveHOXgene expression patterns were observed among the French-American-British classification (FAB) AML subtypes (Kruskal-Wallis test: p < 0.0001 for the HOXA and p = 0.0016 for the HOXB cluster; Figure 1B and Additional file 4: Figure S3). The M3 FAB subtype had the lowest levels ofHOXAandHOXBgene expression
compared with other FAB subtypes (see Additional file 4: Figure S3). In contrast, AML M5 had the highestHOXA gene expression levels, along with the largest number of individual HOXA genes showing significant differential expression (Additional file 4: Figure S3). Significant dif-ferences were also found among subgroups defined ac-cording to molecular genetics (i.e., Kruskal-Wallis test: p < 0.0001 for the HOXA and p = 0.0001 for theHOXB
HOXAgenes - healthy BM
relative expression [au]
Stage 1 Stage 2 Stage 3 Stage 4 -4
-2 0 2 4
HOXBgenes - healthy BM
relative expression [au]
Stage 1 Stage 2 Stage 3 Stage 4 -4
-2 0 2 4
B
A
HOXAgenes - FAB subtypes
relative expression [au]
M0 M1 M2 M3 M4 M5
-4 -2 0 2 4
HOXBgenes - FAB subtypes
relative expression [au]
M0 M1 M2 M3 M4 M5
-4 -2 0 2 4
C
HOXAgenes - Molecular aberrationsrelative expression [au]
RU NX1-RUN
X1T1 PML-R
ARa
CB
Fb-MYH 11
MLL neg
-4 -2 0 2 4
HOXB genes - Molecular aberrations
relative expression [au]
RUNX1-RU
NX1T1 PM
L-RARa
CBF b-MYH1
1
MLL neg
-4 -2 0 2 4
Figure 1Expression levels ofHOXAandHOXBgenes in subpopulations of healthy BM and samples of patients with AML. A. four
cluster; Figure 1C and Additional file 5: Figure S4). Pa-tients with PML-RARa fusion showed the lowest levels
ofHOXAandHOXBgene expression, while those with
MLL rearrangements expressed HOXA genes at the
highest levels (the majority of individual HOX gene comparisons revealed significant differential
expres-sion in the PML-RARa and MLL+ patients,
respect-ively). Moreover, unsupervised hierarchical clustering
based on HOX expression divided the leukemias into
five main clusters characterized by the presence or ab-sence of prevalent gene rearrangements, i.e.,PML-RARa, RUNX1-RUNX1T1(AML1-ETO),CBFb-MYH11and MLL alterations (Additional file 6: Figure S5). Interestingly, three patients from cluster 1 (i.e., those having the over-all highest levels of HOX gene expression and absence of these translocations) harbored a mutation in the NPM1gene, similar to what has been reported in adult AML [16].
High risk (HR) patients expressedHOXAgenes at sig-nificantly higher levels compared with patients who were assigned to the standard risk (SR) group (p < 0.0001 for HOXA3 - A13and p = 0.0004 forHOXA1). However, no differences were observed inHOXB expression between high and low risk patients. In addition, bothHOXAand HOXB gene expression were not found to be related to the patient age or risk stratification (Additional file 7: Figure S6; risk group stratification of childhood AML (AML-BFM 98 and 2004): standard risk - FAB M1/M2 with Auer rods, M3, M4eo, Down sy, t(8;21), t(15;17), inv(16), and≤5% of blasts in BM at D15 (except M3); high risk - others).
Impact of molecular aberrations onHOXgene expression within the morphological subgroups of AML
The effects of genetic aberrations on HOXgene expres-sion were even more apparent when analyzed within the
morphological FAB subtypes. In AML M4, the
CBFb-MYH11+ patients exhibited statistically significant levels of lowerHOXexpression compared with those lacking the
rearrangement. For AML M2, theRUNX1-RUNX1T1+
pa-tients tended to show reduced levels ofHOXgene expres-sion compared with patients without the rearrangement (Figure 2A and 2B; p values indicated in figure legend).
Different effect ofFLT3/ITDonHOXgene expression in the presence of PML-RARa fusion gene
In adults with normal cytogenetic AML,NPMI1mutations are associated with highHOXexpression and those leuke-mias have a higher frequency of FLT3mutations [33]. In our samples,HOXgene expression in thePML-RARa+ pa-tients remained at very low levels regardless of the presence of FLT3/ITD mutations (FLT3/ITD+ (N = 4) vs. FLT3/ITD- (N = 4); Figure 3A; p values indicated in figure legend). In contrast, in the absence of a
PML-RARa fusion,HOX levels were higher when FLT3 was
mutated. These results were further emphasized by the analysis of gene expression data from a larger (N = 48)
independent cohort ofFLT3/ITD+ childhood AML
pa-tients [34], which demonstrated thatHOXAandHOXB
gene levels were significantly reduced in FLT3/ITD+
patients with PML-RARa (N = 12) compared to those
without the fusion gene (N = 36; Figure 3B).
HOXgene expression patterns in corresponding differentiation stages of normal and malignant myelopoiesis
As indicated above, we sorted the subpopulations of nor-mal BM cells from the healthy donors according to the specific stage of myelopoiesis. Our gating strategy enabled a comparison of these subpopulations with the FAB sub-types of AML patients exhibiting the similar stage of mye-loid maturation arrest. The list of AML subtypes assigned to particular stages of myelopoiesis is provided in Table 1. Differential HOX gene expression patterns were identi-fied between the normal and malignant hematopoietic counterparts, as demonstrated by comparing AML M3 with the corresponding stage of promyelocytes (ID = G2). These differences were particularly evident for HOXA5, HOXA6, HOXA9, HOXA10andHOXB4(Figure 4). Simi-larly, differential expression ofHOXA3, HOXA4, HOXA5, HOXA6, HOXA7, HOXA9,HOXA10, HOXB5andHOXB6 distinguished leukemic cells of the M5a and M5b FAB subtypes from the matched normal counterparts, repre-sented by the sorted M3 and M4 population, respectively (Additional file 8: Figure S7A and 7B).
Expression patterns of chromatin modifiers and their role inHOXgene regulation
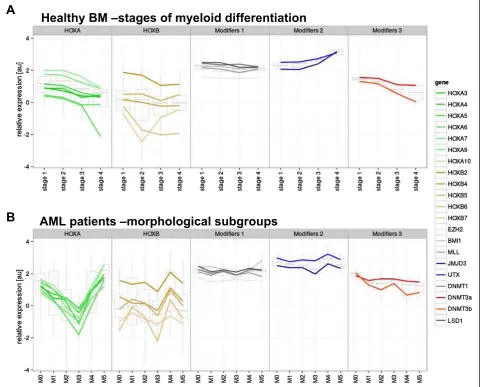
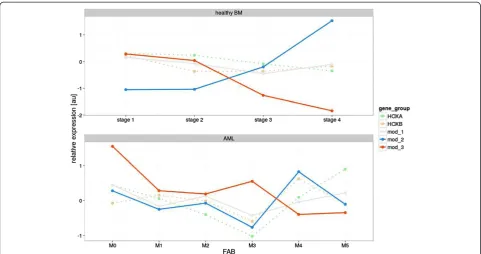
In subpopulations of healthy BM cells, we analyzed the ex-pression of chromatin modifying genes, previously shown to contribute toHOXAandHOXBregulation during em-bryogenesis [21,35,36]. Based on observed expression in the sorted subpopulations, the chromatin modifiers were divided into three groups. The first group, “Modifiers 1”, included genes that did not exhibit varying expression levels during differentiation (EZH2, BMI1, MLL, LSD1 andDNMT1). The second group,“Modifiers 2”, consisted of genes showing increased expression during hemato-poiesis (JMJD3 and UTX). Expression levels of the third group,“Modifiers 3” (DNMT3aand DNMT3b), showed a decrease concomitant with differentiation, which were sta-tistically inversely correlated with Modifiers 2 (R =−0.922; Figure 5A). However, we did not observe a clear pattern of corresponding HOXgene expression changes in these cells.
subgroups. The expression of Modifier 2 and 3 genes markedly differed among AML samples (Figure 5B). In contrast to normal cells, the expression of Modifier 2 and 3 genes appeared to mirror the differences inHOXmRNA levels. In general, HOXB expression was positively cor-related with Modifier 2 genes (e.g., H3K27 demethylases; R = 0.874). The correlation ofHOXAgene expression levels with Modifiers 2 genes was less pronounced (R = 0.506) in all cases with the exception of the AML M3 subgroup. For the Modifier 3 genes (e.g.,DNMTs), there was a substantial negative correlation with HOXB expression (R =−0.442; Figure 6). However, in contrast to normal hematopoiesis,
the observed inverse correlation between Modifier 2 and 3 genes was much less pronounced (except for AML M3 and M4; R =−0.178; Figure 6).
For individual genes in the leukemic samples (Additional file 9: Figure S8), there were several notable correlations. For instance, the expression of JMJD3 with HOXB4 and HOXB6 was strongly positively correlated (p = 0.0003 and 0.0012, respectively), while negatively correlated with DNMT3b (p = 0.03). There was also strong correl-ation on a one-to-one basis between genes in theHOXA cluster and for genes in the HOXB cluster. However, in contrast with the healthy samples, there was only a weak
A
B
relative expression [au]
HOXA1 HOXA 3
HOXA4 HOXA 5
HOXA6 HOXA 7
HOXA9HOX A10
HOX A11
HOX A13
HOX B1
HOXB 2
HOX B4
HOXB 5
HOXB 6
HOXB 7
HOXB 8
HOXB9 -4
-2 0 2
4
RUNX1-RUNX1T1-RUNX1-RUNX1T1+
relative expression [au]
HOXA1 HOXA3 HOX
A4
HOX
A5
HOX
A6
HOXA7 HO XA9
HOXA 10
HOXA1 1
HOXA13 HOXB1 HOX
B2
HOX
B4
HOXB5 HOXB6 HOX
B7
HOX
B8
HOX
B9
-4 -2 0 2
4
CBFb-MYH11-CBFb-MYH11+
Figure 2DifferingHOXgene expression levels observed in FAB subtypes with respect to the presence of typical molecular
aberrations. A.CBFb-MYH11+/−patients with AML M4. Asterisks indicated statistical significance (*≤0.05, **≤0.01; additional borderline significance: p = 0.0679 forHOXA7, HOXA10andHOXB9, p = 0.0732 forHOXA13);B.RUNX1-RUNX1T1+/−patients with AML M2. Asterisks indicated statistical significance (*≤0.05, **≤0.01; additional borderline significance: p = 0.1745 forHOXA5, p = 0.1745 forHOXA9and P = 0.1172
correlation between the particularHOXgenes from differ-entHOXclusters.
Discussion
Several reports have demonstrated that HOX genes are not only potent regulators of embryonic development but also play significant roles in the regulation of many processes in adult organisms, including hematopoiesis [37-39]. The overall role ofHOXclusters in addition to
that of particular HOX genes in hematopoiesis have
been revealed by various knock-out and overexpression studies of human hematopoietic cells or by studies using
mouse models [40-43]. However, the degree to which HOXgenes contribute to the process of leukemogenesis has not yet been elucidated.
The aberrant expression of HOX genes has been re-ported in the majority of leukemia patients. However, it remains unknown whether this aberrant expression repre-sents a genuine driver of leukemogenesis or a passenger effect reflecting a differentiation block. Another possible explanation takes into consideration an impact of the mo-lecular aberrations present in leukemic cells with further biological consequences. Here, we attempted to shed light on the expression ofHOXgenes in normal hematopoietic
A
relative expression [au]
HOXA 1
HOXA3 HOXA4 HO XA5
HOXA 6
HOXA 7
HOXA9HOX A10
HO XA11
HO XA13
HOXB1 HOXB2 HO XB4
HOXB 5
HOXB6 HOXB7 HO XB8
HOXB 9
-4 -2 0 2
4
FLT3/ITD-FLT3/ITD+
B
Figure 3DifferingHOXgene expression levels observed inPML-RARa+ patients with respect to the presence ofFLT3/ITD. A.HOXgene
precursor cells versus their malignant counterparts with respect to their differentiation stage arrest in AML.
The crucial prerequisite for such an analysis is the ap-propriate identification of subpopulations of healthy BM cells representing the stages of myelopoiesis that can be matched to their respective morphological counterparts in AML. We managed to sort these subpopulations and analyzed theirHOXgene expression patterns. The expres-sion ofHOXgenes was higher at the initial stages of he-matopoiesis and gradually decreased with the maturation of the hematopoietic cells, supporting the generally ac-cepted hypothesis thatHOXgenes are strong regulators of hematopoiesis (particularly at the early stages) [37].
A comparison of matched normal and malignant hematopoietic precursor cells at the same differentiation stage demonstrated the distinct expression patterns of theHOXgenes in the leukemic cells. This indicates that the aberrant patterns ofHOXgene expression cannot be simply explained by the differentiation statuses at which the cells have been arrested. This is similar to what we previously observed in pediatric patients with ALL, who were found to exhibit differential HOX gene expres-sion between the subgroups and their matched nor-mal precursors according to differentiation stage [15]. Altogether, our results support the hypothesis that the dysregulation of HOX genes is involved in the process of neoplastic transformation.
The analysis of childhood AML patients revealed a dif-ferent expression profile of HOX genes among the FAB subtypes and the subgroups of patients bearing unique molecular rearrangements. The most diverse subgroup of AML was AML M3, which showed the lowest levels ofHOXgene expression. This subgroup is characterized
by the presence of the PML-RARa fusion gene, which
generates an aberrant retinoic acid receptor unresponsive
to the physiological levels of this molecule. RUNX1-RUNX1T1+,CBFb-MYH11+andMLL-rearranged AML patients also showed uniqueHOX gene expression pat-terns.MLLrearrangements have been previously shown
to have a determinant role on HOX gene expression
[44]. Moreover, we revealed that AML patients bearing thePML-RARafusion gene had low expression levels of
the HOX genes regardless of FLT3/ITD status. This
finding is even more interesting considering thatFLT3/ ITD has been shown to be associated with the upregu-lated expression ofHOXgenes in leukemia patients [33]. Therefore, we performed an analysis of a larger cohort of AML patients [34] from Erasmus MC-Sophia Chil-dren’s Hospital and replicated the results drawn from our cohort of pediatric AML patients. This analysis showed that despite the overall upregulation of the
HOXgenes inFLT3/ITD+ AML patients,HOXgene
ex-pression in FLT3/ITD+ PML-RARa+patients was signifi-cantly lower compared to theFLT3/ITD+patients without this fusion protein. Therefore, in this case, thePML-RARa fusion gene may be superior toFLT3/ITDwith respect to its role in the process of malignant transformation. Based on these results, we suggest that AML-specific fusion oncoproteins may impact the upstream pathways that deregulate the HOX genes, thereby acting as the major underlying factors of their characteristic expres-sion patterns observed in leukemic cells.
Our analysis of the AML patients also showed sig-nificantly lower expression levels of HOXA in the SR compared with the HR patients (in accordance with a previous study [14]). These results suggest that the
as-sessment of HOX gene expression patterns may allow
for the prediction of aggressive cases of leukemia and may therefore be taken into consideration in risk stratifi-cation. However, we suggest that this observation is a
relative expression [au]
HOXA3 HOX A4
HO XA5
HOX A6
HOX A7
HOXA9 HOXA10 HO XB2
HOX B4
HOX B5
HOXB6 HOX B7 -4
-2 0 2 4
relative expression [au]
HOXA3 HOX A4
HO XA5
HOX A6
HOX A7
HOXA9 HOXA10 HO XB2
HOX B4
HOX B5
HO XB6
HOX B7 -4
-2 0 2 4
ID = G2
Figure 4HOXgene expression patterns in corresponding differentiation stages of normal and malignat hematopoiesis.Comparison of
consequence of the allocation of patients with different molecular aberrations to particular AML risk groups (i.e.,PML-RARa+ patients with the lowestHOXAgene ex-pression levels being assigned to the SR group and MLL+ cases with the highest expression levels ofHOXA genes being allocated to the HR group) and not an in-dependent prognostic factor.
Considering the profound contribution of chromatin
modifiers to the embryonic regulation of HOX genes
and the essential roles of HOX genes in hematopoiesis, the dysregulation of chromatin modifiers may deregulate the entire process of hematopoiesis and subsequently lead to malignant transformation. However, the exact roles of epigenetic modifications in the regulation of leukemicHOX gene expression remain to be elucidated.
It has recently been shown that HOX genes possess
unique chromatin regions called bivalent domains. These
domains are characterized by the presence of both repres-sive (methylated H3K27) and activating (methylated H3K4) histone methylation marks and are found in genes poised to be activated according to cell-specific require-ments [45]. To determine the role of chromatin modifiers
in the regulation of HOX genes in normal
hemato-poiesis and leukemogenesis, we analyzed the expression patterns of DNA methyltransferases, histone H3K27/
H3K4 demethylases, and selected PcG and TrxGgenes
in subpopulations of healthy BM cells and BM samples of patients with AML. We found an inverse
correla-tion of histone demethylase (Modifiers 2) and DNMT
(Modifiers 3) gene expression in normal and malignant hematopoiesis. In contrast to healthy hematopoiesis, we found an interesting correlation between chromatin modifier gene expression and that of the HOXgenes in the AML samples. The most pronounced correlation
AML patients –morphological subgroups
Healthy BM –stages of myeloid differentiation
A
B
Figure 5Expression patterns of chromatin modifiers andHOXgenes in subpopulations of healthy BM and AML cells. A. Subpopulations
was observed with the AML M3 subtype. The specific relationship of theHOXgenes with the epigenetic mod-ifiers in this morphological subgroup could be affected by the presence of thePML-RARa fusion gene. In par-ticular, HOX gene expression was positively associated with the histone H3K27 demethylases, JMJD3 and UTX, and inversely correlated with DNMT3b. Notably, both JMJD3 and UTX have recently been suggested to play roles in hematopoiesis [24,46]. Moreover,UTX has been shown to directly bind to theHOXB1locus [21,24]. Taken together, the results implicate chromatin modifiers in the establishment of the aberrant leukemic expression of HOXgenes in pediatric AML patients.
Although the expression ofBMI1was not altered during hematopoiesis, a Spearman correlation analysis showed that this gene was positively correlated withHOX gene expression in the leukemic samples. It has been re-ported that BMI1 determines the proliferating abilities of the cells by inhibiting thep16gene.HOXA9was also shown to targetp16and impair the senescence of cells [47]. Thus, the expression levels of the histone methyl-transferase BMI1 are likely to reflect the proliferation statuses of leukemic cells without directly impacting HOXgene expression [48].
Interestingly, the PML-RARa and RUNX1-RUNX1T1
fusion oncogenes have been shown to cooperate with re-pressive complexes, leading to alterations in chromatin architecture.PML-RARacauses profound changes in the epigenetic landscape, mainly by recruiting
chromatin-modifying enzymes to target sequences or by the de-regulation of their functions [49,50]. Furthermore, recent studies have shown that the degradation of the PML-RARa oncoprotein results in dramatic changes to the landscape of histone modifications [51]. Similarly, RUNX1-RUNX1T1has also been shown to recruit epigenetic mo-difiers to target sequences [52]. These findings together with our data suggest that AML-specific oncoproteins regulateHOXgene expression through epigenetic modi-fications. However, further studies are needed to under-stand the roles of epigenetic modifiers in the regulation of normal as well as leukemicHOXgene expression and their cooperation with AML fusion oncoproteins.
In summary, we found that the expression patterns of theHOXgenes in leukemic cells are not solely determined by their particular differentiation stages. Conversely, we assume that the specific molecular aberrations that are typical of AML are the major determinants of the leuke-mic expression patterns of the HOX genes. Our results also demonstrate the differing contributions of epigenetic modifiers to HOXgene expression in healthy and malig-nant hematopoiesis.
Additional files
Additional file 1: Table S1.Patients’characteristics.
Additional file 2: Figure S1.mRNA expression of particularHOXAand
HOXBgenes in subpopulations of healthy BM.
Figure 6Relationship of expression patterns of chromatin modifiers andHOXgenes in subpopulations of healthy BM and AML cells.
Additional file 3: Figure S2.Correlation ofHOXA,HOXBand chromatin modifier gene expression in subpopulations of healthy BM.
Additional file 4: Figure S3.mRNA expression of particularHOXAand
HOXBgenes in morphological subgroups of AML patients.
Additional file 5: Figure S4.mRNA expression of particularHOXAand
HOXBgenes in subgroups of AML patients defined according to molecular genetics.
Additional file 6: Figure S5.Unsupervised HCA of AML patients based
on the epxression pattern ofHOXgenes.
Additional file 7: Figure S6.Comparison of individualHOXgene
expression of SR and HR groups.
Additional file 8: Figure S7.Comparison ofHOXgene expression
pattern between AML M5 patients and sorted subpopulation of healthy BM (A. AML M5a vs. ID = M3; B. AML M5b vs. ID = M4).
Additional file 9: Figure S8.Correlation ofHOXand chromatin
modifier gene expression in AML patients.
Competing interests
The authors declare that they have no competing interests.
Authors’contributions
KSK performed majority of the sample processing and analyses and wrote the manuscript. KR was responsible for the qPCR analyses, and KF performed the statistical analyses. EM defined the crucial characteristics of the sorted subpopulations of the healthy BM cells and designed all of the FACS sorting experiments. MZ was responsible for the molecular characterization of the AML patients. HD and JT revised the manuscript and provided critical intellectual feedback. JaS was responsible for the clinical management of the patients. As a senior author, JuS coordinated all of the experiments, revised the manuscript and is the principal investigator of the whole study. CMZ, MvdHE and MF contributed by providing datasets and performing the gene expression profiling analyses of the replication sets. All authors read and approved the final manuscript.
Acknowledgments
The authors would like to thank the staff of the Czech Pediatric Hematology Working Group (CPH) centers for their cooperation. We are also grateful to our technicians (especially Pavel Semerak) for their kind help with the sample processing. This work was supported by Grant Agency of Czech Republic P304/12/2214. KR was supported by Grant Agency of Charles University GAUK 568213. JaS was supported by the Project of Ministry of Health, Czech Republic for the conceptual development of research organizations 00064203 (University Hospital Motol, Prague, Czech Republic). We acknowledge the contribution of samples from AB and DR and the support of the DCOG (VdH) as shown in previous studies [34].
Author details
1
CLIP–Childhood Leukaemia Investigation Prague, Department of Paediatric Hematology and Oncology, 2nd Faculty of Medicine, Charles University Prague, Prague, Czech Republic.2CLIP–Childhood Leukaemia Investigation Prague, Department of Paediatric Hematology and Oncology, 2nd Faculty of Medicine, University Hospital Motol, Prague, Czech Republic.3Department of Paediatric Hematology and Oncology, 2nd Faculty of Medicine, Charles University Prague and University Hospital Motol, Prague, Czech Republic. 4Department of Pediatric Oncology and Hematology, ErasmusMC-Sophia Childrens Hospital, Rotterdam, The Netherlands.5Department of Hematology and Oncology, Medical University of South Carolina, Charleston, SC, USA. 6
Department of Biochemistry, ErasmusMC, Rotterdam, The Netherlands.
Received: 18 September 2014 Accepted: 4 December 2014
References
1. Duboule D, Dollé P:The structural and functional organization of the murine HOX gene family resembles that of Drosophila homeotic genes.
EMBO J1989,8:1497–1505.
2. Scott MP, Tamkun JWHG 3rd:The structure and function of the homeodomain.Biochim Biophys Acta1989,989:25–48.
3. Mallo M, Wellik DM, Deschamps J:Hox genes and regional patterning of the vertebrate body plan.Dev Biol2010,344:7–15.
4. Vitiello D, Kodaman PH, Taylor HS:HOX genes in implantation.Semin
Reprod Med2007,25:431–436.
5. Wellik DM:Hox patterning of the vertebrate axial skeleton.Dev Dyn2007,
236:2454–2463.
6. Neville SE, Baigent SM, Bicknell AB, Lowry PJ, Gladwell RT:Hox gene expression in adult tissues with particular reference to the adrenal gland.Endocr Res2002,28:669–673.
7. Takahashi Y, Hamada J, Murakawa K, Takada M, Tada M, Nogami I, Hayashi N, Nakamori S, Monden M, Miyamoto M, Katoh H, Moriuchi T:Expression profiles of 39 HOX genes in normal human adult organs and anaplastic thyroid cancer cell lines by quantitative real-time RT-PCR system.Exp Cell Res2004,293:144–153.
8. Abramovich C, Humphries RK:Hox regulation of normal and leukemic hematopoietic stem cells.Curr Opin Hematol2005,12:210–216. 9. Sauvageau G, Lansdorp PM, Eaves CJ, Hogge DE, Dragowska WH, Reid DS,
Largman C, Lawrence HJ, Humphries RK:Differential expression of homeobox genes in functionally distinct CD34+ subpopulations of human bone marrow cells.Proc Natl Acad Sci U S A1994,91:12223–12227. 10. Borrow J, Shearman AM, Stanton VP, Becher R, Collins T, Williams AJ, Dubé I, Katz F, Kwong YL, Morris C, Ohyashiki K, Toyama K, Rowley J, Housman DE:
The t(7;11)(p15;p15) translocation in acute myeloid leukaemia fuses the genes for nucleoporin NUP98 and class I homeoprotein HOXA9.
Nat Genet1996,12:159–167.
11. Diakos C, Xiao Y, Zheng S, Kager L, Dworzak M, Wiemels JL:Direct and Indirect Targets of the E2A-PBX1 Leukemia-Specific Fusion Protein.
PLoS One2014,9:e87602.
12. Raza-Egilmez SZ, Jani-Sait SN, Grossi M, Higgins MJ, Shows TB, Aplan PD:
NUP98-HOXD13 gene fusion in therapy-related acute myelogenous leukemia.Cancer Res1998,58:4269–4273.
13. Quentmeier H, Dirks WG, Macleod RAF, Reinhardt J, Zaborski M, Drexler HG:
Expression of HOX genes in acute leukemia cell lines with and without MLL translocations.Leuk Lymphoma2004,45:567–574.
14. Drabkin H, Parsy C, Ferguson K, Guilhot F, Lacotte L, Roy L, Zeng C, Baron A, Hunger S, Varella-Garcia M, Gemmill R, Brizard F, Brizard A, Roche J:
Quantitative HOX expression in chromosomally defined subsets of acute myelogenous leukemia.Leuk Off J Leuk Soc Am Leuk Res Fund, UK2002,
16:186.
15. Starkova J, Zamostna B, Mejstrikova E, Krejci R, Drabkin HA, Trka J:HOX gene expression in phenotypic and genotypic subgroups and low HOXA gene expression as an adverse prognostic factor in pediatric ALL.
Pediatr Blood Cancer2010,55:1072–1082.
16. Andreeff M, Ruvolo V, Gadgil S, Zeng C, Coombes K, Chen W, Kornblau S, Barón AE, Drabkin HA:HOX expression patterns identify a common signature for favorable AML.Leukemia2008,22:2041–2047. 17. Beuchle D, Struhl G, Müller J:Polycomb group proteins and heritable
silencing of Drosophila Hox genes.Development2001,128:993–1004. 18. Raaphorst F, Otte A, Meijer C:Polycomb-group genes as regulators of
mammalian lymphopoiesis.TRENDS Immunol2001,22:682–690. 19. Ono R, Nosaka T, Hayashi Y:Roles of a trithorax group gene, MLL, in
hematopoiesis.Int J Hematol2005,81:288–293.
20. Jin L, Hanigan CL, Wu Y, Wang W, Park BH, Woster PM, Casero RA:Loss of LSD1 (lysine-specific demethylase 1) suppresses growth and alters gene expression of human colon cancer cells in a p53- and DNMT1(DNA methyltransferase 1)-independent manner.Biochem J2013,449:459–468. 21. Agger K, Cloos PAC, Christensen J, Pasini D, Rose S, Rappsilber J, Issaeva I,
Canaani E, Salcini AE, Helin K:UTX and JMJD3 are histone H3K27 demethylases involved in HOX gene regulation and development.
Nature2007,449:731–734.
22. Tsumagari K, Baribault C, Terragni J, Chandra S, Renshaw C, Sun Z, Song L, Crawford GE, Pradhan S, Lacey M, Ehrlich M:DNA methylation and differentiation: HOX genes in muscle cells.Epigenetics Chromatin2013,6:25. 23. Das ND, Jung KH, Choi MR, Yoon HS, Kim SH, Chai YG:Gene networking
and inflammatory pathway analysis in a JMJD3 knockdown human monocytic cell line.Cell Biochem Funct2012,30:224–232.
24. Liu J, Mercher T, Scholl C, Brumme K, Gilliland DG, Zhu N:A functional role for the histone demethylase UTX in normal and malignant
hematopoietic cells.Exp Hematol2012,40:487–498. e3.
26. Falini B, Mecucci C, Tiacci E, Alcalay M, Rosati R, Pasqualucci L, La Starza R, Diverio D, Colombo E, Santucci A, Bigerna B, Pacini R, Pucciarini A, Liso A, Vignetti M, Fazi P, Meani N, Pettirossi V, Saglio G, Mandelli F, Lo-Coco F, Pelicci P-G, Martelli MF:Cytoplasmic nucleophosmin in acute myelogenous leukemia with a normal karyotype.N Engl J Med2005,352:254–266. 27. Hollink IHIM, van den Heuvel-Eibrink MM, Arentsen-Peters STCJM,
Zimmermann M, Peeters JK, Valk PJM, Balgobind BV, Sonneveld E, Kaspers GJL, de Bont ESJM, Trka J, Baruchel A, Creutzig U, Pieters R, Reinhardt D, Zwaan CM:Characterization of CEBPA mutations and promoter hypermethylation in pediatric acute myeloid leukemia.Haematologica 2011,96:384–392.
28. Pollard JA, Alonzo TA, Gerbing RB, Ho PA, Zeng R, Ravindranath Y, Dahl G, Lacayo NJ, Becton D, Chang M, Weinstein HJ, Hirsch B, Raimondi SC, Heerema NA, Woods WG, Lange BJ, Hurwitz C, Arceci RJ, Radich JP, Bernstein ID, Heinrich MC, Meshinchi S:Prevalence and prognostic significance of KIT mutations in pediatric patients with core binding factor AML enrolled on serial pediatric cooperative trials for de novo
AML.Blood2010,115:2372–2379.
29. Sano H, Shimada A, Taki T, Murata C, Park M-J, Sotomatsu M, Tabuchi K, Tawa A, Kobayashi R, Horibe K, Tsuchida M, Hanada R, Tsukimoto I, Hayashi Y:RAS mutations are frequent in FAB type M4 and M5 of acute myeloid leukemia, and related to late relapse: a study of the Japanese Childhood AML Cooperative Study Group.Int J Hematol2012,95:509–515. 30. Van Lochem EG, van der Velden VHJ, Wind HK, te Marvelde JG, Westerdaal
NAC, van Dongen JJM:Immunophenotypic differentiation patterns of normal hematopoiesis in human bone marrow: reference patterns for age-related changes and disease-induced shifts.Cytometry B Clin Cytom 2004,60:1–13.
31. Kussick SJ, Fromm JR, Rossini A, Li Y, Chang A, Norwood TH, Wood BL:
Four-color flow cytometry shows strong concordance with bone marrow morphology and cytogenetics in the evaluation for myelodysplasia.
Am J Clin Pathol2005,124:170–181.
32. Kussick SJ, Wood BL:Using 4-color flow cytometry to identify abnormal myeloid populations.Arch Pathol Lab Med2003,127:1140–1147. 33. Roche J, Zeng C, Barón A, Gadgil S, Gemmill RM, Tigaud I, Thomas X,
Drabkin H a:Hox expression in AML identifies a distinct subset of patients with intermediate cytogenetics.Leuk Off J Leuk Soc Am Leuk Res
Fund, UK2004,18:1059–1063.
34. Hollink IHIM, van den Heuvel-Eibrink MM, Arentsen-Peters STCJM, Pratcorona M, Abbas S, Kuipers JE, van Galen JF, Beverloo HB, Sonneveld E, Kaspers G-JJL, Trka J, Baruchel A, Zimmermann M, Creutzig U, Reinhardt D, Pieters R, Valk PJM, Zwaan CM:NUP98/NSD1 characterizes a novel poor prognostic group in acute myeloid leukemia with a distinct HOX gene expression pattern.Blood2011,118:3645–3656.
35. Montavon T, Soshnikova N:Hox gene regulation and timing in embryogenesis.Semin Cell Dev Biol2014,34C:76–84.
36. Boyer L a, Plath K, Zeitlinger J, Brambrink T, Medeiros L a, Lee TI, Levine SS, Wernig M, Tajonar A, Ray MK, Bell GW, Otte AP, Vidal M, Gifford DK, Young R a, Jaenisch R:Polycomb complexes repress developmental regulators in murine embryonic stem cells.Nature2006,441:349–353.
37. Alharbi RA, Pettengell R, Pandha HS, Morgan R:The role of HOX genes in normal hematopoiesis and acute leukemia.Leukemia2013,27:1000–1008. 38. Cantile M, Schiavo G, Terracciano L, Cillo C:Homeobox genes in normal
and abnormal vasculogenesis.Nutr Metab Cardiovasc Dis2008,
18:651–658.
39. DU H, Taylor HS:Molecular regulation of mullerian development by Hox genes.Ann N Y Acad Sci2004,1034:152–165.
40. Beslu N, Krosl J, Laurin M, Mayotte N, Humphries KR, Sauvageau G:
Molecular interactions involved in HOXB4-induced activation of HSC self-renewal.Blood2004,104:2307–2314.
41. Lawrence HJ, Helgason CD, Sauvageau G, Fong S, Izon DJ, Humphries RK, Largman C:Mice bearing a targeted interruption of the homeobox gene HOXA9 have defects in myeloid, erythroid, and lymphoid hematopoiesis.
Blood1997,89:1922–1930.
42. Izon DJ, Rozenfeld S, Fong ST, Kömüves L, Largman C, Lawrence HJ:
Loss of function of the homeobox gene Hoxa-9 perturbs early T-cell development and induces apoptosis in primitive thymocytes.Blood 1998,92:383–393.
43. Kappen C:Disruption of the homeobox gene Hoxb-6 in mice results in increased numbers of early erythrocyte progenitors.Am J Hematol2000,
65:111–118.
44. Hess JL:MLL: a histone methyltransferase disrupted in leukemia.Trends
Mol Med2004,10:500–507.
45. Bernstein BE, Mikkelsen TS, Xie X, Kamal M, Huebert DJ, Cuff J, Fry B, Meissner A, Wernig M, Plath K, Jaenisch R, Wagschal A, Feil R, Schreiber SL, Lander ES:A bivalent chromatin structure marks key developmental genes in embryonic stem cells.Cell2006,125:315–326.
46. Ntziachristos P, Tsirigos A, Welstead GG, Trimarchi T, Bakogianni S, Xu L, Loizou E, Holmfeldt L, Strikoudis A, King B, Mullanders J, Becksfort J, Nedjic J, Paietta E, Tallman MS, Rowe JM, Tonon G, Satoh T, Kruidenier L, Prinjha R, Akira S, Van Vlierberghe P, Ferrando A a, Jaenisch R, Mullighan CG, Aifantis I:
Contrasting roles of histone 3 lysine 27 demethylases in acute lymphoblastic leukaemia.Nature2014,514:513-517.
47. Martin N, Popov N, Aguilo F, O’Loghlen A, Raguz S, Snijders AP, Dharmalingam G, Li S, Thymiakou E, Carroll T, Zeisig BB, So CWE, Peters G, Episkopou V, Walsh MJ, Gil J:Interplay between Homeobox proteins and Polycomb repressive complexes in p16INK4a regulation.EMBO J2013,
32:982–995.
48. Lessard J, Sauvageau G:Bmi-1 determines the proliferative capacity of normal and leukaemic stem cells.Nature2003,423:255–260. 49. Di Croce L, Raker VA, Corsaro M, Fazi F, Fanelli M, Faretta M, Fuks F,
Lo Coco F, Kouzarides T, Nervi C, Minucci S, Pelicci PG:Methyltransferase recruitment and DNA hypermethylation of target promoters by an oncogenic transcription factor.Science2002,295:1079–1082.
50. Grignani F, De Matteis S, Nervi C, Tomassoni L, Gelmetti V, Cioce M, Fanelli M, Ruthardt M, Ferrara FF, Zamir I, Seiser C, Lazar MA, Minucci S, Pelicci PG:
Fusion proteins of the retinoic acid receptor-alpha recruit histone deacetylase in promyelocytic leukaemia.Nature1998,391:815–818. 51. Martens JHA, Brinkman AB, Simmer F, Francoijs K-J, Nebbioso A, Ferrara F,
Altucci L, Stunnenberg HG:PML-RARalpha/RXR Alters the Epigenetic Landscape in Acute Promyelocytic Leukemia.Cancer Cell2010,
17:173–185.
52. Fu L, Huang W, Jing Y, Jiang M, Zhao Y, Shi J, Huang S, Xue X, Zhang Q, Tang J, Dou L, Wang L, Nervi C, Li Y, Yu L:AML1-ETO triggers epigenetic activation of early growth response gene l, inducing apoptosis in t(8;21) acute myeloid leukemia.FEBS J2014,281:1123-1131
Submit your next manuscript to BioMed Central and take full advantage of:
• Convenient online submission
• Thorough peer review
• No space constraints or color figure charges
• Immediate publication on acceptance
• Inclusion in PubMed, CAS, Scopus and Google Scholar
• Research which is freely available for redistribution