R E S E A R C H
Open Access
Recurrence patterns and lifetime
performance of parity 1 sows in breeding
herds with different
weaning-to-first-mating intervals
Yu Yatabe
1, Ryosuke Iida
1, Carlos Piñeiro
2and Yuzo Koketsu
1*Abstract
Background:Our objectives were 1) to compare reproductive performance across parities and lifetime performance of parity 1 sows in six weaning-to-first-mating interval groups (WMI 0–3, 4, 5, 6, 7–20 and 21 days or more), 2) to determine the recurrence patterns and repeatability of WMI, and 3) to quantify factors associated with the probability of parity 1 sows having WMI 4 days. Examined data comprised 691,276 parity and 144,052 lifetime records of sows in 155 Spanish herds, served between 2011 and 2016. Mixed-effects models were applied to the data. Variance components analysis determined WMI repeatability.
Results:Proportions of parity 1 sows with WMI 0–3, 4, 5, 6, 7–20 and 21 days or more were 4.1, 30.0, 38.4, 7.9, 12.7 and 6.9%, respectively. Of the parity 1 sows with WMI 0–4 days, 43.3–60.5% had WMI 4 days in later parities, whereas 33.9– 48.9% of those with WMI≥5 days had WMI 5 days; WMI repeatability was 0.11. Parity 1 sows with WMI 4 or 5 days had 0.3–2.1 days shorter WMI in later parities than those with WMI≥7 days (P< 0.05). Parity 1 sows with WMI 4 or 5 days also had 0.6–2.1 more annualized lifetime piglets born alive than those with WMI≥7 days (P< 0.05). Notably, parity 1 sows with WMI 4 days had 0.3 more annualized lifetime piglets born alive than those with WMI 5 days (P< 0.05). Conclusion:The WMI in parity 1 could be a useful predictor for subsequent reproductive performance and lifetime performance of sows.
Keywords:Cohort study, Farm management, Lifetime performance, Primiparous sows, Swine, Weaning-to-first-service interval
Background
Weaning-to-first-mating interval (WMI) is one of the key performance indicators for sow productivity in breeding herds, and is a major part of non-productive days of sows [1]. Approximately 90% of sows have WMI of 0–6 days [2], but WMI of the other 10% of sows can vary widely. A study in Thailand has shown that parity 1 crossbred sows with WMI 0–5 days had greater longev-ity and more lifetime piglets born alive than those with WMI 6 days or more [3]. Another study has shown that sows with WMI 4–6 days had higher farrowing rates
than those with WMI 7–20 days [4]. Also, it is reported that purebred Hampshire sows with WMI 4 days had higher farrowing rates than those with WMI 5 or 6 days [5]. However, no single study has compared the differ-ence in sow reproductive performance between parity 1 sows in six WMI groups, namely WMI 0–3, 4, 5, 6, 7– 20 and 21 days or more.
A study in Japan reported that more than 85% of sows with WMI 4–6 days in parity 1 also had WMI 4–6 days in parity 2 [4]. However, there have not been any studies in breeding herds about recurrence patterns of WMI in later parities nor the repeatability of WMI. Furthermore, even though prolonged WMI is known to be associated with shorter lactation length [6] and higher numbers of piglets weaned [7], there have not been any reports
© The Author(s). 2019Open AccessThis article is distributed under the terms of the Creative Commons Attribution 4.0 International License (http://creativecommons.org/licenses/by/4.0/), which permits unrestricted use, distribution, and reproduction in any medium, provided you give appropriate credit to the original author(s) and the source, provide a link to the Creative Commons license, and indicate if changes were made. The Creative Commons Public Domain Dedication waiver (http://creativecommons.org/publicdomain/zero/1.0/) applies to the data made available in this article, unless otherwise stated.
* Correspondence:[email protected]
1School of Agriculture, Meiji University, Higashi-mita 1-1-1, Tama-ku,
Kawasaki, Kanagawa 214-8571, Japan
about the effects of lactation length or the number of piglets weaned on the probability of parity 1 sows having a certain WMI.
Therefore, the objectives of the current study were 1) to compare subsequent reproductive performance across parities and lifetime performance in six WMI groups of parity 1 sows, 2) to assess the recurrence patterns and re-peatability of WMI and 3) to quantify factors associated with the probability of parity 1 sows having WMI 4 days.
Methods Studied herds
A veterinary consultancy firm (PigCHAMP pro Europa S.L., Segovia, Spain) requested all client producers to mail their data files on a regular basis to build up a sow database. In July 2017, by-parity reproductive perform-ance and lifetime performperform-ance records of sows in 155 Spanish herds, which allowed their data to be used for research, were extracted from the database.
Overall mean herd size in Spain in December 2013 was 131 sows, estimated by dividing the 2,568,450 recorded sows by the 19,630 breeding herds [8]. In the present study, mean herd size (± SEM) in our studied herds dur-ing 2016 was 913 ± 60.1 sows with a range between 87 and 5640 sows. Also, the herd mean of the number of pig-lets weaned per sow per year (± SEM) in these studied herds was 26.3 ± 0.19 piglets with a range between 19.6 and 33.3 piglets. The lactation and gestation diets of sows in the studied herds were formulated using cereals (barley, wheat and corn) and soybean meal. In the studied herds, sows were mainly crossbreds between Landrace and Large White, and replacement gilts were either purchased from international breeding companies or home-produced through internal multiplication programs.
Study design, data and exclusion criteria
The present study was designed as a retrospective cohort study utilizing by-parity service records and subsequent reproductive records, from first-service in parity 1 to re-moval, for 150,565 sows entered between 2011 and 2013, and removed between 2011 and 2017. The data comprised 728,928 parity records of sows serviced from January 2011 to December 2016. When the data were collected, 2762 (1.8%) sows had no record of parity at removal, so these sow records were excluded.
Sow records were also excluded if lifetime non-productive days were 294 days or more (1530 sows; 99th percentile; [9]). Further records of sows were excluded if the parity records of a sow met any of the following criteria in their lifetime: total number of piglets born was either 0 or 31 piglets or more (681 sows; [10]) and WMI was 61 days or more (1540 sows; [11]). Hence, the final dataset comprised 691,276 parity records and 144,052 lifetime re-cords for sows that had at least one WMI. Also, when
analyzing the probability of parity 1 sows having WMI 4 days, additional exclusions were made for records with 0 piglets weaned (973 records), lactation length of 0–9 days or 42 days or more (1608 records) and age at first-mating (17,454 records; [12]).
Categories and definitions
Sows were categorized into six WMI groups based on WMI in parity 1: WMI 0–3, 4, 5, 6, 7–20 and 21 days or more. The categorization was based on previous reports; 0–3 days [13], 4, 5, 6 days [5], 7–20 days [4], and 21 days or more [14]. In addition, we have hypothesized that there are differences in subsequent reproductive performance and lifetime performance between parity 1 sows with WMI 4, 5 and 6 days, because it is reported that LH pat-terns differ between sows with WMI 3–4 days and 5 days or more [15]. Means (± SEM) of WMI 0–3, 7–20 and 21 days or more groups were 2.1 ± 0.02, 11.2 ± 0.03 and 31.1 ± 0.09 days, respectively. Also, there were five parity groups: parity 1, 2, 3, 4 and 5 or higher.
Lifetime piglets born alive was the sum of the number of piglets born alive in a sow’s lifetime. Annualized lifetime piglets born alive was calculated as the lifetime piglets born alive divided by the sum of reproductive herd life days × 365. The reproductive herd life days was defined as the number of days from the date that a gilt was first-served to its removal date. Lifetime non-productive days was defined as the number of days when a sow was neither gestating nor lactating during its reproductive herd life.
Statistical analysis
All analyses were conducted using SAS University Edi-tion (SAS Inst. Inc., Cary, NC). A chi-square test was used to compare proportions (%) of WMI groups be-tween parity 1 sows and sows in parity 2 or higher.
seasons were January–March, April–June, July–Septem-ber and OctoJuly–Septem-ber–DecemJuly–Septem-ber.
Model 2 was applied to compare the WMI groups for lifetime performance, and Model 3 quantified factors asso-ciated with the probability of parity 1 sows having WMI 4 days, respectively. A 2-level liner mixed-effects model was applied to Model 2 using the MIXED procedure to ac-count for the clustering of sows within a herd (random statement). The following factors were included as fixed effects in Model 2 for lifetime performance: the WMI groups, quarterly herd entry seasons and entry year. In Models 1 and 2, pairwise multiple comparisons were per-formed using the Tukey-Kramer test. In addition, a 2-level mixed-effects logistic regression model was applied to Model 3 using the GLIMMIX procedure to account for the clustering of sows within a herd (GLIMMIX, random statement). Also, age at first-mating was included as a co-variate in Models 1 and 2.
Model 3 included lactation length, piglets weaned, age at first-mating, quarterly farrowing seasons and entry year as fixed effects. Also, included were the quadratic expressions of lactation length, piglets weaned and age at first-mating, and the two-way interactions between lactation length and piglets weaned. Lactation length, piglets weaned and age at first-mating were centered at the grand mean value. For all analyses, the significance level was set at 0.05.
Repeatability of WMI and intraclass correlation coefficients
Variance components analysis was conducted using the VARCOMP procedure. Because the SAS software could not handle more than 5000 sows for the analysis, 5000 sows were randomly selected from the dataset with the SURVEYSELECT procedure. Repeatability for WMI was determined by the following equation [16]:
Repeatability ¼ σ2 vþσ2u
= σ2
vþσ2uþσ2ε
;
in which σ2
v is the between-herd variance, σ2u is the between-sow variance and σ2
ε is the variance at the indi-vidual record level. The model for WMI included parity groups, quarterly farrowing month groups and entry year as fixed effects, and also herds and sows nested within a herd as random effects.
The intraclass correlation coefficients (ICC) were cal-culated by the following equation [17] to assess the vari-ation in the amount of the probability of parity 1 sows having WMI 4 days that could be explained by the herd:
ICC individualrecordswithinthesameherdð Þ ¼ σ2
v= σ2vþπ2=3
;
in whichσ2v is the between-herd variance andπ2/3 is the assumed variance at the individual record level.
Results
Mean WMI (± SEM) was 5.9 ± 0.01 days (Table 1). The
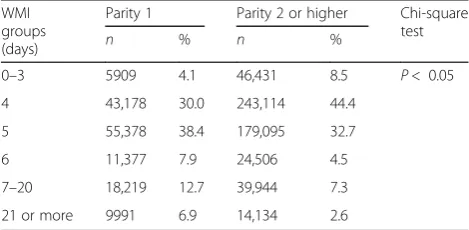
proportions of parity 1 sows with WMI 0–3, 4, 5, 6, 7– 20 and 21 days or more were 4.1, 30.0, 38.4, 7.9, 12.7
and 6.9%, respectively (Table2). There was a difference
in the proportions in WMI between parity 1 sows and
sows in parity 2 or higher (P< 0.05). Parity 1 sows had
higher proportions of WMI 5 days or more than those in parity 2 or higher.
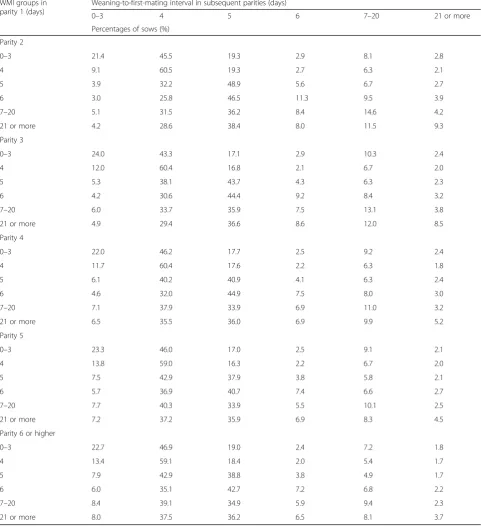
Table 3 shows the WMI recurrence patterns in each
WMI group in parity 1. For example, 60.5% of the parity 1 sows with WMI 4 days had the same WMI (4 days) in parity 2. Also, 43.3% of the parity 1 sows with WMI 0–3 days had WMI 4 days in parity 3. Overall, 43.3–60.5% of the parity 1 sows with WMI 0–4 days had WMI 4 days in later parities, whereas 33.9–48.9% of the parity 1 sows with WMI 5 days or more had WMI 5 days in later par-ities. Furthermore, looking only at parity 1 sows with WMI 0–3 days, 21.4–24.0% had WMI 0–3 days in later parities. Also, looking only at parity 1 sows with WMI 7–20 days, 9.4–14.6% had WMI 7–20 days in later
par-ities. The repeatability of WMI was 0.11 (Table4).
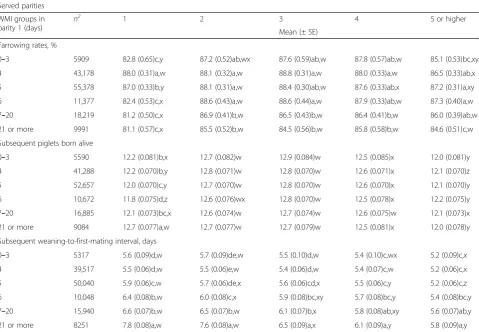
There were significant main effects of the WMI groups and parity groups, and also two-way interactions be-tween these two groups for farrowing rates, subsequent
piglets born alive and subsequent WMI (P< 0.05).
Par-ity 1 sows with WMI 4 or 5 days had 0.3–2.1 days shorter subsequent WMI in later parities than parity 1
sows with WMI 7 days or more (Table5;P< 0.05). Also,
parity 1 sows with WMI 4 days had 1.0% higher farrow-ing rates in parity 1 than sows with WMI 5 days
(P< 0.05). Furthermore, they had 0.2 more subsequent
piglets born alive in parities 1, than sows with WMI 5
days (P< 0.05). Additionally, parity 1 sows with WMI
0–3 days had 4.2–5.2% lower farrowing rates in parity 1
than those with WMI 4 or 5 days (P< 0.05).
With regard to lifetime performance (Table 6), there
were associations between WMI groups and sow lifetime
performance (P< 0.05). Parity 1 sows with WMI 4 or 5
days had 0.2–0.7 higher parities at removal, 2.2–9.0 more lifetime piglets born alive, 2.8–31.7 fewer lifetime non-productive days and 0.4–2.1 more annualized life-time piglets born alive than parity 1 sows with WMI 6
days or more (P< 0.05). Parity 1 sows with WMI 4 days
had 0.7 more lifetime piglets born alive and 0.3 more an-nualized lifetime piglets born alive than parity 1 sows with 5 days WMI; they also had 1.2 days fewer lifetime non-productive days than those with WMI 5 days
(P< 0.05). Additionally, parity 1 sows with WMI 0–3
days had 0.2 lower parities at removal and 3.8–4.3 fewer lifetime piglets born alive than parity 1 sows with WMI 4 or 5 days.
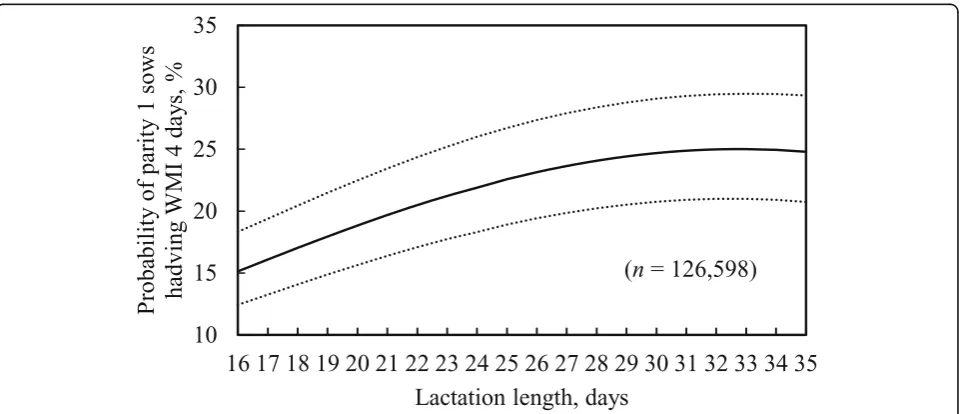
of parity 1 sows having WMI 4 days (P< 0.05), but there was no such association with the two-way interaction
(Table 7; P= 0.88). For example, as lactation length
in-creased from 18 to 31 days (5th to 95th percentiles), the probability of parity 1 sows having WMI 4 days increased
by 8.2% (Fig.1). Also, as piglets weaned decreased from 14
to 8 piglets (95th to 5th percentiles), the probability of
par-ity 1 sows having WMI 4 days increased by 2.4% (Fig. 2).
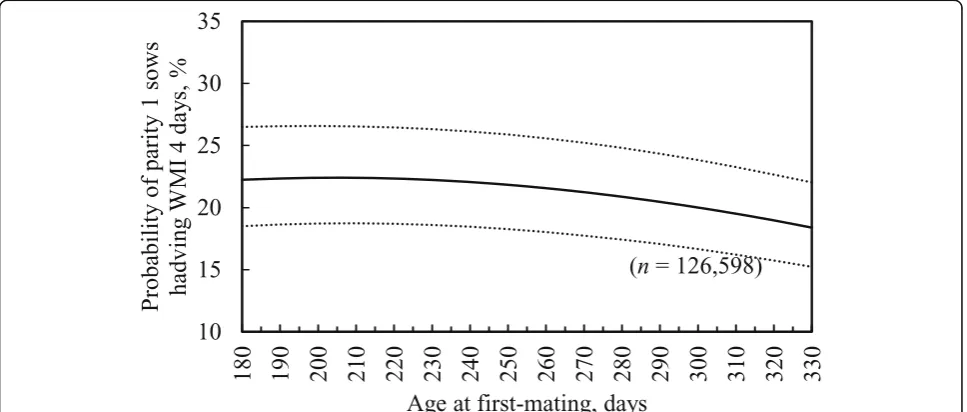
Additionally, when age at first-mating decreased from 320 to 220 days, the probability of parity 1 sows having WMI 4
days increased by 4.4% (Fig.3). However, the probability of
parity 1 sows having WMI 4 days did not vary very much between 12 and 22 piglets weaned. With regard to the
ICC, the random herd effect explained 34% of total vari-ance values for the probability of parity 1 sows having WMI 4 days.
Discussion
Our study indicated that parity 1 sows with WMI 4 or 5 days had higher lifetime productivity and greater longev-ity than parlongev-ity 1 sows with WMI 6 days or more because the sows with WMI 4 or 5 days had shorter WMI and higher farrowing rates in later parities than the parity 1 sow groups with longer WMI. It is possible that the hypothalamic-pituitary-ovary axis of parity 1 sows with WMI 4 or 5 days has greater potential to resume estrus postweaning compared to equivalent sows with WMI 6 days or more. A shorter WMI is strongly related to higher luteinizing hormone concentrations during
lacta-tion and postweaning in sows [18, 19]. In addition, our
study showed that parity 1 sows with WMI 4 days had the greatest lifetime efficiency and longevity among the six WMI groups.
There was a distinct difference in farrowing rates in later parities between the six WMI groups of parity 1 sows. Low farrowing rates or high farrowing failure are suggested to occur due to decreased GnRH secretion, decreased luteinizing hormone release and impaired cor-pora lutea functions [20]. It might be possible that there were differences in the potential of the hypothalamic-pituitary-ovary axis between the six WMI groups of Table 1Reproductive performance of sows in 155 herds
Measurements n Mean SEM Median (IQR)
Lifetime records
Age at first-mating 126,598 254.4 0.11 249 (235–273)
Number of parity at removal 144,052 5.5 0.01 6 (4–7)
Reproductive herd life days 144,052 834.1 0.86 882 (573–1098)
Lifetime piglets born alive 144,052 68.0 0.09 71 (42–93)
Lifetime non-productive days 144,052 74.1 0.14 57 (34–101)
Annualized lifetime piglets born alive 144,052 28.7 0.02 29 (25–33)
Annualized lifetime piglets weaned 144,052 25.4 0.01 26 (23–28)
Parity records
Served parity 691,276 3.4 0.01 3 (2–5)
Weaning-to-first-mating interval, days 691,276 5.9 0.01 5 (4–5)
Farrowing rate, % 691,276 87.5 0.04 –
Number of subsequent piglets born alive 647,814 12.5 0.01 13 (11–15)
Parity 1 records
Lactation length, daysa 141,471 23.8 0.01 23 (21–26)
Number of piglets weaneda 141,471 11.0 0.01 11 (10–12)
Weaning-to-first-mating interval, days 144,052 7.3 0.01 5 (4–6)
SEMstandard error of the mean,IQRinterquartile range
a
The remaining records (144,052 -n) were regarded as missing records
Table 2Relative frequency distributions (%) of weaning-to-first-mating interval (WMI) in parity 1 sows (144,052 records) and parity 2 or higher sows (547,224 records) categorized in six WMI groupsa
WMI groups (days)
Parity 1 Parity 2 or higher Chi-square
test
n % n %
0–3 5909 4.1 46,431 8.5 P< 0.05
4 43,178 30.0 243,114 44.4
5 55,378 38.4 179,095 32.7
6 11,377 7.9 24,506 4.5
7–20 18,219 12.7 39,944 7.3
21 or more 9991 6.9 14,134 2.6
a
parity 1 sows, and that WMI in parity 1 is associated with farrowing rates in later parities.
Our study showed that there was a difference between the six WMI groups in piglets born alive per litter in
parities 2 and 3 (0.1–0.2 piglets), and that there were no
Table 3Cross-classified relative frequency distributions (%) of six weaning-to-first-mating interval (WMI) groups in parity 1 and subsequent paritiesa
WMI groups in parity 1 (days)
Weaning-to-first-mating interval in subsequent parities (days)
0–3 4 5 6 7–20 21 or more
Percentages of sows (%)
Parity 2
0–3 21.4 45.5 19.3 2.9 8.1 2.8
4 9.1 60.5 19.3 2.7 6.3 2.1
5 3.9 32.2 48.9 5.6 6.7 2.7
6 3.0 25.8 46.5 11.3 9.5 3.9
7–20 5.1 31.5 36.2 8.4 14.6 4.2
21 or more 4.2 28.6 38.4 8.0 11.5 9.3
Parity 3
0–3 24.0 43.3 17.1 2.9 10.3 2.4
4 12.0 60.4 16.8 2.1 6.7 2.0
5 5.3 38.1 43.7 4.3 6.3 2.3
6 4.2 30.6 44.4 9.2 8.4 3.2
7–20 6.0 33.7 35.9 7.5 13.1 3.8
21 or more 4.9 29.4 36.6 8.6 12.0 8.5
Parity 4
0–3 22.0 46.2 17.7 2.5 9.2 2.4
4 11.7 60.4 17.6 2.2 6.3 1.8
5 6.1 40.2 40.9 4.1 6.3 2.4
6 4.6 32.0 44.9 7.5 8.0 3.0
7–20 7.1 37.9 33.9 6.9 11.0 3.2
21 or more 6.5 35.5 36.0 6.9 9.9 5.2
Parity 5
0–3 23.3 46.0 17.0 2.5 9.1 2.1
4 13.8 59.0 16.3 2.2 6.7 2.0
5 7.5 42.9 37.9 3.8 5.8 2.1
6 5.7 36.9 40.7 7.4 6.6 2.7
7–20 7.7 40.3 33.9 5.5 10.1 2.5
21 or more 7.2 37.2 35.9 6.9 8.3 4.5
Parity 6 or higher
0–3 22.7 46.9 19.0 2.4 7.2 1.8
4 13.4 59.1 18.4 2.0 5.4 1.7
5 7.9 42.9 38.8 3.8 4.9 1.7
6 6.0 35.1 42.7 7.2 6.8 2.2
7–20 8.4 39.1 34.9 5.9 9.4 2.3
21 or more 8.0 37.5 36.2 6.5 8.1 3.7
a
Frequency within a row totals 100%
Table 4Repeatability of weaning-to-first-mating interval (days)
Variances
Sow Herd Error Total Repeatability
such differences in parities 4 or higher. This suggests that the WMI in parity 1 is not directly associated with the number of piglets born alive in later parities. Instead, the number of piglets born alive is associated with the number of ovulation and embryo survival [21]. In addition, due to the accumulation of small differences at
each parity, and greater longevity, parity 1 sows with WMI 4 or 5 days had more lifetime piglets born alive than those with WMI 6 days or more.
We also found that for parity 1 sows with WMI 0–4 days the most frequent WMI in later parities was WMI 4 days, whereas for sows with WMI 5 days or more in Table 5Comparisons of farrowing rates, subsequent piglets born alive and subsequent weaning-to-first-mating interval (WMI) of six WMI groups in consecutive served parities1
Served parities
WMI groups in parity 1 (days)
n2 1 2 3 4 5 or higher
Mean (± SE)
Farrowing rates, %
0–3 5909 82.8 (0.65)c,y 87.2 (0.52)ab,wx 87.6 (0.59)ab,w 87.8 (0.57)ab,w 85.1 (0.53)bc,xy
4 43,178 88.0 (0.31)a,w 88.1 (0.32)a,w 88.8 (0.31)a,w 88.0 (0.33)a,w 86.5 (0.33)ab,x
5 55,378 87.0 (0.33)b,y 88.1 (0.31)a,w 88.4 (0.30)ab,w 87.6 (0.33)ab,x 87.2 (0.31)a,xy
6 11,377 82.4 (0.53)c,x 88.6 (0.43)a,w 88.6 (0.44)a,w 87.9 (0.33)ab,w 87.3 (0.40)a,w
7–20 18,219 81.2 (0.50)c,x 86.9 (0.41)b,w 86.5 (0.43)b,w 86.4 (0.41)b,w 86.0 (0.39)ab,w
21 or more 9991 81.1 (0.57)c,x 85.5 (0.52)b,w 84.5 (0.56)b,w 85.8 (0.58)b,w 84.6 (0.51)c,w
Subsequent piglets born alive
0–3 5590 12.2 (0.081)b,x 12.7 (0.082)w 12.9 (0.084)w 12.5 (0.085)x 12.0 (0.081)y
4 41,288 12.2 (0.070)b,y 12.8 (0.071)w 12.8 (0.070)w 12.6 (0.071)x 12.1 (0.070)z
5 52,657 12.0 (0.070)c,y 12.7 (0.070)w 12.8 (0.070)w 12.6 (0.070)x 12.1 (0.070)y
6 10,672 11.8 (0.075)d,z 12.6 (0.076)wx 12.8 (0.070)w 12.5 (0.078)x 12.2 (0.075)y
7–20 16,885 12.1 (0.073)bc,x 12.6 (0.074)w 12.7 (0.074)w 12.6 (0.075)w 12.1 (0.073)x
21 or more 9084 12.7 (0.077)a,w 12.7 (0.077)w 12.7 (0.079)w 12.5 (0.081)x 12.0 (0.078)y
Subsequent weaning-to-first-mating interval, days
0–3 5317 5.6 (0.09)d,w 5.7 (0.09)de,w 5.5 (0.10)d,w 5.4 (0.10)c,wx 5.2 (0.09)c,x
4 39,517 5.5 (0.06)d,w 5.5 (0.06)e,w 5.4 (0.06)d,w 5.4 (0.07)c,w 5.2 (0.06)c,x
5 50,040 5.9 (0.06)c,w 5.7 (0.06)de,x 5.6 (0.06)cd,x 5.5 (0.06)c,y 5.2 (0.06)c,z
6 10,048 6.4 (0.08)b,w 6.0 (0.08)c,x 5.9 (0.08)bc,xy 5.7 (0.08)bc,y 5.4 (0.08)bc,y
7–20 15,940 6.6 (0.07)b,w 6.5 (0.07)b,w 6.1 (0.07)b,x 5.8 (0.08)ab,xy 5.6 (0.07)ab,y
21 or more 8251 7.8 (0.08)a,w 7.6 (0.08)a,w 6.5 (0.09)a,x 6.1 (0.09)a,y 5.8 (0.09)a,y
1
Means and SE were estimated by using mixed models
2n
represents initial number of sows
a-e
Different superscripts within a column represent significant differences in means (P< 0.05)
w-z
Different superscripts within a row represent significant differences in means (P< 0.05)
Table 6Comparisons of lifetime performance of sows between six weaning-to-first-mating interval (WMI) groups1
WMI groups in parity 1 (days)
n Parity at
removal
Lifetime piglets born alive
Lifetime non-productive days
Annualized lifetime piglets born alive
Annualized lifetime piglets weaned
Mean (± SE)
0–3 5909 5.6 (0.07)b 67.0 (0.90)b 76.5 (1.72)de 28.5 (0.21)ab 24.5 (0.17)b
4 43,178 5.8 (0.06)a 71.3 (0.80)a 77.1 (1.59)e 28.7(0.19)a 25.0 (0.16)a
5 55,378 5.8 (0.06)a 70.8 (0.79)a 78.3 (1.58)d 28.4 (0.19)b 24.9 (0.16)a
6 11,377 5.6 (0.06)b 68.6 (0.84)b 81.1 (1.65)c 28.0 (0.20)c 24.7 (0.17)b
7–20 18,219 5.5 (0.06)c 67.1 (0.82)c 88.3 (1.62)b 27.8 (0.20)d 24.3 (0.17)b
21 or more 9991 5.1 (0.06)d 62.3 (0.85)d 108.8 (1.66)a 26.6 (0.20)e 22.9 (0.17)c
1
Means and SE were estimated by using mixed models
a-e
parity 1 the most frequent WMI in later parities was WMI 5 days. These WMI recurrence patterns suggest that parity 1 sows with WMI 0–4 days had a quicker re-covery after lactational anestrus than those with WMI 5 days or more. It is hypothesized that parity 1 sows with shorter WMI had gonadotropin secretion characteristics different from those with WMI 5 days or more [15].
Approximately 10% of the parity 1 sows with WMI 7– 20 days had WMI 7–20 days in later parities, suggesting that some sows have a weak mechanism for resuming es-trus postweaning. Although we do not have data in sows’ appetites or a disease, one possible reason for this is that it
is likely that some of the sows had an innately poor appe-tite, resulting in excessive loss of body weight during lacta-tion and these sows could have the prolonged WMI [3, 22]. Additionally, some parity 1 sows may have a gilt devel-opment problem or a feeding problem during gestation [1]. Also, the WMI repeatability of 0.11 in our study was higher than that found in a previous study in Japan, which showed a repeatability of only 0.08 [4]. The reason for the relatively higher repeatability in our study appears that Spanish herds have different management from Japanese herds, such as relating to hormonal treatments or strict culling policy for sows with prolonged WMI.
Table 7Estimates of fixed factors and random effect variance included in the mixed-effects logistic regression model for the probability of parity 1 sows having a weaning-to-first-mating interval (WMI) of 4 days
Fixed and random effects Probability of parity 1 sows having WMI 4 days
Estimate (± SE) P-value
Intercept - 0.992 (0.1137) < 0.01
Age at first-mating - 0.0017 (0.0003) < 0.01
Age at first-mating squared 0.0002 (0.00004) < 0.01
Lactation length 0.041 (0.0022) < 0.01
Lactation length squared - 0.0023 (0.0003) < 0.01
Piglets weaned - 0.023 (0.0039) < 0.01
Piglets weaned squared 0.0014 (0.0004) < 0.01
Piglets weaned x lactation length 0.0006 (0.0005) 0.21
Age at first-mating x lactation length 0.0004 (0.00005) < 0.01
Age at first-mating x piglets weaned −0.0001 (0.00008) 0.10
Intercept variance at herd level 1.70 (0.22) –
ICC (records within the same herd), % 34.0 –
SEstandard error,ICCintraclass correlation coefficient
In addition, the reason for parity 1 sows with WMI
0–3 days continuing to have WMI 0–3 days in
subse-quent parities could be because some sows have a ro-bust hypothalamic-pituitary-ovary axis function, and so tend to have short WMI in parity 1 and later parities. In our study, the parity 1 sows with WMI 0–3 days had a lower farrowing rate in parity 1 than the sows with WMI 4 or 5 days. It is possible that some of the parity 1 sows with WMI 0–3 days had ovarian cysts and there-fore had lower farrowing rates than those with WMI 4
or 5 days. This possibility is supported by a previous
study which reported that sows with WMI of only 0–2
days were at high risk of developing cysts which is a cause of low farrowing rates [23]. Also, our study showed that the average parity for removal of parity 1 sows with WMI 0–3 days was lower than that of parity 1 sows with WMI 4 or 5 days. This difference suggests
that producers culled more parity 1 sows with 0–3 days
than parity 1 sows with 4 or 5 days. However, our study
also indicates that the parity 1 sows with WMI 0–3 days
Fig. 2Predicted probability of parity 1 sows having weaning-to-first-mating interval (WMI) 4 days with increasing piglets weaned. Dotted lines show 95% confidence intervals
were capable of having the same lifetime efficiency as those with WMI 4 or 5 days. Therefore, producers should not hastily cull parity 1 sows with WMI 0–3 days unless they exhibit repeat-breeding or not-in-pig or nymphomania, which are characteristics of ovarian cysts [23–25].
The higher proportions of sows with WMI 5 days or more in parity 1 than sows in parity 2 or higher is con-sistent with previous studies reporting prolonged WMI
in parity 1 sows [26, 27]. This can be explained by the
fact that parity 1 sows are still growing and so tend to have immature endocrine systems and low lactation feed consumption [28], which decreases their gonado-tropin secretion and slows down ovarian follicle growth in the sows [29].
Our study also found that the probability of parity 1 sows having WMI 4 days was independently associated with increased lactation length,decreased numbers of piglets weaned and decreased ages at first-mating. However, the number of piglets weaned per litter is currently increasing because of genetic improvement [30], so it is not feasible for producers to decrease the number of piglets weaned. Furthermore, our study in-dicates that the probability of parity 1 sows having WMI 4 days was relatively stable in sows that weaned 12 piglets or more. In addition, increased lactation length simply increases farrowing intervals and de-creases sow reproductive efficiency [1], whereas there is EU legisration that reqires weaning age 28 days or higher for piglets [31]. Age at first estrus or first-mating can be decreased by boar exposure [32]. There-fore, in order to increase the probability of sows having WMI 4 days, we recommend using boar exposure to decrease age at-first mating, and also advise increasing feed intake during lactation [33] to meet the increased nutritional need in milk yields for increasing numbers of piglets, because insufficient lactational feed intake is a primary cause of prolonged WMI [28]. Additionally, a development problem or a feeding problem in gesta-tion of gilts may affect WMI in parity 1 sows.
Also, the relatively high ICC for herd variance indi-cates that there were large herd effects on the prob-ability of parity 1 sows having WMI 4 days, likely because their herd management differed in terms of aspects such as hormonal treatments, heat detection programs, lactational feed intake and genetics.
Finally, there are some limitations that should be noted in this observational study performed using commercial herd data. For example, use of hormone treatments, health status, nutritional programs, pen groups and genotype were not taken into account in the analysis. Even with such limitations, this research provides valuable information for pig producers and
veterinarians about WMI as a predictor for lifetime performance of sows.
Conclusion
Recording WMI in parity 1 may help to predict a sow’s
subsequent WMI and lifetime productivity. Also, parity 1 sows with WMI 4 or 5 days are likely to be fertile sows in breeding herds. Therefore, producers should adjust man-agement to increase the proportion of parity 1 sows with WMI 4 or 5 days, aiming especially for WMI 4 days.
Abbreviations
ICC:Intraclass correlation coefficients; WMI: Weaning-to-first-mating interval
Acknowledgements
The authors gratefully thank the swine producers for their cooperation in providing their valuable data for use in this study. We also thank Dr. I. McTaggart for his critical review of this manuscript.
Authors’contributions
YY, RI and YK were responsible for the study design. CP was responsible for data acquisition and participated in the study design. YY, RI and YK carried out the statistical analysis and drafted the manuscript. All authors read and approved the final manuscript.
Funding
This work was supported by the Graduate School GP-2018 from Meiji University.
Availability of data and materials
The dataset analyzed during the current study is not publicly available because producers’privacy could be compromised.
Ethics approval and consent to participate
Not applicable.
Consent for publication
Not applicable.
Competing interests
The authors declare that they have no competing interests.
Author details
1School of Agriculture, Meiji University, Higashi-mita 1-1-1, Tama-ku,
Kawasaki, Kanagawa 214-8571, Japan.2PigCHAMP Pro Europa S.L., c/Calle Dámaso Alonso, 14, 40006 Segovia, Spain.
Received: 13 March 2019 Accepted: 7 June 2019
References
1. Koketsu Y, Tani S, Iida R. Factors for improving reproductive performance of sows and herd productivity in commercial breeding herds. Porcine Health Manag. 2017;3(1).
2. Tummaruk P, Tantasuparuk W, Techakumphu M, Kunavongkrit A. Influence of repeat-service and weaning-to-first-service interval on farrowing proportion of gilts and sows. Prev Vet Med. 2010;96:194–200. 3. Tantasuparuk W, Lundeheim N, Dalin AM, Kunavongkrit A, Einarsson S.
Weaning-to-service interval in primiparous sows and its relationship with longevity and piglet production. Livest Prod Sci. 2001;69:155–62. 4. Hoshino Y, Koketsu Y. A repeatability assessment of sows mated 4-6 days
after weaning in breeding herds. Anim Reprod Sci. 2008;108:22–8. 5. Tummaruk P, Lundeheim N, Einarsson S, Dalin AM. Reproductive performance
of purebred Hampshire sows in Sweden. Livest Prod Sci. 2001;68:67–77. 6. Xue JL, Dial GD, Marsh WE, Davies PR, Momont HW. Influence of lactation
length on sow productivity. Livest Prod Sci. 1993;34:253–65.
8. European commission. Pig: number of farms and heads by agricultural size of farm (UAA) and size of pig herd. 2016.http://ec.europa.eu/eurostat/web/ products-datasets/-/ef_lspigaa. Accessed 30 Aug 2017.
9. Tani S, Piñeiro C, Koketsu Y. Characteristics and risk factors for severe repeat-breeder female pigs and their lifetime performance in commercial breeding herds. Porcine Health Manag. 2017;3(12).
10. Bloemhof S, Mathur PK, Knol EF, van der Waaij EH. Effect of daily environmental temperature on farrowing rate and total born in dam line sows. J Anim Sci. 2013;91:2667–79.
11. Marois D, Brisbane JR, Laforest JP. Accounting for lactation length and weaning-to-conception interval in genetic evaluations for litter size in swine. J Anim Sci. 2000;78:1796–810.
12. Hoving LL, Soede NM, Graat EAM, Feitsma H, Kemp B. Reproductive performance of second parity sows: relations with subsequent reproduction. Livest Sci. 2011; 140:124–30.
13. Vesseur PC, Kemp B, den Hartog LA, Noordhuizen JPTM. Effect of split-weaning in first and second parity sows on sow and piglet performance. Livest Prod Sci. 1997;49:277–85.
14. Wilson MR, Dewey CE. The associations between weaning-to-estrus interval and sow efficiency. J Swine Health Prod. 1993;1:10–5.
15. Shaw HJ, Foxcroft GR. Relationships between LH, FSH and prolactin secretion and reproductive activity in the weaned sow. J Reprod Fertil. 1985;75:17–28. 16. Szyndler-Nędza M. Coefficients of repeatability for colostrum and milk
composition of PLW and PL sows over three consecutive lactations. Livest Sci. 2016;185:56–60.
17. Dohoo IR, Martin SW, Stryhn H. Veterinary epidemiologic research. 2nd ed. Charlottetown: VER Inc; 2009.
18. Koketsu Y, Dial GD, Pettigrew JE, Marsh WE, King VL. Influence of imposed feed intake patterns during lactation on reproductive performance and on circulating levels of glucose, insulin, and luteinizing hormone in primiparous sows. J Anim Sci. 1996;74:1036–46.
19. Soede NM, Langendijk P, Kemp B. Reproductive cycles in pigs. Anim Reprod Sci. 2011;124:251–8.
20. Bertoldo MJ, Holyoake PK, Evans G, Grupen CG. Seasonal variation in the ovarian function of sows. Reprod Fertil Dev. 2012;24:822–34.
21. Vinsky MD, Novak S, Dixon WT, Dyck MK, Foxcroft GR. Nutritional restriction in lactating primiparous sows selectively affects female embryo survival and overall litter development. Reprod Fertil Dev. 2006;18:347–55.
22. De Rensis F, Gherpelli M, Superchi P, Kirkwood RN. Relationships between backfat depth and plasma leptin during lactation and sow reproductive performance after weaning. Anim Reprod Sci. 2005;90:95–100. 23. Castagna CD, Peixoto CH, Bortolozzo FP, Wentz I, Neto GB, Ruschel F.
Ovarian cysts and their consequences on the reproductive performance of swine herds. Anim Reprod Sci. 2004;81:115–23.
24. Almond GW, Flowers WL, Batista L, D’Allaire S. Diseases of the reproductive system. In: Straw BE, Zimmerman JJ, D’Allaire S, Taylor DJ, editors. Diseases of swine. 9th ed. Ames: Blackwell Publishing; 2006. p. 113–47.
25. Tummaruk P, Kesdangsakonwut S. Factors affecting the incidence of cystic ovaries in replacement gilts. Comp Clin Pathol. 2012;21:1–7.
26. Mabry JW, Culbertson MS, Reeves D. Effects of lactation length on weaning-to-first-service interval, first-service farrowing rate, and subsequent litter size. Swine Health Prod. 1996;4:185–8.
27. Iida R, Koketsu Y. Quantitative associations between outdoor climate data and weaning-to-first-mating interval or adjusted 21-day litter weights during summer in Japanese swine breeding herds. Livest Sci. 2013;152:253–60. 28. Kirkwood RN, Althouse GC, Yaeger MJ, Carr J, Almond GW. Diseases of the
reproductive system. In: Zimmerman JJ, Karriker LA, Ramirez A, Schwartz KJ, Stevenson GW, editors. Diseases of swine. 10th ed. Chichester: Wiley; 2012. p. 329–47. 29. Bloemhof S, van der Waaij EH, Merks JWM, Knol EF. Sow line differences in
heat stress tolerance expressed in reproductive performance traits. J Anim Sci. 2008;86:3330–7.
30. Nielsen SE, Kristensen AR, Moustsen VA. Litter size of Danish crossbred sows increased without changes in sow body dimensions over a thirteen year period. Livest Sci. 2018;209:73–6.
31. European Commission. Council Directive 2008/120/CE of 18 December 2008 laying down minimum standards for the protection of pigs.http://eur-lex. europa.eu/LexUriServ/LexUriServ.do?uri=OJ:L:2009:047:0005:0013:EN:PDF.
Accessed 7 May 2019.
32. Patterson JL, Beltranena E, Foxcroft GR. The effect of gilt age at first estrus and breeding on third estrus on sow body weight changes and long term reproductive performance. J Anim Sci. 2010;88:2500–13.
33. Koketsu Y, Dial GD, Pettigrew JE, Marsh WE, King VL. Characterization of feed intake patterns during lactation in commercial swine herds. J Anim Sci. 1996;74:1202–10.
Publisher’s Note