Open Access
Research
Usage patterns, health, and nutritional status of long-term multiple
dietary supplement users: a cross-sectional study
Gladys Block*
1, Christopher D Jensen
1, Edward P Norkus
2, Tapashi B Dalvi
1,
Les G Wong
3, Jamie F McManus
3and Mark L Hudes
4Address: 1School of Public Health, 50 University Hall, University of California, Berkeley, CA, 94720, USA, 2Department of Medical Research, Our
Lady of Mercy Medical Center, 600 East 233rd Street, Bronx, NY, 10466, USA, 3Shaklee Corporation, 4747 Willow Road, Pleasanton, CA, 94588,
USA and 4Nutritional Sciences and Toxicology, 234 Morgan Hall, University of California, Berkeley, CA, 94720, USA
Email: Gladys Block* - [email protected]; Christopher D Jensen - [email protected]; Edward P Norkus - [email protected]; Tapashi B Dalvi - [email protected]; Les G Wong - [email protected]; Jamie F McManus - [email protected];
Mark L Hudes - [email protected] * Corresponding author
Abstract
Background: Dietary supplement use in the United States is prevalent and represents an important source of nutrition. However, little is known about individuals who routinely consume multiple dietary supplements. This study describes the dietary supplement usage patterns, health, and nutritional status of long-term multiple dietary supplement users, and where possible makes comparisons to non-users and multivitamin/mineral supplement users.
Methods: Using a cross-sectional study design, information was obtained by online questionnaires and physical examination (fasting blood, blood pressure, body weight) from a convenience sample of long-term users of multiple dietary supplements manufactured by Shaklee Corporation (Multiple Supp users, n = 278). Data for non-users (No Supp users, n = 602) and multivitamin/mineral supplement users (Single Supp users, n = 176) were obtained from the National Health and Nutrition Examination Survey (NHANES) 2001–2002 and NHANES III 1988–1994. Logistic regression methods were used to estimate odds ratios with 95% confidence intervals.
Results: Dietary supplements consumed on a daily basis by more than 50% of Multiple Supp users included a multivitamin/mineral, B-complex, vitamin C, carotenoids, vitamin E, calcium with vitamin D, omega-3 fatty acids, flavonoids, lecithin, alfalfa, coenzyme Q10 with resveratrol, glucosamine, and a herbal immune supplement. The majority of women also consumed gamma linolenic acid and a probiotic supplement, whereas men also consumed zinc, garlic, saw palmetto, and a soy protein supplement. Serum nutrient concentrations generally increased with increasing dietary supplement use. After adjustment for age, gender, income, education and body mass index, greater degree of supplement use was associated with more favorable concentrations of serum homocysteine, C-reactive protein, high-density lipoprotein cholesterol, and triglycerides, as well as lower risk of prevalent elevated blood pressure and diabetes. Conclusion: This group of long-term multiple dietary supplement users consumed a broad array of vitamin/mineral, herbal, and condition-specific dietary supplements on a daily basis. They were more likely to have optimal concentrations of chronic disease-related biomarkers, and less likely to have suboptimal blood nutrient concentrations, elevated blood pressure, and diabetes compared to non-users and multivitamin/mineral users. These findings should be confirmed by studying the dietary supplement usage patterns, health, and nutritional status of other groups of heavy users of dietary supplements.
Published: 24 October 2007
Nutrition Journal 2007, 6:30 doi:10.1186/1475-2891-6-30
Received: 26 April 2007 Accepted: 24 October 2007
This article is available from: http://www.nutritionj.com/content/6/1/30
© 2007 Block et al; licensee BioMed Central Ltd.
Background
Diet and nutrition play important roles in the mainte-nance of health and prevention of disease [1,2]. Dietary supplements represent an important source of essential nutrients since they are widely used and often contain 100% or more of the Daily Value of one or more nutrients [3,4]. They are also of concern because of potential adverse effects [5]. Prior studies have reported the preva-lence of dietary supplement usage and the characteristics of users in the United States (US) population. In the most recent reporting of nationwide survey data, the National Health and Nutrition Examination Survey (NHANES) 1999–2000, 52% of adults reported taking a dietary sup-plement in the past 30 days [4]. This and other surveys have generally found that dietary supplement usage is more common in women than men, in older participants than in younger ones, in Whites compared with Blacks and Mexican Americans, in the more educated as com-pared to the less educated, and in the more affluent as compared to less affluent [4]. In NHANES 1999–2000, approximately 47% of dietary supplement users reported taking only one type of supplement (most commonly a multivitamin/mineral) [4]. Only 3 individuals out of over 11,000 surveyed reported taking 20 or more different sup-plements in the past 30 days. Consequently, little if any descriptive information has been reported about individ-uals who typically consume multiple dietary supple-ments.
This cross-sectional study was undertaken to describe the dietary supplement usage patterns, serum nutrient and biomarker concentrations, and health status of a conven-ience sample of individuals who were daily users of mul-tiple dietary supplements (median of 26 different dietary supplements taken daily in the prior 12 months). In addi-tion, biomarker concentrations and the health status of multiple dietary supplement users were compared with two other convenience samples assembled from NHANES: non-users of supplements and those who con-sumed a multivitamin/mineral supplement only.
Methods
Participants
To assemble a sample of long-term users of multiple die-tary supplements, individuals who had been consumers of dietary supplements for ≥ 20 years from a dietary sup-plement manufacturer and distributor (Shaklee Corpora-tion, Pleasanton, CA) were invited to participate in the study. The invitation was sent by electronic mail to approximately 1,200 individuals meeting this criterion. Of the total invitees, 435 successfully completed online questionnaires to obtain information about height, annual household income, education, medical history and current medical conditions, and dietary supplement usage. Reasons for non-participation were not
investi-gated. A subset of 300 individuals who completed the questionnaires and were free of cancer, other than non-melanoma skin cancer, were randomly chosen and asked to attend a physical examination for the purpose of pro-viding a 12-hour fasting blood sample and having their body weight and blood pressure measured. A final ana-lytic sample of 278 participants had complete question-naire and examination data. These individuals composed the 'Multiple Supp' users. The study was reviewed and approved by an independent institutional review board (Health Research and Studies Center, Palo Alto, Califor-nia), and all participants provided informed consent.
Data collection
For the Multiple Supp users, online questionnaires were used to obtain information about height, annual house-hold income, education, medical history and current medical conditions, and current dietary supplement usage. Questions about medical history and current med-ical conditions were patterned after questions asked in NHANES 2001–2002 [6]. The dietary supplement ques-tionnaire included 57 dietary supplements and foods sold by Shaklee in 2005 and asked about usual intake in the previous 12 months. The questionnaire included four intake frequency categories including 'rarely or never used,' '1–3 days per week,' '4–6 days per week,' and 'every day,' and also asked about usual serving size.
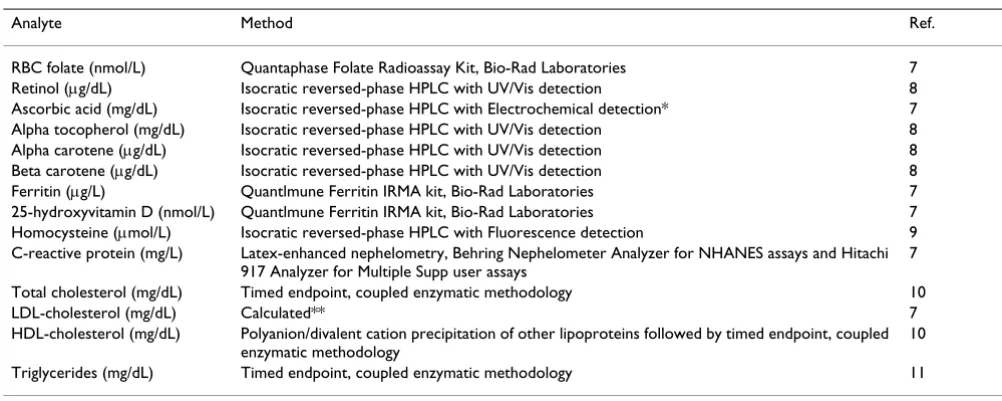
Physical examinations were conducted during a national meeting of Shaklee product consumers held in Chicago, Illinois in August 2005. Data collection took place between July and August of 2005. Body weight was meas-ured using a physician's scale with shoes and heavy cloth-ing removed. Triplicate blood pressure measurements were taken by an automated Welch Allyn device (Model 5201) with an appropriate-sized cuff after subjects were seated quietly in a chair for 2 minutes, with feet on the ground and with the arm at the level of the heart. Twelve-hour fasting blood samples were collected, processed, aliquoted and stored frozen at -80°C. Samples were assayed for red blood cell (RBC) folate, serum ascorbic acid stabilized using 10% metaphosphoric acid, alpha tocopherol, carotenoids, retinol, 25-hydroxyvitamin D, ferritin, C-reactive protein (CRP), lipids, and homo-cysteine (Table 1). Assay procedures followed those that were utilized in NHANES 2001–2002 and in NHANES III [6-12] as described in Table 1.
Multivitamin/mineral and non-supplement users from NHANES
an examination in the NHANES mobile examination unit [6]. Dietary supplement intake was assessed in NHANES by asking participants about their dietary supplement usage patterns in the past 30 days prior to their home interview, including use of any vitamins, minerals, or other dietary supplements. NHANES oversamples certain groups, such as older people and low-income individuals, in order to obtain greater precision in estimates for those groups; sample weights are applied by NHANES to adjust for oversampling and nonresponse. NHANES sample selection involves a stratified multistage probability design involving counties, blocks, and households. Con-sequently, variance estimates require use of special soft-ware making use of NHANES strata and primary sampling units to account for the sampling design.
To match the age and race composition of the Multiple Supp users, we selected from NHANES 2001–2002 partic-ipants all of the White men and women, >35 years of age, and free of cancer other than non-melanoma skin cancer, who met certain supplement use criteria. Only non-sup-plement users and users of supnon-sup-plements containing vita-mins and/or minerals were included for the present analysis. We identified 602 NHANES participants who consumed no dietary supplements in the 30 days prior to the home interview; these became the 'No Supp' users. We also identified 176 individuals who consumed a multivi-tamin/mineral and no other dietary supplements, and did so at least 15 days over the past 30 days. These became the 'Single Supp' users. To obtain the most recent data possi-ble for comparative purposes, RBC folate, and serum fer-ritin, homocysteine, CRP, and lipid data were obtained
from NHANES 2001–2002 [7]. However, serum retinol, ascorbic acid, alpha tocopherol, and serum carotenoid data were not available from NHANES 2001–2002 or 2003–2004. Therefore, data for these variables for Single Supp and No Supp users who were White, >35 years of age, and free of cancer other than non-melanoma skin cancer were obtained from NHANES III, 1988–1994 [8,9]. The geographical distribution of the individuals in the three users groups is not known. In addition, the dura-tion of dietary supplement usage by NHANES partici-pants, aside from the 30 days prior to their home interview, is unknown.
Statistical analyses
After combining the Multiple Supp users with the Single Supp and No Supp users from NHANES, data were reweighted. The weights for the NHANES groups were cal-culated by dividing each NHANES weight by the sum of the NHANES weights of the user group. Appropriate weights were used depending on whether the data came from the interview or the Mobile Examination Center. Multiple Supp users were assigned a weight of 1. Strata and primary sampling units from NHANES were used for those user groups. For the Multiple Supp users, a new stra-tum variable was assigned, and each member of the Mul-tiple Supp group was assigned to a unique primary sampling unit. These adjustments permit more accurate variance estimates and account for stratification factors. However, the Single Supp and No Supp users from NHANES should not be interpreted as being nationally representative samples. Calculations used SUDAAN
Ver-Table 1: Micronutrient assay methods.
Analyte Method Ref.
RBC folate (nmol/L) Quantaphase Folate Radioassay Kit, Bio-Rad Laboratories 7 Retinol (µg/dL) Isocratic reversed-phase HPLC with UV/Vis detection 8 Ascorbic acid (mg/dL) Isocratic reversed-phase HPLC with Electrochemical detection* 7 Alpha tocopherol (mg/dL) Isocratic reversed-phase HPLC with UV/Vis detection 8 Alpha carotene (µg/dL) Isocratic reversed-phase HPLC with UV/Vis detection 8 Beta carotene (µg/dL) Isocratic reversed-phase HPLC with UV/Vis detection 8 Ferritin (µg/L) Quantlmune Ferritin IRMA kit, Bio-Rad Laboratories 7 25-hydroxyvitamin D (nmol/L) Quantlmune Ferritin IRMA kit, Bio-Rad Laboratories 7 Homocysteine (µmol/L) Isocratic reversed-phase HPLC with Fluorescence detection 9 C-reactive protein (mg/L) Latex-enhanced nephelometry, Behring Nephelometer Analyzer for NHANES assays and Hitachi
917 Analyzer for Multiple Supp user assays
7
Total cholesterol (mg/dL) Timed endpoint, coupled enzymatic methodology 10
LDL-cholesterol (mg/dL) Calculated** 7
HDL-cholesterol (mg/dL) Polyanion/divalent cation precipitation of other lipoproteins followed by timed endpoint, coupled enzymatic methodology
10
Triglycerides (mg/dL) Timed endpoint, coupled enzymatic methodology 11
*Use of 1 part serum plus 1 part 10% phosphoric acid for Multiple Supp users versus NHANES use of 1 part serum plus 4 part meta-phosphoric acid.
sion 9.0 (Research Triangle Institute International, Research Triangle Park, North Carolina).
Differences in the characteristics of the supplement user groups were evaluated using chi-square methods for cate-gorical variables and one-way analysis of variance for con-tinuous variables. Multiple regression techniques were employed to examine differences in nutrient and biomar-ker concentrations of user groups. Comparisons of mean nutrient concentrations among user groups (RBC folate, and serum retinol, ascorbic acid, alpha tocopherol, caro-tenoids, and ferritin) were adjusted for sex and age. Com-parisons of biomarker concentrations among user groups (serum homocysteine, CRP, total cholesterol, and lipids) were further adjusted for age2, education category (<high school, high school graduate, or >high school), income category (<$30,000, ≥$30,000 and <$40,000, ≥$40,000 and <$50,000, ≥$50,000 and <$60,000, ≥$60,000 and <$70,000, and ≥$70,000) and income2, and body mass index (BMI). For outcomes treated as dichotomous varia-bles, logistic regression methods were used to estimate odds ratios (OR) with 95% confidence intervals (CI), adjusted for sex, age and age2, education category, income category and income2, and BMI. The model fit was exam-ined using the Hosmer and Lemeshow Goodness-of-Fit test. The referent group for risk estimation was the No Supp user group. Statistical significance was defined as p < 0.05.
Elevated blood pressure was defined as >80 mmHg for diastolic and/or >120 mmHg for systolic blood pressure [13]. Suboptimal and elevated nutrient and biomarker concentrations were defined as: <317 nmol/L RBC folate
[14,15]; <37.5 nmol/L and >600 nmol/L for serum 25-hydroxyvitamin D [16-19]; >9 µmol/L for serum homo-cysteine [20]; >3.0 mg/L for serum CRP [21]; ≥200 mg/dL for serum total cholesterol [22]; <40 mg/dL for serum high-density lipoprotein (HDL)-cholesterol for men and <50 mg/dL for women [22]; ≥130 mg/dL for serum low-density lipoprotein (LDL)-cholesterol [22]; <5 for the ratio of total cholesterol to HDL-cholesterol [22]; ≥150 mg/dL for serum triglycerides [22]; and <0.4 mg/dL and >1.0 mg/dL for ascorbic acid [23,24].
Results
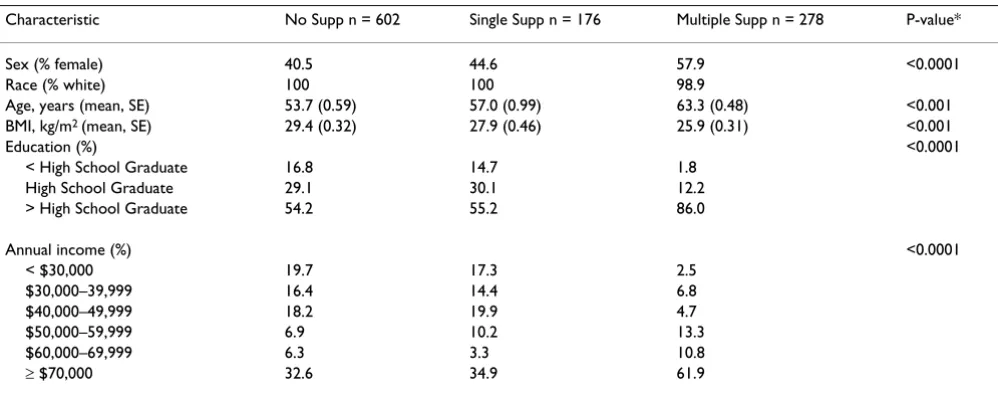
Significant differences by user group were found for sex, age, BMI, education, and household income (Table 2). The proportion female increased with increasing degree of supplement use. The two supplement user groups were older than the No Supp users, and had lower BMI. Multi-ple Supp users were well-educated with 86% having greater than a high school education compared to approx-imately 55% in the other two user groups. The proportion with annual household incomes less than $30,000 was 19.7% and 17.3% in the No Supp and Single Supp users respectively, and 2.5% in the Multiple Supp group. Partic-ipants were predominately White because of the racial composition of the Multiple Supp users and the fact that Single Supp and No Supp users were matched to Multiple Supp users on race.
Dietary supplement usage patterns
By definition, No Supp users consumed no supplements and Single Supp users consumed only a multivitamin/ mineral dietary supplement and did so approximately every other day or more often. Multiple Supp users
Table 2: Characteristics of the three supplement user groups: multiple dietary supplement users (Multiple Supp) from Shaklee, and multivitamin/mineral users (Single Supp) and non-users (No Supp) from NHANES 2001–2002.
Characteristic No Supp n = 602 Single Supp n = 176 Multiple Supp n = 278 P-value*
Sex (% female) 40.5 44.6 57.9 <0.0001
Race (% white) 100 100 98.9
Age, years (mean, SE) 53.7 (0.59) 57.0 (0.99) 63.3 (0.48) <0.001 BMI, kg/m2 (mean, SE) 29.4 (0.32) 27.9 (0.46) 25.9 (0.31) <0.001
Education (%) <0.0001
< High School Graduate 16.8 14.7 1.8 High School Graduate 29.1 30.1 12.2 > High School Graduate 54.2 55.2 86.0
Annual income (%) <0.0001
< $30,000 19.7 17.3 2.5
$30,000–39,999 16.4 14.4 6.8
$40,000–49,999 18.2 19.9 4.7
$50,000–59,999 6.9 10.2 13.3
$60,000–69,999 6.3 3.3 10.8
≥ $70,000 32.6 34.9 61.9
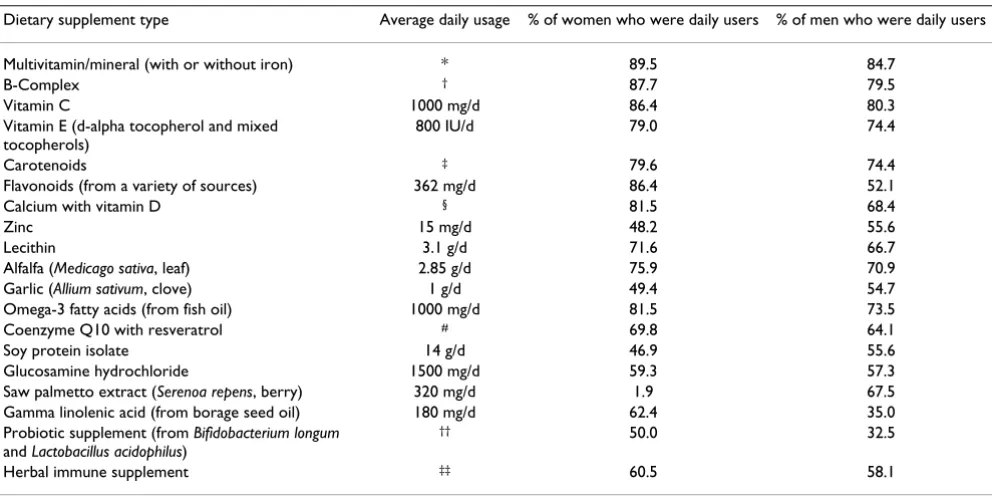
reported taking an average of 25 different supplements in the past 12 months (median, 26), and took an average of 17 different supplements every day (median, 18) (data not shown). Dietary supplements consumed on a daily basis by more than 50% of both male and female Multiple Supp users included a multivitamin/mineral, B-complex, vitamin C, vitamin E, calcium with vitamin D, a herbal immune supplement, carotenoids, omega-3 fatty acids, flavonoids, lecithin, coenzyme Q10 with resveratrol, alfalfa, and glucosamine (Table 3). In addition, a majority of women also consumed gamma linolenic acid and a probiotic supplement, whereas men also consumed zinc, garlic, a soy protein supplement, and saw palmetto daily.
Serum nutrient and biomarker concentrations
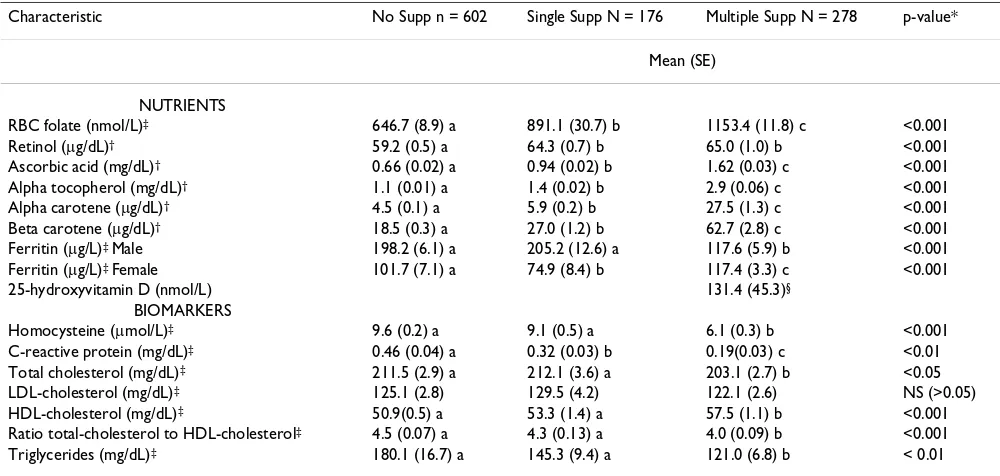
There was a statistically significant increase in RBC folate and serum concentrations of ascorbic acid, alpha and beta carotene, and alpha tocopherol with degree of supple-mentation use (Table 4). For these nutrients, Single Supp users had significantly higher nutrient concentrations than No Supp users, and Multiple Supp users had higher concentrations than the Single Supp group. Serum retinol was higher among Single and Multiple Supp users com-pared to No Supp users. Among women, serum ferritin was highest in Multiple Supp users and lower in the Single Supp users compared to No Supp users. Among men,
serum ferritin was significantly lower in the Multiple Supp users compared to the two other supplement groups.
There was a decrease in concentrations of biomarkers associated with disease risk as supplement use increased (Table 4). Across the three user groups there was a decrease in serum CRP and the ratio of total cholesterol to HDL-cholesterol, and an increase in HDL-cholesterol con-centration. Serum homocysteine and triglycerides were lower in the Multiple Supp users than in the other two groups. Finally, serum total cholesterol was significantly lower in the Multiple Supp group, whereas LDL-choles-terol concentrations did not vary significantly by supple-ment use.
Among Multiple Supp users, no individuals had subopti-mal or elevated serum 25-hydroxyvitamin D concentra-tions (range: 39.3–263.8 nmol/L). No comparative 25-hydroxyvitamin D data were available from NHANES. No Multiple Supp users had suboptimal serum ascorbic acid concentrations (<0.4 mg/dL), compared with 9.4% among Single Supp users and 32.4% among the No Supp group (data not shown). Similarly, 94.1% of Multiple Supp users had serum ascorbic acid concentrations >1.0 mg/dL, compared with 46.6% of Single Supp users and 21.9% of No Supp users (data not shown).
Table 3: Dietary supplement usage patterns of long-term users of multiple dietary supplements (Multiple Supp users).
Dietary supplement type Average daily usage % of women who were daily users % of men who were daily users
Multivitamin/mineral (with or without iron) * 89.5 84.7
B-Complex † 87.7 79.5
Vitamin C 1000 mg/d 86.4 80.3
Vitamin E (d-alpha tocopherol and mixed tocopherols)
800 IU/d 79.0 74.4
Carotenoids ‡ 79.6 74.4
Flavonoids (from a variety of sources) 362 mg/d 86.4 52.1
Calcium with vitamin D § 81.5 68.4
Zinc 15 mg/d 48.2 55.6
Lecithin 3.1 g/d 71.6 66.7
Alfalfa (Medicago sativa, leaf) 2.85 g/d 75.9 70.9 Garlic (Allium sativum, clove) 1 g/d 49.4 54.7 Omega-3 fatty acids (from fish oil) 1000 mg/d 81.5 73.5 Coenzyme Q10 with resveratrol # 69.8 64.1
Soy protein isolate 14 g/d 46.9 55.6
Glucosamine hydrochloride 1500 mg/d 59.3 57.3 Saw palmetto extract (Serenoa repens, berry) 320 mg/d 1.9 67.5 Gamma linolenic acid (from borage seed oil) 180 mg/d 62.4 35.0 Probiotic supplement (from Bifidobacterium longum
and Lactobacillus acidophilus)
†† 50.0 32.5
Herbal immune supplement ‡‡ 60.5 58.1
*35–200% of the Daily Value for 25 vitamin and minerals and also includes 5 trace minerals.
†200–2700% of the Daily Value for 8 B vitamins.
‡5000 IU/d vitamin A as beta carotene, 5 mg/d lycopene, 5 mg/d lutein, 1.5 mg/d alpha carotene, 200 mcg/d zeaxanthin, 400 mcg/d astaxanthin. §1500 mg/d calcium, 600 IU/d vitamin D, 600 mcg/d vitamin K, 600 mg/d magnesium, and <15% of the Daily value for zinc, copper, and manganese. #30 mg/d coenzyme Q10 and 640 mcg/d resveratrol.
††250 million/d Bifidobacterium longum and 250 million/d Lactobacillus acidophilus.
‡‡500 mg/d plant extracts from pumpkin seed (Curcubita moschata), safflower flower (Carthamus tinctorius), asian plantain seed (Plantago asiatica),
Blood pressure and adverse biomarker concentrations
Adjusted risk estimates for elevated blood pressure and suboptimal or elevated concentrations of serum biomark-ers are reported in Table 5. Compared to No Supp usbiomark-ers, Multiple Supp users had significantly reduced risks of ele-vated serum homocysteine, triglycerides, and ratio of total cholesterol to HDL-cholesterol, and significantly reduced risk of low HDL-cholesterol. For elevated serum CRP, the risk among Multiple Supp users could not be estimated because of the absence of any persons with elevated values of CRP. Multiple Supp users also had a significantly reduced risk of elevated blood pressure compared to No Supp users. Single Supp users had significantly lower risks of elevated serum homocysteine, and low serum HDL-cholesterol. Risks of elevated serum total cholesterol and LDL-cholesterol did not significantly differ across the sup-plement user groups.
Health status and disease prevalence
Prevalence of self-reported disease was low in each user group and most risk estimates did not reach statistical sig-nificance (Table 6). An exception was the reduced risk of diabetes in Multiple Supp users (OR = 0.27; 95% CI: 0.12–0.59). Risk of coronary heart disease was also lower
in this group (OR = 0.48; 95% CI: 0.22–1.09), but was only marginally statistically significant. For self-assessed health status, Multiple Supp users, but not Single Supp users, were less likely to report their health as 'good, fair, or poor' versus 'excellent or very good' (OR = 0.26; 95% CI: 0.17–0.41) compared to the No Supp users group (Table 6).
Discussion
Little has been reported about daily users of multiple die-tary supplements. We assembled a sample of long-term users of multiple dietary supplements for the purpose of describing their supplement usage patterns. On average, Multiple Supp users in this study consumed 17 different supplements every day. Dietary supplements consumed on a daily basis by more than 50% of Multiple Supp users included a multivitamin/mineral, B-complex, vitamin C, carotenoids, vitamin E, calcium with vitamin D, omega-3 fatty acids, flavonoids, lecithin, alfalfa, coenzyme Q10 with resveratrol, glucosamine, and a herbal immune sup-plement. Women also consumed gamma linolenic acid and a probiotic supplement, whereas men also consumed zinc, garlic, a soy protein supplement, and saw palmetto (Table 2). By comparison, in NHANES 1999–2000, 52%
Table 4: Serum nutrient and biomarker concentrations of a sample of long-term users of multiple dietary supplements (Multiple Supp), and of multivitaminmineral users (Single Supp) and non-users (No Supp) from NHANES 2001–2002 and NHANES III 1988– 1994.
Characteristic No Supp n = 602 Single Supp N = 176 Multiple Supp N = 278 p-value*
Mean (SE)
NUTRIENTS
RBC folate (nmol/L)‡ 646.7 (8.9) a 891.1 (30.7) b 1153.4 (11.8) c <0.001
Retinol (µg/dL)† 59.2 (0.5) a 64.3 (0.7) b 65.0 (1.0) b <0.001
Ascorbic acid (mg/dL)† 0.66 (0.02) a 0.94 (0.02) b 1.62 (0.03) c <0.001
Alpha tocopherol (mg/dL)† 1.1 (0.01) a 1.4 (0.02) b 2.9 (0.06) c <0.001
Alpha carotene (µg/dL)† 4.5 (0.1) a 5.9 (0.2) b 27.5 (1.3) c <0.001
Beta carotene (µg/dL)† 18.5 (0.3) a 27.0 (1.2) b 62.7 (2.8) c <0.001
Ferritin (µg/L)‡ Male 198.2 (6.1) a 205.2 (12.6) a 117.6 (5.9) b <0.001
Ferritin (µg/L)‡ Female 101.7 (7.1) a 74.9 (8.4) b 117.4 (3.3) c <0.001
25-hydroxyvitamin D (nmol/L) 131.4 (45.3)§
BIOMARKERS
Homocysteine (µmol/L)‡ 9.6 (0.2) a 9.1 (0.5) a 6.1 (0.3) b <0.001
C-reactive protein (mg/dL)‡ 0.46 (0.04) a 0.32 (0.03) b 0.19(0.03) c <0.01
Total cholesterol (mg/dL)‡ 211.5 (2.9) a 212.1 (3.6) a 203.1 (2.7) b <0.05
LDL-cholesterol (mg/dL)‡ 125.1 (2.8) 129.5 (4.2) 122.1 (2.6) NS (>0.05)
HDL-cholesterol (mg/dL)‡ 50.9(0.5) a 53.3 (1.4) a 57.5 (1.1) b <0.001
Ratio total-cholesterol to HDL-cholesterol‡ 4.5 (0.07) a 4.3 (0.13) a 4.0 (0.09) b <0.001
Triglycerides (mg/dL)‡ 180.1 (16.7) a 145.3 (9.4) a 121.0 (6.8) b < 0.01
*Multiple regression techniques were employed to examine differences in nutrient and biomarker concentrations of user groups. Differences in nutrient concentrations were adjusted for sex and age. Differences in biomarker concentrations were further adjusted for age2, education, income
and income2, and body mass index (BMI). P-values represent the statistical significance for comparisons of user group means with different letters; if
these comparisons varied in significance level, the most significant is shown.
†Data obtained from NHANES III 1988–1994. ‡Data obtained from NHANES 2001–2002.
§Comparable 25–hydroxy vitamin D data not available from NHANES.
of those surveyed reported taking a dietary supplement in the past 30 days; 35% reported having taken a multivita-min/mineral; 12.7% having taken vitamin E; 12.4% hav-ing taken vitamin C; 10.4% havhav-ing taken calcium; and 5.2% having taken B-complex vitamins [4]. Consistent with other reports describing dietary supplement users [4], Multiple Supp users as a group were primarily White, better educated, more affluent, and older.
A second objective of the study was to conduct a cross-sec-tional comparison of the relevant biomarker and nutrient concentrations in the Multiple Supp users, with those of Single Supp users (multivitamin/mineral users) and No Supp users (non-users) in NHANES 2001–20002 and NHANES III. Nutrient concentrations in serum or RBC generally increased across the three supplement user
groups. It is notable that Single Supp users had higher cir-culating concentrations than No Supp users for RBC folate and serum retinol, ascorbic acid, and alpha tocopherol. This fact has important implications for nutrition inter-vention trials, some of which have permitted participants, including those in the control group, to take a multivita-min/mineral supplement [25]. Our findings suggest that this practice may weaken the power of trials to detect treatment effects of the study supplement.
Degree of supplement use was associated with several markers of disease risk. Elevated serum homocysteine concentrations were found in approximately 45% of No Supp users, 37% of Single Supp users, and 11% of Multi-ple Supp users, despite the fact that the data were obtained after the 1998 fortification of grain products with folate,
Table 5: Risk of suboptimal or elevated serum biomarker concentrations and elevated blood pressure by supplement user group.
Outcome Cases: n/(%) OR* 95% CI*
Homocysteine (>9 µmol/L)
Multiple Supp users 30/(10.9) 0.11 0.06–0.19 Single Supp users 69/(37.0) 0.53 0.34–0.83 No Supp users 282/(45.3) 1.00
C-reactive protein (>0.3 mg/dL)
Multiple Supp users 0/(0.00) † †
Single Supp users 51/(30.6) 0.66 0.40–1.09 No Supp users 230/(41.3) 1.00
Total cholesterol (>200 mg/dL)
Multiple Supp users 145/(52.5) 0.78 0.56–1.09 Single Supp users 89/(57.8) 1.08 0.72–1.62 No Supp users 291/(54.3) 1.00
HDL-cholesterol (<40 mg/dL males, <50 mg/dL females)
Multiple Supp users 44/(15.8) 0.50 0.33–0.75 Single Supp users 40/(24.5) 0.58 0.41–0.83 No Supp users 203/(38.0) 1.00
Ratio total cholesterol to HDL-cholesterol (<5)
Multiple Supp users 35/(12.7) 0.49 0.32–0.74 Single Supp users 48/(35.3) 1.05 0.64–1.73 No Supp users 189/(36.5) 1.00
Triglycerides (≥150 mg/dL)
Multiple Supp users 52/(18.8) 0.44 0.27–0.71 Single Supp users 31/(41.5) 0.99 0.50–1.94 No Supp users 157/(42.8) 1.00
LDL-cholesterol (>130 mg/dL)
Multiple Supp users 109/(39.5) 0.96 0.56–1.65 Single Supp users 32/(47.6) 1.19 0.70–2.03 No Supp users 101/(42.7) 1.00
Blood Pressure (DBP>80 mmHg or SBP>120 mmHg)
Multiple Supp users 154/(55.6) 0.61 0.41–0.92 Single Supp users 117/(71.2) 1.34 0.88–2.03 No Supp users 353/(64.6) 1.00
* Logistic regression methods were used to estimate odds ratios (OR) with 95% confidence intervals (CI), adjusted as in footnote to Table 4. The referent group for risk estimation was the No Supp group.
†OR and 95% CI not estimable because zero events in the user group. Number and percent shown instead.
and despite the low prevalence of inadequate RBC folate in any of the user groups. If moderately-elevated serum homocysteine is shown to be an important cardiovascular disease risk factor, the findings of this study suggest that intake of the relevant B vitamins above what is typically found in a multivitamin/mineral supplement, and/or the diet, may produce a more favorable homocysteine-lower-ing effect.
Circulating CRP concentration has been shown to be pre-dictive of future cardiovascular disease risk in prospective studies among asymptomatic individuals and may have a direct effect on the progression of atherosclerosis [26]. In
the present study, serum CRP concentrations decreased and serum ascorbic acid increased with increasing degree of supplement use (Tables 2 and 4). This finding is con-sistent with recent reports that vitamin C supplementa-tion lowers plasma CRP concentrasupplementa-tions [27], and that dietary intakes of vitamin C and plasma ascorbic acid con-centration are inversely associated with plasma CRP [28]. Studies are underway to confirm the impact of vitamin C supplementation on circulating CRP and other markers of immune function.
Serum ascorbic acid concentration >1.0 mg/dL has been suggested as optimal relative to reduced risk of cardiovas-cular disease and cancer [24]. By this definition, over 94% of Multiple Supp had optimal concentrations, compared to approximately 47% and 22% in Single Supp and No Supp users, respectively. Suboptimal concentrations, defined as <0.4 mg/dL [23], were not found in the Multi-ple Supp user group, and were found in approximately 9% and 32% of Single Supp and No Supp users, respec-tively.
Serum 25-hydroxyvitamin D in Multiple Supp users is of interest because of possible beneficial and adverse effects from supplemental intake of vitamin D. Improving 25-hydroxyvitamin D concentrations above the level associ-ated with subclinical deficiency (<37.5 nmol/L) may reduce the risk of skeletal fractures [16-19]. Also, parathy-roid hormone concentrations become minimal when 25-hydroxyvitamin D concentrations exceed 100 nmol/L. Conversely, serum concentrations >600 nmol/L are asso-ciated with hypercalcemia [19]. Among Multiple Supp users, no individuals had serum 25-hydroxyvitamin D concentrations <37.5 nmol/L or >600 nmol/L, and the mean (SD) was 131.4 (45.26) nmol/L with a range of 39.30 to 263.80 nmol/L. No comparative data were avail-able from NHANES participants.
Supplement use was also associated with lower serum triglycerides and higher HDL-cholesterol concentrations. In consequence, the risk of an elevated ratio of total cho-lesterol to HDL-chocho-lesterol was significantly lower in the Multiple Supp group compared to the No Supp group (Table 5). Prevalent use of fish oil supplements in the Multiple Supp users may explain these findings as omega-3 fatty acids in fish oil have been shown to increase HDL-cholesterol and decrease triglyceride concentrations [29]. Although beyond the scope of the present study, lower risk of cardiac arrhythmias may be another benefit of con-sumption of omega-3 fatty acids [30,31].
Self-assessed health status has been found to be a remark-ably good marker of prospective health outcomes [32]. Compared to No Supp users, Multiple Supp users were more likely to describe their health as 'very good' or
'excel-Table 6: Risk of prevalent disease, by supplement user group.
Outcome Cases: n/(%) ** OR* 95% CI*
Diabetes
Multiple Supp users 8/(2.9) 0.27 0.12–0.59 Single Supp users 23/(11.1) 1.11 0.74–1.67 No Supp users 70/(8.5) 1.00
Coronary Heart Disease
Multiple Supp users 14/(5.0) 0.48 0.22–1.09 Single Supp users 17/(7.1) 1.08 0.52–2.25 No Supp users 47/(5.6) 1.00
Heart Attack
Multiple Supp users 7/(2.5) 0.51 0.18–1.41 Single Supp users 16/(7.6) 1.76 0.90–3.42 No Supp users 44/(4.4) 1.00
Angina
Multiple Supp users 6/(2.2) 0.41 0.14–1.18 Single Supp users 12/(6.8) 1.71 0.82–3.59 No Supp users 35/(4.7) 1.00
Congestive Heart Failure
Multiple Supp users 4/(1.4) 0.73 0.18–2.95 Single Supp users 9/(2.8) 0.88 0.26–2.97 No Supp users 31/(3.5) 1.00
Stroke
Multiple Supp users 5/(1.8) 1.42 0.39–5.17 Single Supp users 6/(2.6) 1.26 0.34–4.67 No Supp users 29/(2.5) 1.00
Arthritis
Multiple Supp users 88/(31.7) 1.00 0.69–1.46 Single Supp users 71/(31.8) 1.23 0.77–1.98 No Supp users 189/(26.7) 1.00
Emphysema
Multiple Supp users 3/(1.1) 0.55 0.09–3.41 Single Supp users 4/(1.8) 0.73 0.32–1.64 No Supp users 23/(2.3) 1.00
Health Status†
Multiple Supp users 44/(15.8) 0.26 0.17–0.41 Single Supp users 86/(44.4) 0.75 0.45–1.23 No Supp users 302/(50.9) 1.00
* Logistic regression methods were used to estimate odds ratios (OR) with 95% confidence intervals (CI), adjusted for sex, age and age2,
education, income and income2, and body mass index. The referent
group for risk estimation was the No Supp group. ** Number of events, weighted percent
lent', whereas this was not the case with Single Supp users (Table 6).
Risk of elevated systolic or diastolic blood pressure was significantly lower in the Multiple Supp group compared to No Supp users, but not in Single Supp users compared to No Supp users (Table 5). Dietary interventions have been shown to reduce blood pressure [33]. However, clin-ical trials of individual nutrients have typclin-ically found small and inconsistent effects [33]. Dietary folate and vita-min C, as well as plasma ascorbic acid, have been found to be inversely associated with blood pressure in observa-tional studies [34,35]. However, intervention trials with vitamin C have yielded inconsistent results [35], while in two small trials, folic acid has been effective at lowering blood pressure [36,37]. The finding of a lower risk of ele-vated blood pressure in the Multiple Supp group, which also had the highest concentrations of RBC folate and serum ascorbic acid, suggests that the relationship between these nutrients and blood pressure may warrant further investigation.
The lower risk of diabetes in the Multiple Supp group is consistent with evidence that oxidative stress may be a mechanism linking insulin resistance with dysfunction of pancreatic beta cells and endothelial dysfunction, eventu-ally leading to diabetes [38]. Although biomarkers of oxi-dative stress were not available in the three user groups, serum concentrations of antioxidants including ascorbic acid, carotenoids, and alpha tocopherol were all signifi-cantly higher in the Multiple Supp users compared to the other groups (Table 2).
An important limitation of the study is the fact that the data are cross-sectional, and therefore the reported associ-ations, particularly with health outcomes (i.e., blood pres-sure and diabetes), cannot presume causality. Also, the three user groups should not be interpreted to represent unbiased national estimates. In addition, although we adjusted for potential confounders such as age, sex, income, education, and BMI, residual confounding could possibly account for the findings. Better access to health care and variables related to higher socioeconomic status in the supplement user groups (e.g., healthier diets and lifestyles) are logical hypotheses that may account for these results. However, the No Supp and Single Supp user groups were similar with respect to education and income (Table 2), so these factors may not explain the signifi-cantly better nutrient and C-reactive protein concentra-tions seen for Single Supp users in Table 4, and homocysteine and HDL risk levels (Table 5). Further-more, the lack of differences across the three user groups in biomarkers such as serum total cholesterol and LDL-cholesterol suggest that factors related to health care
access and socioeconomic status do not fully explain the results.
This study is the first we are aware of to describe the usage patterns of long-term users of multiple dietary supple-ments, an unusual sample that cannot be captured in national representative surveys. While only 3 individuals out of over 11,000 surveyed in NHANES 2001–2002 had taken 20 or more kinds of dietary supplements in the past 30 days, in our Multiple Supp users, 87% of the sample reported having taken 20 or more kinds of supplements daily. Thus, this sample of Multiple Supp users affords a rare opportunity to understand a segment of the popula-tion that take multiple dietary supplements, and to under-stand the nutrient and other correlates of this practice. In addition, Multiple Supp users were long-term consumers of dietary supplements. Thus, their serum nutrient and biomarker concentrations were likely to be representative of their long-term supplementation patterns.
Conclusion
This sample of long-term users of multiple dietary supple-ments was found to consume a broad array of vitamin/ mineral, herbal, and condition-specific dietary supple-ments on a daily basis. They were more likely to have opti-mal concentrations of biomarkers associated with reduced disease risk, and less likely to have suboptimal circulating nutrient concentrations, elevated blood pres-sure, and diabetes than multivitamin/mineral users and non-users. There was no evidence that intake of vitamin D in multiple supplement users was excessive based on serum 25-hydroxyvitamin D concentrations. These find-ings should be confirmed by studying the dietary supple-ment usage patterns and health and nutrition status of other groups of heavy users of dietary supplements. Our study findings should also be weighed in the context of recent randomized controlled trials and related meta-analyses [39,40] which have raised concern about poten-tial detrimental effects of select dietary supplements, par-ticularly beta carotene and alpha tocopherol. While the typical daily intake of beta carotene from supplements in the Multiple Supp group was low relative to those studies (approximately 5000 IU/d of vitamin A as beta carotene), the typical intake of alpha tocopherol was 800 IU/d, sim-ilar to the dose in a number of randomized trials. Further research on usage patterns of dietary supplements and the potential health effects of dietary supplements is needed. The present report serves as a baseline to which the find-ings of subsequent monitoring efforts can be compared.
Abbreviations
ratio, CI = confidence interval, HDL = high-density lipo-protein, LDL = low-density lipoprotein.
Competing interests
The study was financially supported by Shaklee Corpora-tion. LGW and JFM are employed by, and CDJ is a scien-tific consultant to the sponsor. GB has received research funding from the sponsor.
Authors' contributions
GB, CDJ, and LGW participated in the design of the study, acquisition of the data, analysis and interpretation of the data, and drafting and revising of the manuscript.
EPN and JFM participated in the acquisition of the data and revising of the manuscript. TBD and MLH partici-pated in the analysis and interpretation of the data and drafting and revising of the manuscript. All authors read and approved the final manuscript.
Acknowledgements
Shaklee Corporation financially supported this study. We would like to thank Torin Block of Block Dietary Data Systems and Kevin Maki and Mar-gie Bell of Provident Clinical Research & Consulting, Inc., for their assist-ance with data acquisition.
References
1. US Depart of Health and Human Services: The Surgeon General's report on nutrition and health. Public Health Service, Washing-ton, DC; 1988.
2. National Research Council Food and Nutrition Board Committee on Diet and Health: Diet and health: Implications for reducing chronic disease risk. National Academy Press. Washington, DC; 1989.
3. Ervin RB, Wright JD, Reed-Gillette D: Prevalence of leading types of dietary supplements used in the Third National Health and Nutrition Examination Survey, 1988–94. In Advanced data from vital health statistics; no 349 Hyattsville, Maryland: National Center for Health Statistics; 2004.
4. Radimer K, Bindewald B, Hughes J, Ervin B, Swanson C, Picciano MF:
Dietary supplement use by US adults: Data from the National Health and Nutrition Examination Survey, 1999– 2000. Am J Epidemiol 2004, 160:339-349.
5. Huang H-Y, Caballero B, Chang S, Alberg AJ, Semba RD, Schneyer CR, Wilson RF, Cheng T-Y, Vassy J, Prokopowicz G, Barnes GJ, Bass EB: The efficacy and safety of multivitamin and mineral sup-plement use to prevent cancer and chronic disease in adults: a systematic review for a National Institutes of Health State-of-the-Science Conference. Ann Int Med 2006, 145:1-14. 6. National Health and Nutrition Examination Survey, 2001–
2002 [http://www.cdc.gov/nchs/about/major/nhanes/nhanes01-02.htm]
7. National Health and Nutrition Examination Survey, 2001-laboratory methods [http://www.cdc.gov/nchs/about/major/ nhanes/lab_methods01_02.htm]
8. National Center for Health Statistics: Plan and operation of the third National Health and Nutrition Examination Survey, 1988–94. Vital Health Stat 1(32); DHHS publication (PHS) 94-1308
1994 [http://www.cdc.gov/nchs/about/major/nhanes/ NHANESIII_Reference_Manuals.htm]. Hyattsville, MD: National Center for Health Statistics
9. Gunter EW, Lewis BL, Koncikowski SM: Laboratory methods used for the third National Health and Nutrition
Examina-tion Survey (NHANES III), 1988–1994. 1996 [http://
www.cdc.gov/nchs/about/major/nhanes/
NHANESIII_Reference_Manuals.htm]. Hyattsville, MD: Centers for Disease Control and Prevention
10. Araki A, Sko Y: Determination of free and total homocysteine in human plasma by HPLC with fluorescence detection. J Chromatograph 1987, 422:43-53.
11. Bachorik PS, Kwiterovich PO: The measurement of plasma cho-lesterol, low density lipoprotein- and high density lipopro-tein-cholesterol. In Techniques in diagnostic human biochemical genetics: A laboratory manual Edited by: Hommes FA. New York: Wiley-Liss, Inc; 1991:425-439.
12. Bucolo G, David HL: Quantitative determination of serum trig-lycerides by the use of enzymes. Clin Chem 1973, 19:476-482. 13. Chobanian AV, Bakris GL, Black HR, Cushman WC, Green LA, Izzo
JL Jr, Jones DW, Materson BJ, Oparil S, Wright JT Jr, Roccella EJ: The Seventh report of the Joint National Committee on Preven-tion, DetecPreven-tion, EvaluaPreven-tion, and Treatment of High Blood Pressure: the JNC 7 report. JAMA 2003, 289:2560-2572. 14. Life Sciences Research Office: Assessment of the folate
nutri-tional status of the U.S. population based on data collected in the second National Health and Nutrition Survey, 1976– 1980. In Prepared for the Center for Food Safety and Nutrition, Food and Drug Administration Rockville, MD: Federation of American Societies for Experimental Biology; 1984.
15. Pfeiffer CM, Caudill SP, Gunter SP, Osterloh J, Sampson EJ: Bio-chemical indicators of B vitamin status in the US population after folic acid fortification: results from the National Health and Nutrition Examination Survey 1999–2000. Am J Clin Nutr
2005, 82:442-450.
16. Villareal D, Civitelli R, Chines A, Avioli L: Subclinical vitamin D deficiency in postmenopausal women with low vertebral bone mass. J Clin Endocrinol Metab 1991, 72:628-634.
17. Holick M: Vitamin D and bone health. J Nutr 1996,
126:1159S-1164S.
18. Dawson-Hughes B: Calcium and vitamin D nutritional needs of elderly women. J Nutr 1996, 126:1165S-1167S.
19. Hathcock JN, Shao A, Vieth R, Heaney R: Risk assessment for vita-min D. Am J Clin Nutr 2007, 85:6-18.
20. van Meurs JB, Dhonukshe-Rutten RA, Pluijm SM, van der Klift M, de Jong R, Lindemans J, de Groot LC, Hofman A, Witteman JC, van Leeu-wen JP, Breteler MM, Lips P, Pols HA, Uitterlinden AG: Homo-cysteine levels and the risk of osteoporotic fracture. N Engl J Med 2004, 350:2033-2041.
21. American Heart Association: C-reactive protein concentra-tions [http://www.americanheart.org/presenter.jhtml?identi fier=3007984.]
22. American Heart Association: Lipid concentrations [http:// www.americanheart.org/presenter.jhtml?identifier=183]
23. Food and Nutrition Board Institute of Medicine: Dietary reference intakes for vitamin C, vitamin E, selenium, and carotenoids.
National Academy Press, Washington DC; 2000.
24. Gey KF: Vitamins E plus C and interacting conutrients required for optimal health. A critical and constructive review of epidemiology and supplementation data regarding cardiovascular disease and cancer. Biofactors 1998, 7:113-174. 25. AREDS Research Group: The Age-Related Eye Disease Study
(AREDS): a randomized, placebo-controlled, clinical trial of high-dose supplementation with Vitamins C and E, beta car-otene, and zinc for age-related macular degeneration and vision loss. AREDS Report No. 8. Arch Ophthalmol 2001,
119:1417-1436.
26. Libby P: Inflammation in atherosclerosis. Nature 2002,
420:868-874.
27. Block G, Jensen C, Dietrich M, Norkus EP, Hudes M, Packer L:
Plasma C-reactive protein concentrations in active and pas-sive smokers: influence of antioxidant supplementation. J Am Coll Nutr 2004, 23:141-147.
28. Wannamethee SG, Lowe GDO, Rumley A, Bruckdorfer KR, Whincup PH: Associations of vitamin C status, fruit and vegetable intakes, and markers of inflammation and hemostasis. Am J Clin Nutr 2006, 83:567-74.
29. Chan DC, Watts GF, Nguyen MN, Barrett PHR: Factorial study of the effect of n-3 fatty acid supplementation and atorvastatin on the kinetics of HDL apolipoproteins A-I and A-II in men with abdominal obesity. Am J Clin Nutr 2006, 84:37-43. 30. Reiffel JA, McDonald A: Antiarrhythmic effects of omega-3 fatty
acids. Am J Cardiol 2006, 98:50i-60i.
Publish with BioMed Central and every scientist can read your work free of charge
"BioMed Central will be the most significant development for disseminating the results of biomedical researc h in our lifetime."
Sir Paul Nurse, Cancer Research UK
Your research papers will be:
available free of charge to the entire biomedical community
peer reviewed and published immediately upon acceptance
cited in PubMed and archived on PubMed Central
yours — you keep the copyright
Submit your manuscript here:
http://www.biomedcentral.com/info/publishing_adv.asp
BioMedcentral RM, Mastrogiuseppe G, Mininni L, Nicolosi GL, Santini M, Schweiger
C, Tavazzi L, Tognoni G, Tucci C, Valagussa F, GISSI-Prevenzione Investigators: Early protection against sudden death by omega-3 polyunsaturated fatty acids after myocardial infarc-tion time-course analysis of the results of the Gruppo Ital-iano per lo Studio della Sopravvivenza nell'Infarto
Miocardico (GISSI)-Prevenzione. Circulation 2002,
105:1897-1903.
32. Idler EL, Benyamini Y: Self-rated health and mortality: a review of twenty-seven community studies. J Health Soc Behav 1997,
38:21-37.
33. Appel LJ, Brands MW, Daniels SR, Karanja N, Elmer PJ, Sacks FM:
Dietary approaches to prevent and treat hypertension: a sci-entific statement from the American Heart Association. Hypertension 2006, 47:296-308.
34. Forman JP, Rimm EB, Stampfer MJ, Curhan GC: Folate intake and the risk of incident hypertension among US women. JAMA
2005, 293:320-329.
35. Ness AR, Chee D, Elliott P: Vitamin C and blood pressure: an overview. J Hum Hyperten 1997, 11:343-350.
36. van Dijk RA, Rauwerda JA, Steyn M, Twisk JW, Stehouwer CD:
Long-term homocysteine-lowering treatment with folic acid plus pyridoxine is associated with decreased blood pressure but not with improved brachial artery endothelium-depend-ent vasodilation or carotid artery stiffness: a 2-year, rand-omized, placebo-controlled trial. Arterioscler Thromb Vasc Biol
2001, 21:2072-2079.
37. Mangoni AA, Sherwood RA, Swift CG, Jackson SH: Folic acid enhances endothelial function and reduces blood pressure in smokers: a randomized controlled trial. J Intern Med 2002,
252:497-503.
38. Ceriello A, Motz E: Is oxidative stress the pathogenic mecha-nism underlying insulin resistance, diabetes, and cardiovas-cular disease? The common soil hypothesis revisited. Arterioscler Thromb Vasc Biol 2004, 24:816-823.
39. Bjelakovic G, Nikolava D, Lotte L, Simonetti RG, Gluud C: Mortality in randomized trials of antioxidant supplements for primary and secondary prevention: systematic review and meta-anal-ysis. JAMA 2007, 297:842-857.
40. Miller ER III, Pastor-Barriuso R, Dalal D, Riemersma RA, Appel LJ, Guallar E: Meta-analysis: high-dosage vitamin E supplementa-tion may increase all-cause mortality. Ann Intern Med 2005,