R E S E A R C H
Open Access
Comparison of solar power
measurements in alpine areas using a mobile
dual-axis tracking system
Jelenko Karpi´c
1, Ekanki Sharma
1*, Tamer Khatib
2and Wilfried Elmenreich
1FromThe 8th DACH+ Conference on Energy Informatics, Salzburg, Austria. 26-27 September, 2019
*Correspondence: [email protected]
1Alpen-Adria-Universität, Klagenfurt, Austria
Full list of author information is available at the end of the article
Abstract
The rising demand for sustainable energy requires to identify the sites for photovoltaic systems with the best performance. This paper tackles the question of feasibility of photovoltaic power plants at high altitude. A direct comparison between an alpine and an urban area site is conducted in the south of Austria. Two low-cost automatic photovoltaic power measurement devices with dual-axis sun tracking and maximum power point tracking are deployed at two test sites. The system periodically performs a scan over the southern semihemisphere and executes maximum power point
adjustment in order to assess the performance for a given direction. The gathered data shows a higher photovoltaic power yield in the higher altitude test site. Furthermore, the high altitude photovoltaic power as a function of azimuth and elevation angle appears to be not only higher but also more flat than in lower altitudes. This indicates a lower power loss in case of deviation from the optimal solar angles. The results show that even on low-cost hardware a difference in photovoltaic power can be observed, even though in this experiment it amounts to less than 5% increase of peak power in higher altitudes. However, the measured peak powers on the mountain are more stable and therefore closer to a constant level than the heavily fluctuating peak power values at the low altitude site. Additionally, a slight shift in optimal elevation angles between altitudes can be observed, as the optimum angle turns out to be lower on the high altitude site. This angle shift could be caused by snow reflections on the
mountainous test site.
Keywords: Photovoltaic measurement device, Maximum power point tracking, Alpine areas, High altitude, Solar power
Introduction
The transition from high-carbon energy production to green and sustainable renew-able energy production is gaining momentum. This transition has lead to utilization of photovoltaic (PV) for harvesting solar energy. It is easy to install, has low impact on surroundings and it is affordable since the fuel is free of cost (Kahl et al.2019). In gen-eral, solar power generation works better in area with large solar irradiation. Studies have shown the potential in tropical (Farhoodnea et al.2015) and deserted (Kazem et al.
2014) environments. However, output power of PV system does not only depend on the
absorbed power but is also affected by PV module’s temperature. When sun light strikes the PV module, only a part of energy is converted to electricity, but most of the energy just heats up the module (Osman and Alibaba2015). This heat is dissipated to the envi-ronment at a rate which depends on the ambient temperature. Thus, in hot climate, the module becomes hotter and the module voltage starts to decrease at the rate of 0.5% per ◦once the temperature exceeds 25◦. In cold conditions, PV cells operate more efficiently
because the heat generated in the cells is dissipated away faster, which reduces electron movement and increases the bandgap energy of a solar cell. In consequence, the short cir-cuit current is slightly reduced while the open circir-cuit voltage is increased. (Mutungi2013) Thus, PV systems operate best with high solar irradiation in cold environments. Possible regions for such an environment are mountains. In Europe, the Alps are of special inter-est in this region since alpine space often has sufficient infrastructure to reach mountains via roads and to connect PV systems to the power grid and there are densely populated areas close to that region (e.g. Milan, Torino, Munich).
In this paper we present an automated dual-axis measurement and tracking system, which is able to track the maximum power point output of a PV cell at its optimum angle. Furthermore, we report a data set comparing output at a mountain site with a geograph-ically close urban site at much lower altitude. The operation of the system starts with a manual initialization followed by automatic logging and storing the PV output power without human intervention and supervision. The system initiates the sweep configura-tion which periodically turns the two motors, azimuth motor ranging from -90◦(East) to +90◦(West) and altitude motor ranging from 0◦to +90◦. The angular configurations cover a quarter sphere, which results in 3D map of the measured solar power for each sweep cycle. This approach does not depend upon an assumption of the angle with the highest solar irradiance at a given point in time, since the PV panel is moved to cover a sufficient number of possible angles within the southern hemisphere, thus as long as the maximum solar irradiance is within this region, the maximum power will be recorded. The mobile-dual axis solar measurement system presented applies a maximum power point tracking (MPPT) controller for each measurement position, which adjusts the load until voltage and the current correspond to the maximum resulting power. The MPPT method takes a sweep over all possible loads, thus it does not depend an any assumption of the PV characteristic VI curve.
The paper is organized as follows: “Related work” section addresses related work on solar power measurement at high altitude. Physical and economic aspects of solar power harvesting are discussed in “Physical and economic aspects” section. “ Experi-mental setup” section explains the proposed experimental setup and presents the result discussion followed by conclusion in “Results” section.
Related work
increase the output power typically two methods are employed. First method uses sun tracker to track the sun position. This technique tries to maintain angle of incidence as close to 0◦as possible and this can be achieved by tilting the solar panel to continu-ously face the sun. Based on the construction, solar tracking systems are typically of two types, single axis and dual axis system. Single axis tracking mechanism provides 32◦of solar energy absorption using less complex and low cost construction. Whereas, with a slight increase in complexity and installation cost dual axis tracking mechanism pro-vides solar energy absorption efficiency up to 40◦(Mirdanies and Saputra2016). In the second method, solar panel is kept at a fixed position and maximum power is drawn depending on the load profile. As this methods tracks the maximum power point of the solar panels, it is known as maximum power point tracking (MPPT). In order to maxi-mize the generated output power, authors in (Taherbaneh et al.2010) present a method based on two controllers for sun tracking and maximum power point tracking based on fuzzy-based algorithms. The results validated that applying combined method could achieve increased power output up to 78◦of nominal output power. The authors in (Liu and Huang2011) present a fast and low cost analog MPPT method using two voltage approximation lines (VAL) having a simple structure, fast tracking speed and high track-ing efficiency. To demonstrate the effectiveness of the proposed method, simulation and experimental results of an 87◦PV system is presented. (Bose et al.2012) presents a low cost high efficient solar tracking system using ATMEGA 16 microcontroller. The system is equipped with two stepper motors, light sensor and a concave mirror. The proposed method reports an increased power collection efficiency of 65◦. To solve the problem of monitoring PV systems at low cost in remote areas or regions in developing coun-tries, authors in (Fuentes et al.2014) propose an open-source Arduino based data logger. The proposed low cost portable data logger meets the accuracy requirements established by IEC61724 standard related to PV monitoring systems. Authors in (Sugiartha et al.
2018/12) present an automatic sensor based data acquisition (DAQ) systems to provide quick response and accuracy in real-time instead of manual measurement for monitoring the PV systems performance.
In literature, some studies present the solar energy estimation for developing radiation models for complex topographic areas at small spatial scales located away from radiomet-ric stations. Authors in (Bosch et al.2008) propose a calibrated artificial neural networks (ANN) based model to show the viability of proposed technique to provide acceptable values of daily global radiation estimation for a specific region.
In the domain of PV production in mountainous areas, there are several studies which support the potential of PV production in mountainous areas. Authors in (Chitturi et al.
The work reported in this paper covers three aspects of solar power harvesting. Pri-marily we present the dataset comparing output at a mountain with a geographically close to urban site at much lower altitude for validating the potential of PV installations at high altitude locations. To gather this dataset, we present an automated measure-ment system that combines both the approaches i.e. sun angle tracking and maximum power point tracking to achieve more power from solar cell. This proposed system can autonomously track the MPP output of PV cell at its optimal angle and provide synchronous measurements.
Physical and economic aspects
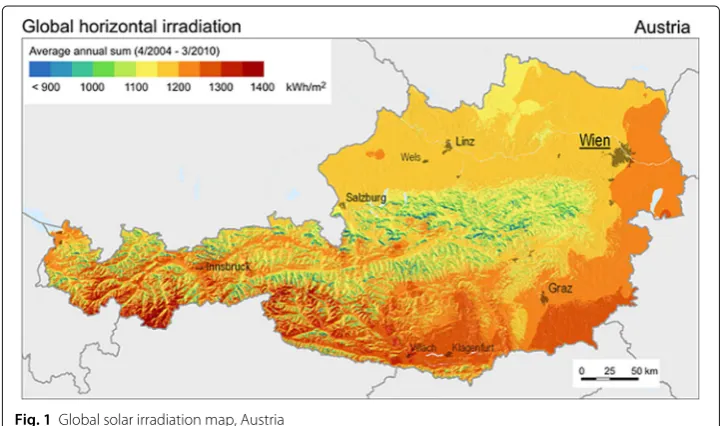
The output of PV systems depends on the amount of solar irradiance striking the PV panel surfaces, which for a particular meteorological and geographical location, fur-ther depends on weafur-ther data such as sunshine hours, relative humidity, maximum and minimum temperatures and cloud coverage (Chitturi et al. 2018). Incoming sun-light striking the earth’s surface is dispersed into an unobstructed direct beam and into diffuse radiation. The sun light that arrives at the surface after getting reflected from the ground and reaches an inclined plane is known as ground-reflected radi-ation. The Global Horizontal Irradiation (GHI) measures this total irradiance on a horizontal surface on Earth. Figure 1 shows the global horizontal irradiation map of Austria1.
Figure 2 shows the topological map of Austria, illustrating the Austrian part of the Alps2. These maps provide a visual presentation of the solar resources and are often used to acquire the ability of solar power generation a particular region. The presented maps present the areas rich in solar resources and show correlation between mountainous areas and high GHI. The GHI evaluation in Austria shows an above average solar power per area in the southern part of the Austrian Alps. A comparison between flat regions of Austria and the alpine area suggests that the lower dispersion at high altitudes leads to a higher horizontal component of irradiation.
In alpine areas, the temperature is negatively correlated with altitude. Although tem-perature inversion effects are possible in such regions as well, they still have a lesser effect on solar power, since they typically occur during night time, hence it is not relevant for solar power harvesting (Chitturi et al.2018).
An economic aspect of solar power harvesting in mountainous areas is the cost of land. Prices of high altitude parcels could be expected to be lower due to their remote loca-tions. Steep slopes and high distances to socio-economic centers make it less attractive for residential building projects.
Albeit there can be benefits of PV systems in alpine areas, there are also potential downsides such as difficult construction process or shading by heavy snow fall and ice accumulation. Estimated losses by snow and ice accumulation are 1.4% to 3.5% of the annual energy production (Ross and Royer1999). Countermeasures to this are higher tilt angles, mounting rectangular modules, manual removal of snow and ice, or passive melting technologies. (Yang2007). Furthermore, the economic value of alpine areas is difficult to determine considering the high non-monetary value of preserving natural environments.
Fig. 1 Global solar irradiation map, Austria
Experimental setup
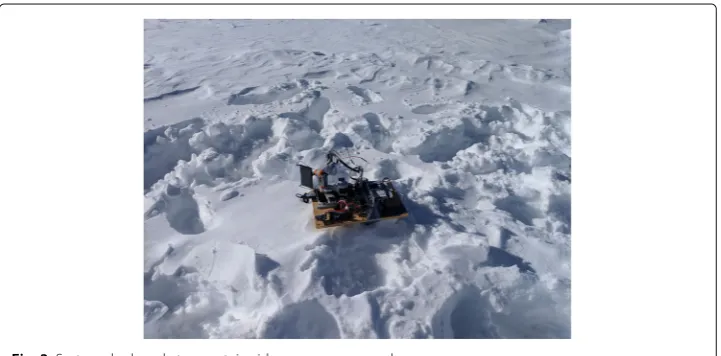
One of the mobile dual-axis solar power measurement and logging system devices is illustrated in Fig.3. The following materials were used per device:
• Lego Mindstorms NXT 2.0: flashed with LeJOS firmware; battery contacts are converted to a 5.5 mm×2.1 mm coaxial port
• Lego Mindstorms Interactive Motor 9842: two units, one for each solar angle • Power bank: 5 V USB 2.0 interface; maximum charge of 15000 mAh
• DC-DC converter: to step up the 5 V from a USB port of a power bank to the 9 V needed for the NXT; 5.5 mm×2.1 mm coaxial plug on one end, and a USB plug on the other end
• Arduino Uno Rev3
• Adafruit MicroSD card breakout board
• PV cell: 7.5 cm×4.5 cm polycrystalline; open-circuit voltage 5 V; closed-circuit current 80 mA
Fig. 3System deployed at mountain side on snowy ground
The system’s control components are the LEGO NXT Brick and an Arduino. The NXT master controls the motors and the Arduino, while the Arduino slave controls the MPPT controller and the logging module. Two LEGO servo motors are powered and controlled over a 9.6 mm non-standard RJ (Registered Jack) with displaced snap-in nose. A unidi-rectional I2C connection is used to send commands from NXT to Arduino. One of the Arduino’sPWMoutput pins serves as the control input to the the MPPT controller. The
PWMsignal is used as the gate control of a transistor, which controls the PV cell’s current as well as its voltage. The full range of possible load impedances is explored to find the maximum power point. A logging module is used by the Arduino for write-only access to the log files on the microSD-card. A schematic overview over the system is depicted in Fig.4.
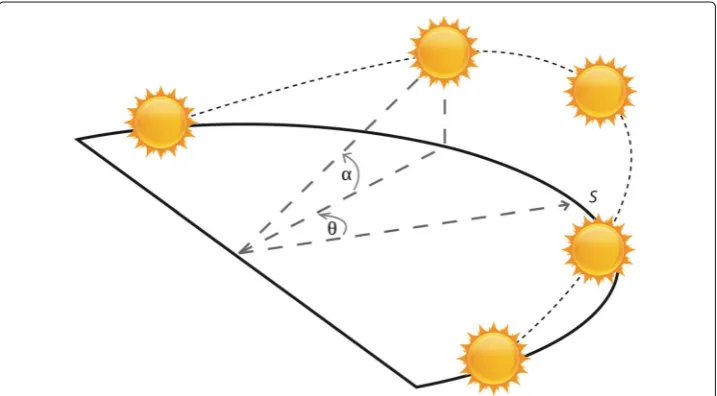
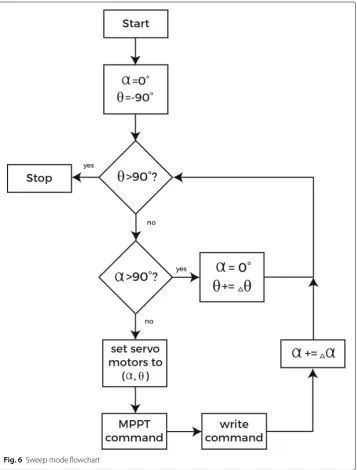
The sweep routine iterates through all possible configurations for the(α,θ) tuple of angles, whereα is the elevation angle andθ is the azimuth angle. The solar angles are measured tangential to the earth’s surface. The elevation is the vertical solar angle and the azimuth is the horizontal solar angle, as is shown in Fig.5. The procedure initializesαwith 0◦, which sets the elevation angle to the lowest orientation. Theθ is initialized as -90◦, so that the sweep starts with an orientation towards East. While the upper limits of both angles are not reached, they are both increased in a double loop. The inner loop iterates
Fig. 5 Solar angles (reproduced with permission from (Khatib and Elmenreich2016))
through all elevation angles until the PV-cell’s surface faces an upward orientation at 90◦. The azimuth angle is then increased and the elevation angle is reset to its initial value. Every time an angle is changed, the NXT commands the Arduino to find the power at the maximum power point for this angular configuration and the current environmental conditions. The MPPT command is followed by a write commend, which contains the current time and the current angles associated with the previously saved power value in its message payload. The algorithm returns to the check forθmax. The sweep routine is called once every 9 min and takes 4 min to complete, which results in 6-7 complete measurement cycles per hour. A flowchart of this algorithm is illustrated in Fig.6.
Results
The experiment was conducted on Thursday, 14 February 2019. The top of the Dobratsch mountain was chosen as the high altitude site, while a street in the residential area of Villach was chosen as the low altitude site. One measurement device was deployed at each test site, where the overlapping time of both devices operating simultaneously is 3 h 17 min. The difference in sea level is more than 1200 m, while the horizontal distance between the test sites is less than 13 km. Table1presents the comparison of experimental conditions and results between the two test sites.
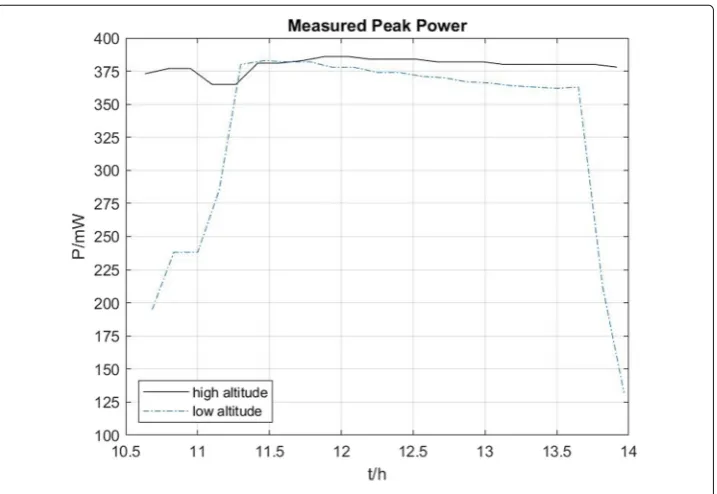
Maximum measured power over time
Fig. 6Sweep mode flowchart
power of the low altitude device sinks from 380 mW to 360 mW, while the high altitude device measured a nearly constant level of 380 mW. After 13:40 the power curve of the low altitude device drops significantly, possibly due to an obstruction by nearby buildings. Within 20 min the power reaches 130 mW, while the power at high altitude appears to stay at its nearly constant level.
Angular power distribution
Table 1Comparison of new experiment conditions and results
day number: 45 Series 1 (high altitude) Series 2 (low altitude)
latitude 46◦3611.04N 46◦3610.08N
longitude 13◦4019.32E 13◦4953.76E
altitude 1770 m 523 m
time 10:38 - 13:55 10:38 - 13:55
ambient temp. -2◦ 1◦
relative humidity 27% 31%
direct illuminance 57000 lx 1503 lx
peak power 378 mW 388 mW
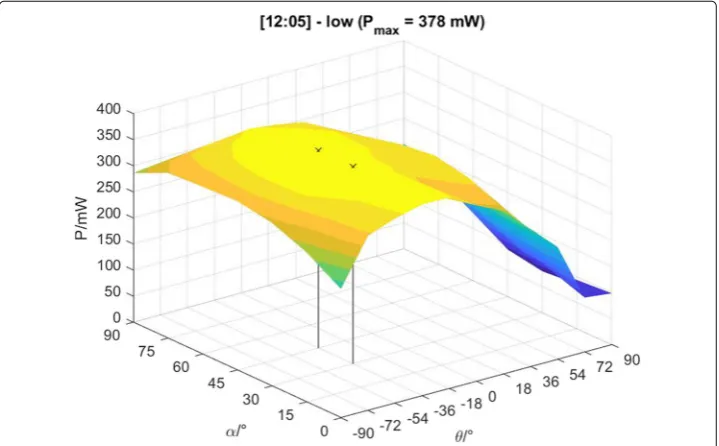
both sites. The surface areas with the lighter colors represent higher measured power values, whereas the darker colors indicate lower measured power values. The illustrated frames were chosen because they include the maximum power values measured during the whole experiment, which are marked by the vertical lines connecting the crosses on the surface with the angle-value grid. The equipotential lines of the high altitude surface surround larger surfaces than in lower altitudes. This indicates that a high power close to the maximum power can be achieved even with a larger angular deviation from the optimal configuration.
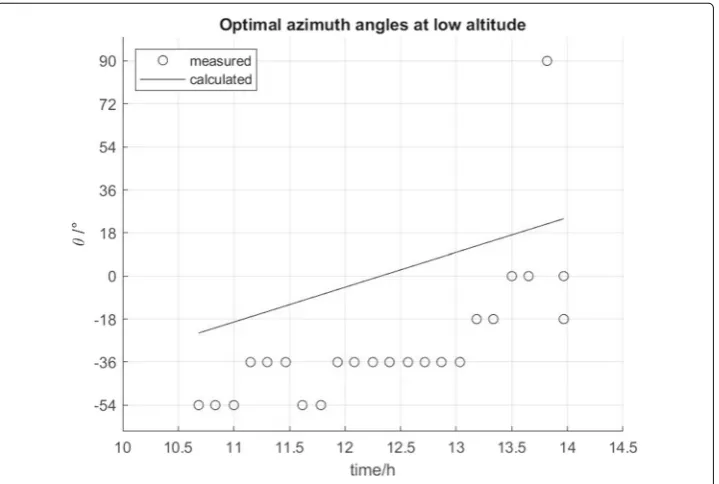
The azimuth angles are similar on both data sets, apart from one outlying sample. Start-ing from a position in the East it rises nearly linearly to the South and eventually to the West, following the calculated sun trajectory. However, the low altitude data shows that the maximum values have an offset of around 36 degrees to the West, which is likely due to initial misalignment of the measurement device. Since each sweep covers he whole hemisphere, this offset error has no influence on the comparison of results. The opti-mal azimuth angles over the experiment duration are depicted in Fig.10and11for their respective altitudes.
Fig. 8Power distribution at high altitude
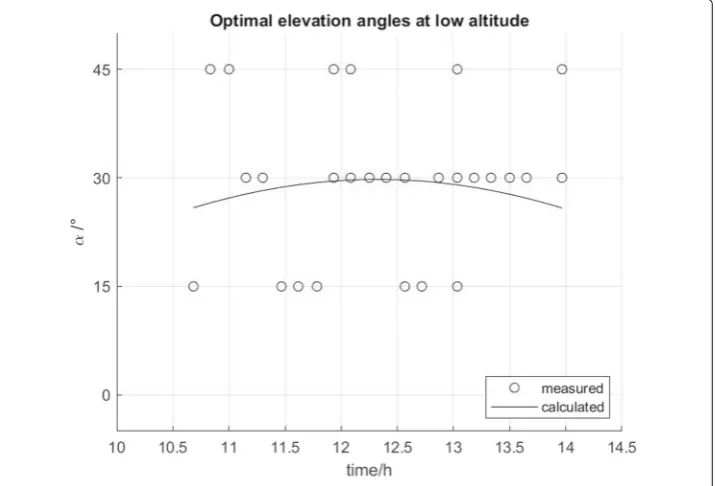
The optimal elevation angles in both altitudes appear to follow the shape of the calcu-lated sun trajectory. However, in the higher altitude the optimal power is achieved with slightly lower angles than calculated. A reason for this could be reflection from the snowy surface on the high measurement site. A comparison of optimal elevation angles is shown in Fig.12and Fig.13for their altitudes respectively.
Conclusion and future work
The gathered data supports the hypothesis of higher energy yield in alpine areas. This experiment was conducted under the premise that significant power differences are found
Fig. 10 Optimal azimuth angles at high altitude
even on low-cost measurement hardware and sparse sampling data. The outcome of the experiment shows that in alpine areas there can be beneficial meteorological conditions for photovoltaic energy harvesting, which increase the energy yield of PV-power plants. Furthermore, the data suggests that in the snowy environment a lower elevation angle is beneficial. The steeper surface orientation can also prevent snow from accumulating on the solar panel.
Fig. 12Optimal elevation angles at high altitude
However, the differences in measured power could be due to measurement uncertainty. Furthermore, it is not possible to derive a comprehensive conclusion by only consid-ering a single experiment. Therefore future experiments need to be conducted over a longer periods of time, with a higher resolution of solar angles, and at more than only two measurement sites, and under various weather conditions. Future experiment setups
must be conducted free from obstructions, possibly by finding elevated places for device deployment.
For enhanced versions of the measurement devices more sensors should be considered, such as for temperature and humidity. An additional sensor for light intensity can detect shading caused by animals or plants. Furthermore, it is necessary to record the entire voltage-current curve for each sample, instead of only saving the peak power, which is at the maximum power point. With a set of voltages and corresponding currents, which in this setup is only available to the MPPT controller, conclusions about the ambient temperature’s effect on the change of output power can be made. In order to isolate the temperature effect, the MPPT controller’s firmware must be adapted to store the entire open-circuit voltage and closed-circuit current for each power sample. The power drops in the recorded data due to obstructions could be explained if images of the sky are taken with each measurement. A low cost camera sensor is a feasible extension for the used measurement system, since the image resolution is not required to be high. Furthermore, a sophisticated method for automatically aligning the distributed measurement devices needs to be implemented to mitigate differences caused by misalignment. Larger PV panels can be chosen to increase the power sample range and resolution.
Acknowledgements
The authors thank Angelika Schauer and Kristina Wogatai for assisting in the logistic setup at the measurement site.
About this supplement
This article has been published as part ofEnergy InformaticsVolume 2 Supplement 1, 2019: Proceedings of the 8th DACH+ Conference on Energy Informatics. The full contents of the supplement are available online athttps:// energyinformatics.springeropen.com/articles/supplements/volume-2-supplement-1
Authors’ contributions
JK constructed the tracking system, made the technical implementation, wrote the embedded software, and contributed to the writing of the paper. ES supervised the topic in an accompanying bachelor thesis, contributed to the writing of the paper. WE contributed the idea for the system, helped in the circuit design and the paper writing! JK, ES and WE were present at the measurement site, we went up a mountain, yeah! TK contributed valuable inputs to the overall idea and the paper. All authors read and approved the final manuscript.
Funding
This work was partially supported by Lakeside Labs via the Smart Microgrid Lab. the publication costs for this supplement were funded by Austrian Federal Ministry for Transport, Innovation and Technology.
Availability of data and materials
The dataset is available athttps://data.mendeley.com/datasets/zjfbbztc6b/
Competing interests
The authors declare that they have no competing interests.
Author details
1Alpen-Adria-Universität, Klagenfurt, Austria.2Department of Energy Engineering and Environment, An-Najah University,
97300 Nablus, Palestine.
References
Bayrakci M, Choi Y, Brownson JRS (2014) Temperature dependent power modeling of photovoltaics. Energy Procedia 57:745–754.https://doi.org/10.1016/j.egypro.2014.10.282. 2013 ISES Solar World Congress
Bosch JL, López G, Batlles FJ (2008) Daily solar irradiation estimation over a mountainous area using artificial neural networks. Renew Energy 33(7):1622–1628.https://doi.org/10.1016/j.renene.2007.09.012
Bose A, Sarkar S, Das S (2012) Helianthus-a low cost high efficient solar tracking system using avr microcontroller. Int J Sci Eng Res 3:1–6
Chitturi SRP, Sharma E, Elmenreich W (2018) Efficiency of photovoltaic systems in mountainous areas. In: 2018 IEEE International Energy Conference (ENERGYCON). IEEE. pp 1–6.https://doi.org/10.1109/ENERGYCON.2018.8398766 Farhoodnea M, Mohamed A, Khatib T, Elmenreich W (2015) Performance evaluation and characterization of a 3-kwp
grid-connected photovoltaic system based on tropical field experimental results: new results and comparative study. Renew Sust Energ Rev 42:1047–1054.https://doi.org/10.1016/j.rser.2014.10.090
Fesharaki VJ, Dehghani M, Fesharaki JJ (2011) The effect of temperature on photovoltaic cell efficiency. In: Proceedings of the 1stInternational Conference on Emerging Trends in Energy Conservation–ETEC. ETECT, Tehran. pp 20–21 Fuentes M, Vivar M, Burgos JM, Aguilera J, Vacas JA (2014) Design of an accurate, low-cost autonomous data logger for pv
system monitoring using arduinoTMthat complies with iec standards. Sol Energy Mater Sol Cells 130:529–543.
https://doi.org/10.1016/j.solmat.2014.08.008
Kahl A, Dujardin J, Lehning M (2019) The bright side of pv production in snow-covered mountains. Proc Natl Acad Sci 116(4):1162–1167.https://doi.org/10.1073/pnas.1720808116.http://arxiv.org/abs/https://www.pnas.org/content/ 116/4/1162.full.pdf
Kazem HA, Khatib T, Sopian K, Elmenreich W (2014) Performance and feasibility assessment of a 1.4 kw roof top grid-connected photovoltaic power system under desertic weather conditions. Energy Build 82:123–129.https://doi. org/10.1016/j.enbuild.2014.06.048
Khatib T., Elmenreich W. (2016) Modeling of Photovoltaic Systems Using Matlab: Simplified Green Codes. John Wiley & Sons, Hoboken, New Jersey
Liu Y, Huang J (2011) A fast and low cost analog maximum power point tracking method for low power photovoltaic systems. Sol Energy 85(11):2771–2780.https://doi.org/10.1016/j.solener.2011.08.019
Mirdanies M, Saputra RP (2016) Dual-axis solar tracking system: A combined astronomical estimation and visual feedback. In: 2016 International Conference on Sustainable Energy Engineering and Application (ICSEEA). IEEE. pp 88–94 Mutungi DM (2013) Degradation of photovoltaics in central Finland: A comparative study of polycrystalline and
heterojunction with intrinsic thin layer technologies. Master’s thesis, University of Jyväskylä, Jyväskylä, Finland Osman MM, Alibaba APDHZ (2015) Comparative studies on integration of photovoltaic in hot and cold climate. Sci Res J
(SCIRJ) 3:48–60
Ross M, Royer J (1999) Photovoltaics in Cold Climates. James & James, London
Sugiartha N, Sugina IM, Putra IDGAT, Indraswara MA, Suryani LID (2018/12) Development of an arduino-based data acquisition device for monitoring solar PV system parameters. In: International Conference on Science and Technology (ICST 2018). Atlantis Press, Paris. pp 995–999.https://doi.org/10.2991/icst-18.2018.201
Taherbaneh M, Rezaie AH, Ghafoorifard H, Rahimi K, Menhaj MB (2010) Maximizing output power of a solar panel via combination of sun tracking and maximum power point tracking by fuzzy controllers. Int J Photoenergy.https://doi. org/10.1155/2010/312580
Yang D. (2007) Performance analysis of a grid connected hybrid photovolatic and wind electricity generation system in cold climate. Master’s thesis, University of Jyväskylä, Jyväskylä, Finland
Publisher’s Note
Springer Nature remains neutral with regard to jurisdictional claims in published maps and institutional affiliations.
Submit your manuscript to a
journal and benefi t from:
7 Convenient online submission
7 Rigorous peer review
7 Immediate publication on acceptance
7 Open access: articles freely available online
7 High visibility within the fi eld
7 Retaining the copyright to your article