R E S E A R C H A R T I C L E
Open Access
An empirical study of the effect that a
computer graphics course has on
visual-spatial abilities
José Saúl González Campos
1*, Jordi Sánchez-Navarro
2and Joan Arnedo-Moreno
1*Correspondence:[email protected] 1Universitat Oberta de Catalunya (UOC), Rambla Poblenou, 156, 08018 Barcelona, Spain Full list of author information is available at the end of the article
Abstract
Visual-spatial abilities are relevant for performing diverse everyday tasks as well as being successful in multiple fields. This work provides empirical evidence supporting the claim that studying a computer graphics course, as commonly offered in computer science or engineering programs, can help develop stronger visual-spatial abilities. This benefit was estimated with the assessment of students’ performances in a standardized test of visual-spatial abilities. This empirical pre-test/post-test study ran for three consecutive semesters and involved six computer graphics groups where students were evaluated with thePurdue Spatial Visualization Testto measure whether the full-semester working on contents heavily related to 2D/3D geometric transformations had a positive effect on students’ visual-spatial intelligence. Results show a statistically significant increase in the average score in the test, which in turn suggests that these cognitive abilities could be reinforced or trained through the normal course workload. Additional findings in this study suggest that a retest gaining factor is present just by taking the test twice, and that there is a weak correlation between students’ level of visual-spatial abilities at the beginning of the course and the final grades obtained at the end of the semester.
Keywords: Visual-spatial abilities, Computer graphics, Education
Introduction
Visual-spatial abilities (VSA) are cognitive skills considered necessary for solving many everyday tasks, such as reading maps, navigating traffic, adjusting to new environments, and packing items in constrained situations. These abilities are also relevant for suc-ceeding in diverse fields of study, particularly in higher education and professional areas related to mathematics, technical graphing, engineering, and science, to name a few (Hartman & Bertoline, 2005; Lohman, 1996; Saorín-Pérez, 2009). There is empirical evidence that supports the idea that VSA can be reinforced or trained by means of inter-ventions (e.g., customized courses or specialized training) designed to improve these skills (Lohman,1996; Gerson et al.,2001; Martín-Dorta et al.,2008; Sorby,2009). Also, there is evidence of improvements in VSA, as a side effect, after taking courses related to engi-neering or sciences (Blade & Watson, 1955; Friess et al.,2016; Kösa & Karaku¸s,2018). However, the extent of these improvements is still difficult to generalize when trying to predict results in more specific contexts. This is because many of the former studies have
approached broad profiles, such as “engineering students” or “science students,” instead of targeting students of more specific fields.
It is in this context that studying the relationship between VSA and learning computer graphics (CG) becomes relevant. In turn, highlighting this would increase the knowledge of these skills in relation to a specific domain. CG is a course commonly offered in com-puter science and other related academic programs, and has a direct relation to students’ VSA through the study of 2D/3D geometric transformations and other topics that involve skills for performing mental manipulations of 2D/3D objects or coordinate systems.
The present work explores the relation between VSA and CG in two directions: one is from CG to VSA (i.e., the potential increase on VSA after studying CG), and the other from VSA to CG (i.e., how the preexisting level of VSA may influence the learning out-come in CG). The first goal was to determine whether there is a strengthening of VSA after learning CG during a full semester. Second goal was to determine whether there is a correlation between the students’ level of VSA at the beginning of the semester and their final achievements in the CG course. To test these correlations, a pre-test/post-test empirical study was designed, which included students enrolled in the CG course, as it is offered at the Autonomous University of Juarez City (UACJ by its Spanish name). The study lasted three consecutive semesters and the instrument of choice to assess the stu-dents’ VSA was thePurdue Spatial Visualization Test(PSVT). Regarding the utilization of the PSVT, a complementary goal of this study was to know whether an increase in the test score could be associated just with the repetition of the test in the pre/post phases. To confirm this, an additional study was conducted with students not studying CG.
This paper is structured in the next sections as follows: In “Visual-spatial abili ties” section, an overview of the cognitive skills focuses on by this study is presented. Alongside, providing their basic definitions and how they have been considered, whether as a fixed or as a trainable expression of intelligence, according to different authors. In “The Purdue spatial visualization test” section, the cognitive test utilized in this study is described in detail, along with its role as a standardized test to measure VSA. In “Teaching computer graphics” section, the body of knowledge of the CG discipline is put into context as well as a brief description of the 2D/3D vertex transformations as a core element in the CG curriculum. Also, the specific context of the CG course being offered at the UACJ is described, discussing its contents, typical profile of the enrolled students, and teaching experiences. The last four sections in this paper present in detail the “Methods”, “Results”, “Discussion”, and “Conclusions” sections.
Visual-spatial abilities
view of the cognitive abilities with a top layer (stratum III) that corresponds to Spearman’s general intelligence; followed by a second layer (stratum II) that includes eight broad fac-tors of ability, with broad visual perception being one of these facfac-tors; and a third layer (stratum I) that includes several narrow factors belonging to the upper elements in the hierarchy.
In the mid-1940s, the concept of a general-purpose intelligence was challenged (Thur-stone, 1947) and spatial visualization was identified as one of seven primary mental abilities. Under this point of view, intelligence is no longer conceived as a monolithic attribute, but a resulting expression of diverse, but equally important abilities applied in different domains. With this newer approach, the visual-spatial intelligence was described as “the ability to perceive the visual world accurately, to perform transformations and modifications upon one’s initial perceptions” (Gardner, 1983). In this case, accord-ing to the vision of multiple intelligences, visual-spatial intelligence was considered as one similar in importance to verbal-linguistic, mathematical-logical, bodily-kinesthetic, musical-rhythmic, intrapersonal, and interpersonal. Visual-spatial intelligence has been defined as “the capacity to perceive the visual world accurately, and/or perform trans-formations and modifications on perceptions, construct mental representations of visual information and use the representation to perform activities” (Zimmerman & Dean, 2011). This definition relies on the concepts of Gardner, (1983); Cary, (2004), and Korn-haber et al., (2004). However, it is reasonable to differentiate between “visual-spatial” and “spatial” intelligence, because spatial intelligence involves other senses in addition to sight (Zimmerman & Dean,2011). According to this point of view, visual-spatial intelligence should be a subset of spatial intelligence. VSA include (among others) spatial reasoning, mental image manipulation, visual patterns recognition and discrimination, thinking in 3D, and constructing 3D shapes from 2D information (Zimmerman & Dean,2011).
This open debate in psychology about the nature of VSA has prevented the standard-ization or development of a universally accepted test to measure these abilities. Several intelligence tests have been developed in the past, but they were intended to measure visual-spatial skills according to a particular conception. For example, as a primary or a secondary expression of intelligence. Also, they differ in the extent of their formal or prac-tical approach. Some contributions have attempted to clarify the areas that need to be tested in the specific case of visual-spatial intelligence. For instance, after a comprehensive survey of factor-analytic studies, and the re-analysis of old and new data sets, (Carroll, 1993) defines five major spatial factors: visualization, speeded rotation, closure speed, closure flexibility, andperceptual speed. In this classification,visualizationrefers to the manipulation of visual patterns without regard to the speed of task solution. Speed is cen-tral to the other factors, such asspeeded rotation, where it is crucial for manipulating visual patterns. Inclosure flexibilityandclosure speed, speed is again vital when identi-fying visual patterns with or without previous pattern knowledge. Finally, inperceptual speed, it is required when finding a known visual pattern. Carroll’s approach is directly aligned with thought of the factor analysis and general intelligence.
is evidence of at least 392 different paper-and-pencil spatial tests (Eliot & Smith,1983), it gives an idea of the popularity of this format.
While it is difficult to claim that a specific test considers all the essential factors involved in measuring VSA, some tests commonly used in education and public or private orga-nizations measure cognitive abilities in general, or VSA in particular. For example, the general oriented tests include: theWoodcock-Johnson IV-Test of Cognitive Abilities(WJ IV), analyzed in Schrank et al., (2016), which tests seven cognitive areas, one of them is “visualization”; theStanford’s Binet V (SB5), described in Roid & Barram, (2004), which examines five cognitive areas, including “visual-spatial processing”; and theDifferential Aptitude Test(DAT), by Wesman, (1952), which tests nine cognitive domains, including “space relations”. The tests that are mainly oriented to VSA are the Mental Cutting Test (MCT), which consists of 25 items that involve mental cuttings of 3D shapes (Gorska & Sorby,2008) the PSVT, developed by Guay et al., (1976), which is described in detail in a later section; and the Vandenberg’s Mental Rotation Test (MRT) (Vandenberg & Kuse, 1978), developed in 1978, which consists of twenty-four problems of 3D rotations. Gorska & Sorby, (2008) conducted an empirical study describing and presenting statistical results after applying these last tests.
VSA are considered important for success in specific domains and professional fields, such as mathematics, engineering, science, and architecture, among others. Due to this importance, research in education has investigated how to improve these cognitive abil-ities. While it is generally accepted that visual-spatial skills can be reinforced or trained, as stated in Lohman & Nichols, (1990), there is still an open debate about the extent of improvement that can be achieved after an intervention. Levels of improvement are usu-ally difficult to quantify because there are some “gaining effects” just in the practice of the tests (for example a retest in a pre-test/post-test study) (Lohman,1996). While it has been observed that results tend to be inconsistent in short-term studies, there is evidence that VSA can be trained in the mid or long term. For example, after comparing VSA results of students in business, social, or humanities against the results of students in engineer-ing or sciences, there is a consistent difference, with the latter students achievengineer-ing higher scores (Lohman,1996).
impact of the manipulation of different types of models, such as 2D sketches, 3D draw-ings, or 3D printed models, on VSA. Finally, in a recent study, Kösa & Karaku¸s, (2018) demonstrated the positive influence that computer-aided design has on the visualization skills of undergraduate students studying on an engineering drawing course.
The Purdue spatial visualization test
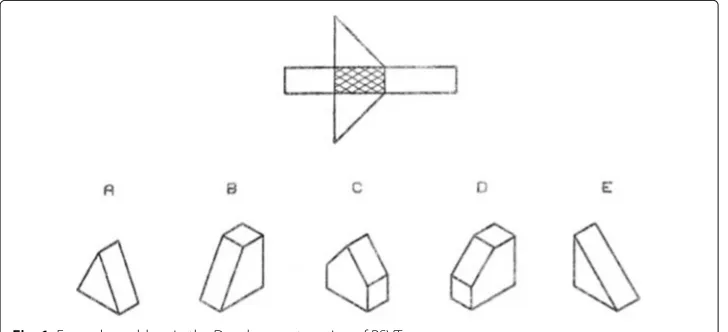
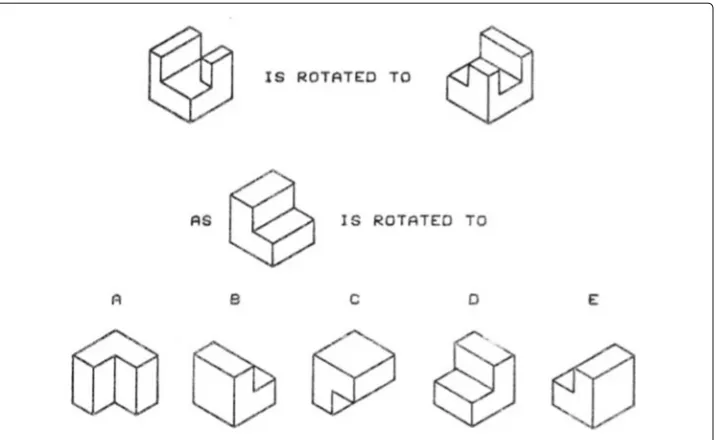
Over the years, different standardized tests have been proposed to measure VSA. One that is commonly utilized is the PSVT, developed by Guay et al., (1976). The PSVT is a multiple-choice test (suitable for 13 years old and over) that includes three sections: devel-opments, rotations, and views. The test, as developed by Guay, is comprised of thirty-six questions, twelve in each subset. It was later extended by adding eighteen new questions to each subset making thirty in total, and their names were updated to PSVT-D, PSVT-R, and PSVT-V, respectively. Examples of the questions in each section are shown in Figs.1, 2, and3.
The PSVT has been widely used in engineering and science disciplines for more than 35 years due to its suitable set of characteristics. A comprehensive study by Maeda, (2013) found at least four advantages. First, the PSVT has desirable properties such as “a relatively strong reliability and/or validity evidence” (at least nine studies providing these parameters are referenced in Maeda’s study). Second, “the ability to solve tasks in the PSVT is related to the ability to solve tasks often found in the Science, Tech-nology, Engineering, and Mathematics (STEM) disciplines” (supporting its preference in these areas). Third, “the PSVT contains items that are difficult enough that they distin-guish STEM students by their level of mental rotation ability”. Fourth, “the PSVT has been frequently cited as the strongest measure of spatial visualization ability of mental rotation that most incorporate the holistic or geltast spatial thinking process and least incorporates the analytic or analogical spatial thinking process.” A stronger validation, using a revised version of the PSVT, found it as a psychometrically sound instrument (Maeda et al., 2013). The revised version, authorized by Guay (the original creator of the PSVT), consisted of the elimination of some errors in the original drawings such as missing lines of a rotated object, as described in more detailed later in this section (see Yue, (2006)).
Fig. 2Example problem in the Rotations section of PSVT
Despite its long age, the PSVT is a pervasive test still utilized in engineering and science schools to measure spatial abilities in students, especially during the initial enrollment phase. In this way, it is possible to design individual support or remedial courses that are intended to improve students’ performance in this cognitive area. It is generally believed that a successful score in this test shows students’ proper abilities and predicts a good per-formance when studying academic programs that involve an extensive use of visualization abilities, as discussed earlier in the “Visual-spatial abilities” section.
However, the PSVT, like every other test, is not perfect. Some studies have pointed out the potential confusion caused for some tested individuals by isometric views, for exam-ple when accidental mistakes or coincidental edges occur in the figures. Branoff, (2000) proposed a redesign of the set of drawings to use trimetric projections of all 3D objects instead of the current isometric projections. A comprehensive study (Yue,2006) of the PSVT’s drawing style of 3D objects, pointed out the missing information of isometric drawings that prevent them from appearing realistic, such as dimensions, colors, lighting, shades, textures, and perspective. This last element, perspective, is considered essential because the projection lines of an isometric view are parallel to each other, which might cause confusion because they are only approximations of a pictorial view of a 3D object. Using these considerations, the redesign of drawings, using modern tools available in today’s CAD software, has been suggested in order to achieve a better assessment of the spatial abilities that the PSVT intends to measure.
Teaching computer graphics
CG is a broad body of knowledge related to the computer generation and manipulation of images and virtual models. As a field of study, it is mainly located at the intersection of computing, mathematics, and physics. Traditionally, CG courses are offered in computer science and other academic programs in higher education (e.g., computer engineering, information technology, software engineering, digital media/arts). As with many other areas of computing, CG has evolved quickly in recent decades. With advances in graphics technology, mainly in hardware for graphics acceleration and the development of algo-rithms that take advantage of this, the subjects studied on a CG course have also been evolved. There have been efforts to define a comprehensive knowledge base for the CG discipline. For example, in The United States, theCurriculum Knowledge Base Group, created by theACM SIGGRAPH Education Committee, aimed “to provide a curricular structure and supporting materials that will aid instructors and institutions working to develop or enhance academic programs in computer graphics” (Alley,2006).
Since the late 90’s, various studies have proposed a range of topics to be considered as the core CG curriculum (Laxer & Orr,2006; Wolfe,2000; Paquette,2005; Roller,2016; ACM/IEEE,2013). Consequently, the modern CG syllabus has been adapted and diversi-fied to match the requirements of the different academic programs on which this course is offered. For example, the CG curriculum in computer science would typically be oriented to mathematical foundations, low-level rendering techniques, algorithms, and hardware architectures and optimization. Software engineering or information technology would be more oriented to higher-level programming frameworks for developing graphics appli-cations. Moreover, academic programs in the arts or digital media would be focused on teaching state-of-the-art commercial graphics software for modeling, rendering and animation.
2D/3D vertex transformations
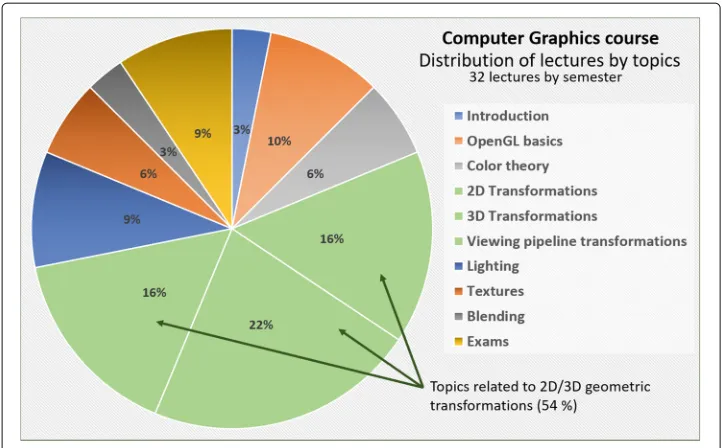
which belongs to theGraphics and Visualizationclassification. Other topics in this group arefundamental concepts,geometric modeling,advanced rendering,computer animation, andvisualization.
Learning 2D/3D vertex transformations is the foundation for understanding advanced topics in CG. A standard methodology, based on the matrix representation of geo-metric transformations such as translations, rotations, and scales, makes it easy to compute complex sequences of such transformations when modeling or rendering 3D environments. The key concept is the abstraction of a real-world visual-spatial per-ception into a mathematical concept relying on matrices and their multiplications. In addition to understanding the mathematical representation and the underlying methodology, studying this subject involves the use of cognitive abilities related to the perception of 2D and 3D environments and the mental manipulation of objects in these virtual spaces. It is intuitively believed that an individual with strong visual-spatial intelligence should learn this topic easier than someone who is weaker in this area.
Computer graphics at the UACJ
The UACJ is a university based in the central-north of Mexico. Juarez is a city located at the border of Mexico and The United States, between Chihuahua and Texas. The UACJ has existed for 44 years and offers engineering, health, liberal arts, and social sci-ences programs. In the academic year 2017–2018, the total student population was about 30,000.
The CG course at the UACJ is part of thecomputer systems engineeringprogram, which has an average size of 850 students, with 240 new students enrolling every semester. Three classrooms of CG are opened each semester, with an average of 15–20 students per class. This course is offered at an intermediate level in the curriculum, which means that typical enrolled students are studying, on average, in their fifth or sixth semester at the university. Students taking CG are distributed in three groups each semester; two are offered in the morning and one in the evening. Students attending the morning groups are mostly full-time students, while in the evening the majority are part-full-time students, most of them working and with family responsibilities. While ages in each category do not vary much, students in the morning are, on average, in their early twenties, while students in the evening are in their mid-late twenties.
Fig. 4Distribution of topics by lectures in the Computer Graphics course
The topic of 2D/3D vertex transformations is probably one of the more difficult for students taking this course. Evidence for this is found in exam results, reviewing home-work, or solving exercises in the classroom. Moreover, this is also usually expressed by the students themselves during the semester. Often, students are aware that they have issues trying to “imagine” geometric transformations in abstract spaces. From our fifteen years of experience in teaching CG at the UACJ, we have detected that some students have better spatial skills than others. Those students who have difficulty in performing spatial abstractions or 3D transformations in their minds are at a higher risk of fail-ing or droppfail-ing the course. They struggle to understand complex sequences of 2D/3D vertex transformations because it requires strong VSA. Unfortunately, there is no short-age of students in this situation every semester, and they usually require additional help to understand these concepts and to motivate themselves to succeed on the CG course. The spatial ability is a relevant mental capacity that should be considered when designing instructional experiences and assessments that intend to be effective in the CG profession, particularly in educational aspects (Hartman & Bertoline,2005).
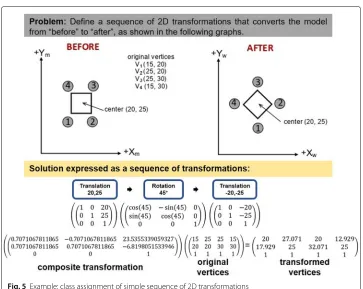
There is a large workload on the CG course that demands an extensive use of stu-dents’ VSA. For example, there are exercises that involve spatial reasoning when imaging a sequence of geometric transformations to propose a solution. These exercises go from 2D to 3D, and from simple to complex. Figures5and6show typical exercises in 2D and 3D that students solve as class assignments.
Fig. 5Example: class assignment of simple sequence of 2D transformations
exercises, going from simple 2D to complex 3D transformations, increases or effectively trains the students’ VSA.
Methods
This section is organized into three subsections: “Participants”, “Materials”, and “Design and procedure”. In “Participants” subsection, participants are described in detail and some
demographics are presented, which includes both the CG and the non-CG students. Also, the sampling strategy is clarified. In “Materials” subsection, the PSVT is described as the research tool utilized to measure VSA. Finally, in “Design and procedure”subsection, three research goals are defined, as well as the strategy and statistical analysis to address each goal. A brief justification about the selection of the PSVT is also discussed.
Participants
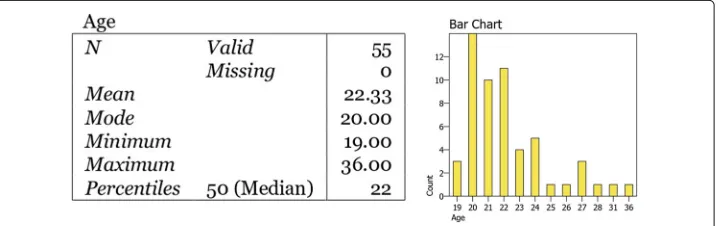
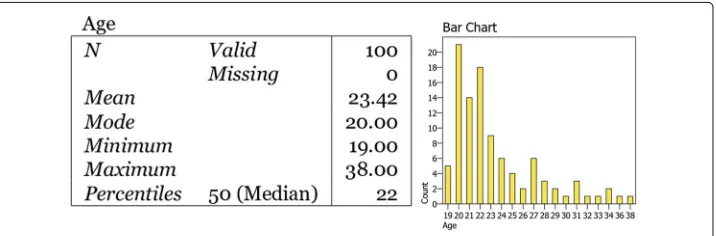
Participants in this study were students enrolled on the CG course at the UACJ offered during Fall-2017, Spring-2018, and Fall-2018. They belonged to either a morning class (11:00–13:00 group) or an evening class (20:00–22:00 group). Due to the relatively small quantity of students enrolled in CG each semester (typically 15–20 per group), it was decided to include all students who voluntarily wanted to participate and who fulfilled one basic condition: being a “first-time” CG student (i.e., not a repeating student in this course). Therefore, the sampling strategy in this study does not imply a selection method more than the aforementioned condition. The termsamplein this study only denotes that participant students are a small fraction of all students that have taken CG at the UACJ at some point. This approach facilitated a broad representation of students’ conditions (e.g., single, married, male, female, working, young, mature, brilliant, average), despite having so few participants per semester. A total of 100 students were sampled, 55 from morning groups and 45 from evening groups. Demographics of participants (regarding age, gender, and VSA self-perception) are summarized in the following charts and tables.
The age of students was in a range from 19 to 38, with a median of 22, and with 20 as the most frequent age. These figures were consistent across the morning and the evening groups, with just a small difference in the average age, it was 22.33 in the morning and 24.76 in the evening. These age statistics are shown in Figs.7,8and9.
Regarding gender, the global population of students enrolled in the program of com-puter systemsis, in general, heavily biased to male. This situation was consistent with the gender statistics of the sampled CG students in this study. In the morning groups, the ratio of females/males was 14/41, while it was 5/40 in the evening groups. These figures give a ratio of 19/81 in the total sampled students, as shown in Figs.10,11and12.
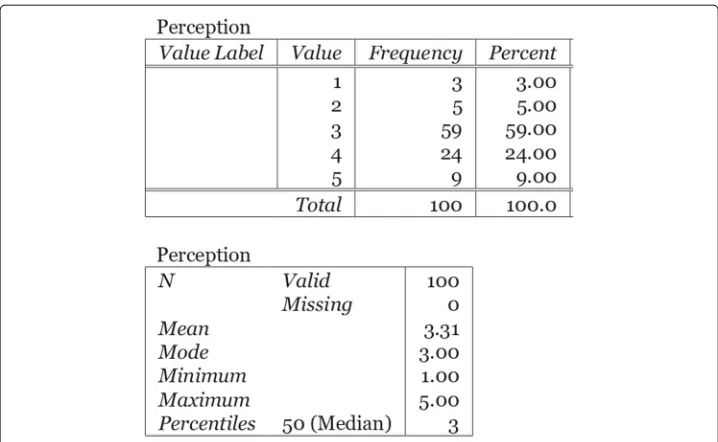
Two questions were included in the demographics section of the test to reveal a gen-eral background for each student’s level of visual/spatial intelligence. The first question was about previous experiences using any commercial package of 3D design or whether they had considerable practice playing videogames. The second question was about their self-perception of how easy or difficult they found the task of mental manipulation
Fig. 8Distribution of age in the sampled students from evening groups
of 3D objects or their ability to remain oriented in 3D (real or virtual) environments. Answers for the second question were given in a scale from 1 to 5, being 1=“Too difficult,” 2=“Difficult,” 3=“Regular,” 4=“Easy,” and 5=“Too easy.”
Statistics for these two questions showed that 92% of the sampled students said that they already experienced activities well known for promoting visual/spatial intelligence. Also, 59% of students perceived their own confidence in their visual/spatial abilities as “regular” and 24% as “easy,” while a minority of students chose the rest of the options (“too difficult,” “difficult,” or “too easy”). These statistics are presented in Figs.13and14.
A complementary test was performed on 25 students from the same computer sys-tems engineeringprogram, but not related to the CG course. These students were invited and gathered from other classes (14 from computer theoryand 11 from intelligent sys-tems), with the only constraint being that they had not yet taken CG. Their average age was 23.4 years, the median, and the most frequent age was 23 years. The gender ratio was 20% females to 80% males; 92% reported previous experiences in activities demand-ing visual/spatial intelligence. Finally, 60% perceived their own visual/spatial abilities as “regular,” 32% as “easy,” and 8% as “difficult.”
Materials
The PSVT was the tool utilized to measure the students’ VSA. It was acquired through the Educational Testing Service (ETS) organization, and it included four test booklets. The first contained a mixture of twelve problems in each category (“developments,” “rotations,” and “views”), totaling thirty-six problems. The second, third, and fourth booklets included thirty problems each in just one category. A multimedia presentation was prepared from the digital format acquired, assigning one slide per question. A recommended time to
Fig. 10 Gender distribution in the sampled students from morning groups
answer each booklet was 20 min, which corresponds to 40 s per problem. Therefore, each slide was set to a fixed time of 40 s in a self-paced animation. Participants were tested only with “rotations” and “views” (third and fourth booklet) because these areas were the most closely related to the contents of the CG course. Complementing the PSVT multimedia presentation, was a paper-based answer sheet (bubble-style) that included a small “demographics” section.
Design and procedure
This study was developed at the UACJ during three consecutive semesters (Fall 2017, Spring 2018, and Fall 2018). At the beginning of the semester, all students enrolled on the CG course were informed about the purpose of the study and invited to participate as volunteers. Participants were not provided with any special treatment or educational strategies. They took the entire semester of CG in standard conditions, the same as every other student enrolled in this course.
This study was designed to test three different cases, described as follows:
• Case 1: Testing whether VSA increased after taking a full semester of CG. The statistical test chosen for this case was a paired t-test. It was applied to the scores obtained by students in the PSVT in the pre/post phases. The same testing was applied to three data sets. First, to the total number of sampled CG students. Then, just to test consistency, only to the morning groups, and only to the evening groups. • Case 2: Testing whether a preexisting level of VSA at the beginning of the semester
had some association with performance on the CG course. In this case, a bivariate correlation was applied in two different data sets. First, to measure the correlation of the scores of students in the PSVT pre-test phase and their final grades in CG; and second, to correlate the same PSVT scores but now with the students’ results in the midterm exam, which is a comprehensive evaluation of the topic of 2D/3D geometric transformations.
• Case 3: Testing whether the PSVT scores increased after presenting this test twice. This testing was similar to Case 1 but directed to non-CG students and with the
Fig. 12 Gender distribution in the total sampled students
pre/post phases much closer in time. The scores obtained by non-CG students in the PSVT during the pre/post phases were analyzed with a paired t-test. The purpose of this case was to estimate the effect of repetition (when a student takes the test twice) on improving the PSVT score. In this case, the pre-test was conducted in the third week of the semester, and the post-test five weeks later.
In Case 1, the pre-test was conducted in the second week and the post-test close to the end of the semester, in the fifteenth week. The same set of students were tested in both phases. If a student, for any reason, was not able take the second phase, their data was removed from the study. Case 2 utilized the same data gathered in the Case 1 pre-test phase but it was correlated with the scores of the mid-term exam and with the final CG grades (two different analyses for Case 2).
Case 3 was a complementary, but relevant, test for considering the possibility that an increase in the PSVT scores by CG students could be influenced more by the repeti-tion of the test than by the full semester studying CG. If the repetirepeti-tion of the test for the non-CG students did not increase their score, it would provide more support to the theory that the CG course itself is the relevant factor for any VSA improvement in CG students.
The PSVT was chosen as the research tool for this study due to its general advantages, described earlier in “The Purdue spatial visualization test” section. Certainly, other stan-dardized tools such as the MCT or MRT could also be applied. These tests have similar characteristics and reliability, according to Gorska & Sorby, (2008), even though there is still some debate about the specific cognitive ability each test is really measuring (e.g. spatial visualization, spatial orientation) (Branoff,2000). However, all these options are still mainly oriented towards educational research, which is the case of this study. In con-trast, other tests are more oriented towards use by professionals in psychology as part of a study or construction of psychological profiles. Additionally, the choice of the PSVT was favored by the type of problems included in its “rotations” and “views” sections, which are similar in nature to the contents of the CG course in this study. Other tests, on the other hand, prioritize less relevant problems, like those related to solve “folding” tasks on 3D models.
Fig. 14 Students’ own perception of visual/spatial abilities
The application of the PSVT in this study was administered in the following con-ditions. Students answered 60 questions in total; the first 30 were related to rota-tions, the other 30 related to views. A self-paced multimedia presentation was run, where each slide was available for 40 s, totaling 20 min for each set of questions (rotations and views). Under these conditions, participants took the test in a syn-chronized manner (i.e., the whole group was answering the same question at the same time). These conditions were similar to those in the traditional paper-based PSVT. The difference in this case was that participants were only provided with the answer sheet rather than the printed booklet. These conditions limited the possibil-ity of leaving a question and returning to it later or giving the test a final review according to the remaining time. Despite these minor constraints, the authors of this study believe that these testing conditions correctly reflected the essence of measuring participants’ VSA.
Concerning ethical considerations, all participants provided their informed consent after receiving detailed information regarding the study conditions, such as purpose, methods, any harmful effects (there were none), confidentiality of data, anonymity, vol-untary participation, and their right to withdraw at any time. This study did not set an educational intervention of any kind. At no stage of the study were participant students treated with any learning strategy or placed in conditions different to non-participant students. Participation consisted of taking the PSVT twice and completing a short demo-graphics section. The results obtained in the PSVT (scores in the pre/post phases) were provided to all participants (individually).
Results
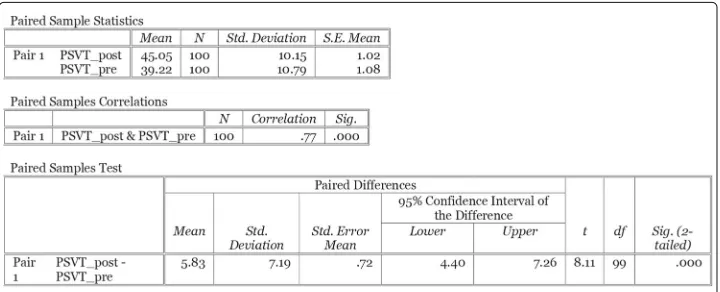
The first analysis corresponds to the pre-test/post-test study described in Case 1. The first paired t-test was performed on all participants. This dataset included the morn-ing and the evenmorn-ing groups of CG. The sample sizenwas 100 participants, and the null hypothesis assumed that the true mean differences between the paired samples was zero. This means that the average score in the PSVT remained without change before and after a full-semester of work on CG topics. As shown in Fig.15, the average score in the PSVT increased from 39.22 to 45.05. This result showed a significant average difference between the pre-test and post-test phases of the experiment witht100=8.11 andρ <.0009.
Figure16shows the histogram of the dependent variable (the mean differences) that supports the assumption about its normal distribution.
Additionally, to complement Case 1, Figs.17and18show consistent results when con-sidering participants only in either the morning or the evening groups. The average score of the participants in the morning groups increased from 37.42 to 43.42, showing a sig-nificant difference witht55=6.28 andρ <.0009. On the other hand, the average score of the participants in the evening groups increased from 41.42 to 47.04 and had a significant difference witht55=5.11 andρ <.0009.
Regarding Case 2, a statistical correlation was tested in two data sets. Firstly, the cor-relation between the initial score in the PSVT (the pre-test phase) and the final grade obtained in the course of CG was examined. Secondly, was the correlation between the initial score in the PSVT and the midterm exam, which mainly evaluates topics related to 2D/3D transformations. These results are shown in Figs.19and20.
In both cases, a weak correlation between pre-test PSVT scores and the grading of par-ticipants after taking the CG course was found. These results are interpreted in detail in the “Discussion” section.
Finally, a paired t-test was developed for students not undertaking the CG course, which corresponds to Case 3. Figure21shows the results of this paired t-test, which involved a pre-test and post-test of PSVT on 25 non-CG students.
This test shows an increased average score from 39.0 to 42.2 and has a significant dif-ference witht25 = 3.30 andρ < .003. A discussion of this finding is provided in the following section.
Discussion
Findings in this study can be described in three parts. First, empirical evidence supports the idea that the CG course influences VSA, as measured by the PSVT. This finding
was reached after obtaining a strong measure in the paired t-test which supported the alternative hypothesis that the mean difference between the pre-test and post-test phases was statistically significant. This finding confirms the expected results, considering that previous works of literature indicated that VSA could be reinforced or trained through specially designed cognitive exercises (Crown,2001; Melgosa Pedrosa et al.,2015; Friess et al.,2016; Gerson et al.,2001; Martín-Dorta et al.,2008; Sorby,2009). In this study, despite the fact that students did not perform or participate in any specially designed activity, it seems that just the regular course work in CG was enough to increase their performance on the PSVT.
A second finding relates to the weak correlation between the pre-existent level in VSA and CG course achievements. Two variables were used for measuring this correlation: the midterm exam, which evaluated most of the students’ 2D/3D geometric transforma-tion knowledge; and the final grade, which indicated a holistic evaluatransforma-tion of all course topics. Finding this weak correlation was unexpected due to the apparently logical rela-tion between having strong VSA and succeeding in a course demanding these skills. The authors of this study believe that the weak correlation can be explained in terms of the diverse factors involved in a student’s overall performance. For example, one student can have great VSA but, at the same time, lack a genuine interest in or motivation for the course, or have personal circumstances (e.g., family, work, health issues, other activities) that distract and prevent them from succeeding. Also, it should be considered that utilized variables (scores in midterm exam and final grade) do not perfectly isolate those CG top-ics with a stronger influence on VSA; a mixture of other toptop-ics was also evaluated, which could bias the correlation measurement (i.e., poor performance in other topics such as color theory, textures or lighting, that are not related to contents promoting VSA could alter the expected correlation between VSA and CG performance).
The third finding in this study is that the results show a statistically significant increase in average scores for non-CG students. However, in this case, the scores increased less than those of CG students. As it can be seen after comparing Figs.21and15, the average improvement was about half of that obtained by the CG students; it is 3.2 compared to 5.83. Moreover, a comparison against the increase in all categories of CG groups seems consistent; it was 5.83, 6.00, and 5.62, for total groups, morning groups, and evening
Fig. 17 Paired t-Test (2-tailed) for morning groups of Computer Graphics
groups, respectively. The authors of this study believe that the average increase in non-CG students could be due to the “retest” effect, which is associated with cognitive tests in general, and well documented in the case of VSA. Lohman, (1996) describes this effect (“retest gaining”) as typically having a standard deviation from .2 to 1.2, and larger for simpler tests, shorter re-test intervals, and when some feedback is provided to partici-pants. In the present study, as explained before, non-CG students solved the PSVT at the beginning of the semester, and repeated it five weeks later, which offers an explanation for these results through the relatively short time between test applications.
The findings of this study have to be seen in light of some limitations. First, the results apply only to participants taking the CG course offered at the UACJ. It should be nec-essary to extend this study to similar CG courses at other institutions to draw more general conclusions. Second, the only version of the PSVT that was available for pub-lic usage (through ETS) was the original version, which has some issues with the quality of drawings because they are made with the classical hand drawing techniques of the ’70s (not computer generated). This situation may cause confusion in the interpretation of some of the drawings and may lead to some mistakes in the answers. However, it is
Fig. 19 Correlation between pre-test scores and final course grade
believed that this factor may be minimal. Third, regarding the testing conditions, even though the PSVT can reasonably demonstrate a level of VSA (Maeda,2013), there are diverse “uncontrolled” situations regarding the personal conditions of each student when taking the test (e.g., tired, sleepy, not concentrating, guessing answers) which in turn are potential factors that can bias the results.
Conclusions and future work
This study followed up the entrance and exit conditions of students regarding their level of VSA and their performance in the CG course offered at the UACJ. The statistical analyses developed in this work support the claim that studying CG has an impact on VSA, making them stronger for most of the students. However, questions about the relation between VSA and succeeding on the CG course still remain open due to the weak correlation found. There can be many variables that determine the student’s performance in the CG course, and it becomes difficult to separate them when drawing conclusions based only in the PSVT results. Probably, to minimize this situation, a stricter selection of participants could be implemented that gave preference to those individuals with a profile similar to an “ideal student” (e.g., full-time student, stable personal and academic environment, average or above academic records). It could lead to a loss of diversity in the sampled participants, but to a gain in confidence in the measured correlation as a result of discarding many of the common factors that prevent students from succeeding in any course.
It is necessary to develop additional studies that deeply explore the findings obtained in the current work. Having the current increase in the VSA as measured with the PSVT as a reference, what would happen if special learning strategies, other than the already included in the CG workload, are designed and applied? Innovative learning strategies in teaching CG can be experimented. For example, could the use of video games (that favor an intensive 2D/3D transformations practice) increase the training of VSA even more? Would these innovations provide better preparation to CG stu-dents for success on the course? These strategies should be administered to selected
Fig. 21 Paired t-Test (2-tailed) for groups not related to Computer Graphics
students, ideally, in controlled testing, with stricter activity monitoring and follow-ing up to measure their real effect. To better interpret the interactions and synergy among VSA, learning strategies, and student performance, it is necessary to isolate, as much as possible, the benefit of the implemented strategies from other factors that are intrinsically existent in the personal context of students that might undermine their learning outcomes.
Abbreviations
CG: Computer graphics; DAT: Differential aptitude test; MCT: Mental cutting test; MRT: Mental rotation test; PSVT: Purdue spatial visualization test
Acknowledgments Not applicable
Authors’ contributions
JSGC designed and developed the study as part of his doctoral research. JAM and JSN (director and co-director, respectively), verified the analytical methods and supervised the findings of this work. All authors discussed the results and contributed to the final manuscript.
Funding Not applicable
Availability of data and materials
The datasets used and/or analyzed during the current study are available from the corresponding author on reasonable request.
Competing interests
The authors declare that they have no competing interests.
Author details
1Universitat Oberta de Catalunya (UOC), Rambla Poblenou, 156, 08018 Barcelona, Spain.2Universitat Oberta de
Catalunya (UOC), Av. Tibidabo, 39-43, 08035 Barcelona, Spain.
Received: 10 April 2019 Accepted: 10 September 2019
References
ACM/IEEE (2013).Computer Science Curricula 2013: Curriculum Guidelines for Undergraduate Degree Programs in Computer Science, (p. 518). New York: ACM.http://dx.doi.org/10.1145/2534860.
Alley, T. (2006). Computer Graphics Knowledge Base Report.https://education.siggraph.org/resources/knowledge-base/ report. Online; Accessed 26 June 2019.
Blade, M.F., & Watson, W.S. (1955). Increase in spatial visualization test scores during engineering study.Psychological Monographs: General and Applied,69(12), 1–13.https://doi.org/10.1037/h0093697.
Branoff, T.J. (2000). Spatial visualization measurement: A modification of the purdue spatial visualization test-visualization of rotations.Engineering Design Graphics Journal,64(2), 14–22.
Cary, R. (2004).Multiple Intelligences Reconsidered. New York: Peter Lang.https://www.peterlang.com/view/title/58269. Crown, S.W. (2001). Improving visualization skills of engineering graphics students using simple javascript web based
games.Journal of Engineering Education,90(3), 347–355.https://doi.org/10.1002/j.2168-9830.2001.tb00613.x.https:// onlinelibrary.wiley.com/doi/pdf/10.1002/j.2168-9830.2001.tb00613.x.
Dorval, M., & Pépin, M. (1986). Effect of playing a video game on a measure of spatial visualization.Perceptual and Motor Skills,62(1), 159–162.https://doi.org/10.2466/pms.1986.62.1.159.
Eliot, J., & Smith, I.M. (1983).An International Directory of Spatial Tests. Berks: Nfer-Nelson.
Friess, A., Martin, E.L., Esparragoza, I.E., Lawanto, O. (2016). Improvements in student spatial visualization in an introductory engineering graphics course using open-ended design projects supported by 3-d printed
manipulatives, InASEE Annual Conference and Exposition, Conference Proceedings, vol. 2016-June.https://www.scopus. com/inward/record.uri?eid=2-s2.0-84983339645&partnerID=40&md5=f8339ff2d9999a2630b05062b6696447. Gardner, H. (1983).Frames of Mind : the Theory of Multiple Intelligences. New York: Basic Books.
Gerson, H.B., Sorby, S.A., Wysocki, A., Baartmans, B.J. (2001). The development and assessment of multimedia software for improving 3-d spatial visualization skills.Computer Applications in Engineering Education,9(2), 105–113.
Gorska, R., & Sorby, S. (2008). Testing instruments for the assessment of 3d spatial skills, In2008 Annual Conference & Exposition.https://peer.asee.org/4411. Pittsburgh: ASEE Conferences.
Guay, R., Purdue Research, F., Educational Testing, S., Test, C. (1976).Purdue Spatial Visualization Test. West Layfette, Ind.: Purdue University.
Hartman, N.W., & Bertoline, G.R. (2005). Spatial abilities and virtual technologies: examining the computer graphics learning environment, InNinth International Conference on Information Visualisation (IV’05).https://doi.org/10.1109/IV. 2005.120(pp. 992–997).
Katsioloudis, P., Jovanovic, V., Jones, M. (2014). A comparative analysis of spatial visualization ability and drafting models for industrial and technology education students.Journal of Technology Education,26(1), 88–101.
Kornhaber, M.L., Fierros, E.G., Veenema, S.A. (2004).Multiple Intelligences: Best Ideas from Research and Practice. Boston: Pearson/Allyn and Bacon.https://books.google.com.mx/books?id=ZT8mAQAAIAAJ.
Kösa, T., & Karaku¸s, F. (2018). The effects of computer-aided design software on engineering students’ spatial visualisation skills.European Journal of Engineering Education,43(2), 296–308.
Laxer, C., & Orr, J. (2006). A knowledge base for the emerging discipline of computer graphics”: Report of the siggraph education committee curriculum working group, InWorkshop on Computer Graphics Education (CGE’06). New York: ACM.
Lohman, D.F. (1996). Spatial Ability and g. In I. Dennis & P. Tapsfield (Eds.),Human Abilities : Their Nature and Measurement, Chapter 6(pp. 97–115). London: Lawrence Erlbaum Associates, Inc., Publishers.
Lohman, D.F., & Nichols, P.D. (1990). Training spatial abilities: Effects of practice on rotation and synthesis tasks.Learning and Individual Differences,2(1), 67–93.https://doi.org/10.1016/1041-6080(90)90017-B.
Maeda, Y., & Yoon, S.Y. (2013). A meta-analysis on gender differences in mental rotation ability measured by the purdue spatial visualization tests: Visualization of rotations (psvt: R).Educational Psychology Review,25(1), 69–94.
Maeda, Y., Yoon, S.Y., Kim-Kang, G., Imbrie, P. (2013). Psychometric properties of the revised psvt: R for measuring first year engineering students’ spatial ability.International Journal of Engineering Education,29(3), 763–776.
Martín-Dorta, N., Saorín, J.L., Contero, M. (2008). Development of a fast remedial course to improve the spatial abilities of engineering students.Journal of Engineering Education,97(4), 505–513.
Melgosa Pedrosa, C., Ramos Barbero, B., Baños García, M.E. (2015). Interactive learning management system to develop spatial visualization abilities.Computer Applications in Engineering Education,23(2), 203–216.https://doi.org/10.1002/ cae.21590.https://onlinelibrary.wiley.com/doi/pdf/10.1002/cae.21590.
Miller, C. (1992). Enhancing visual literacy of engineering students through the use of real and computer generated models.Engineering Design Graphics Journal,56(1), 27–38.
Paquette, E. (2005). Computer graphics education in different curricula: analysis and proposal for courses.Computers and Graphics,29(2), 245–255.https://doi.org/10.1016/j.cag.2004.12.011.
Roid, G.H., & Barram, R.A. (2004).Essentials of Stanford-Binet Intelligence Scales (SB5) Assessment. Hoboken, N.J.: Wiley. Roller, M.A. (2016).A consensus on the definition and knowledge base for computer graphics. West Lafayette: Purdue
University. Dissertation.
Saorín-Pérez, J.L., Navarro-Trujillo, R.E., Martín-Dorta, N., Martín-Gutiérrez, J., Contero, M. (2009). La capacidad espacial y su relación con la ingeniería. (cover story).DYNA - Ingeniería e Industria,84(9), 721–732.
Schrank, F.A., Decker, S.L., Garruto, J.M. (2016).Essentials of WJ IV Cognitive Abilities Assessment. Hoboken: Wiley. Sorby, S.A. (2005). Assessment of a “new and improved” course for the development of 3-d spatial skills.Engineering
Design Graphics Journal,69(3), 6–13.
Sorby, S.A. (2009). Educational research in developing 3-d spatial skills for engineering students.International Journal of Science Education,31(3), 459–480.https://doi.org/10.1080/09500690802595839.
Spearman, C. (1923).The Nature of ’intelligence’ and the Principles of Cognition / by C. Spearman. London: Macmillan. Thurstone, L.L. (1947).Multiple-factor Analysis; a Development and Expansion of The Vectors of the Mind, (p. 535). Chicago, Ill:
The University of Chicago Press.
Vandenberg, S.G., & Kuse, A.R. (1978). Mental rotations, a group test of three-dimensional spatial visualization.Perceptual and Motor Skills,47(2), 599–604.https://doi.org/10.2466/pms.1978.47.2.599.
Wesman, A.G. (1952). The differential aptitude tests.The Personnel and Guidance Journal,31(3), 167–170.https://doi.org/ 10.1002/j.2164-4918.1952.tb01429.x.
Wolfe, R. (2000). Bringing the introductory computer graphics course into the 21st century.Computers and Graphics,24(1), 151–155.https://doi.org/10.1016/S0097-8493(99)00145-4.
Yue, J. (2006). Spatial visualization by isometric drawing, InProceedings of the 2006 IJMEINTERTECH Conference, Union, New Jersey. Northridge: IJME.
Zimmerman, A.E., & Dean, R.S. (2011).Visual-Spatial Intelligence, (pp. 1548–1549). Boston, MA: Springer.https://doi.org/10. 1007/978-0-387-79061-9_3041.https://doi.org/10.1007/978-0-387-79061-9_3041.
Publisher’s Note