R E S E A R C H
Open Access
Impact of tuberculosis on mortality among
HIV-infected patients receiving antiretroviral
therapy in Uganda: a prospective cohort analysis
Rong Chu
1,2, Edward J Mills
1,3, Joseph Beyene
1, Eleanor Pullenayegum
1,2, Celestin Bakanda
4, Jean B Nachega
5,6,
P J Devereaux
1,7and Lehana Thabane
1,2*Abstract
Background:Tuberculosis (TB) disease affects survival among HIV co-infected patients on antiretroviral therapy (ART). Yet, the magnitude of TB disease on mortality is poorly understood.
Methods:Using a prospective cohort of 22,477 adult patients who initiated ART between August 2000 and June 2009 in Uganda, we assessed the effect of active pulmonary TB disease at the initiation of ART on all-cause
mortality using a Cox proportional hazards model. Propensity score (PS) matching was used to control for potential confounding. Stratification and covariate adjustment for PS and not PS-based multivariable Cox models were also performed.
Results:A total of 1,609 (7.52%) patients had active pulmonary TB at the start of ART. TB patients had higher proportions of being male, suffering from AIDS-defining illnesses, having World Health Organization (WHO) disease stage III or IV, and having lower CD4 cell counts at baseline (p < 0.001). The percentages of death during follow-up were 10.47% and 6.38% for patients with and without TB, respectively. The hazard ratio (HR) for mortality
comparing TB to non-TB patients using 1,686 PS-matched pairs was 1.37 (95% confidence interval [CI]: 1.08–1.75), less marked than the crude estimate (HR = 1.74, 95% CI: 1.49–2.04). The other PS-based methods and not PS-based multivariable Cox model produced similar results.
Conclusions:After controlling for important confounding variables, HIV patients who had TB at the initiation of ART in Uganda had an approximate 37% increased hazard of overall mortality relative to non-TB patients.
Keywords:Antiretroviral therapy, HIV, Tuberculosis, Propensity score methods, Uganda, Prospective cohort study
Background
The total number of people living with human immuno-deficiency virus (HIV) reached 34.0 million (31.6–35.2 million) worldwide by the end of 2010, [1] with the ma-jority in Sub-Saharan Africa. One-third of HIV-infected people are estimated to be co-infected with Mycobacter-ium tuberculosis (TB) which can activate or reactivate during the initiation of antiretroviral therapy (ART) due to immune reconstitution inflammatory syndrome (IRIS). However, TB incidence rates vary according to geography
and patients’ degrees of immunosuppression. The inci-dence proportion of active TB in HIV-infected patients with latent TB infection is about 10% per year compared to 10% per lifetime for an HIV-uninfected individual [2]. TB is a leading cause of HIV-related death [3]. Recent trial data have shown that early initiation of ART (within two weeks) during TB therapy can improve survival for pa-tients with co-infection [4-6]. Guidelines and policies on joint HIV/TB interventions have been developed to pro-mote synergies between TB and HIV/AIDS prevention and care activities, [7-9] aimed at reducing morbidity and mortality in co-infected patients. On the other hand, joint treatment containing ART and anti-TB drugs may be complicated by overlapping toxicity profiles, complex drug-drug interactions, and IRIS [10-13].
* Correspondence:thabanl@mcmaster.ca
1
Department of Clinical Epidemiology and Biostatistics, McMaster University, Hamilton, Canada
2
Biostatistics Unit, 3rd Floor Martha, Room H325, St Joseph’s Healthcare Hamilton, 50 Charlton Avenue East, Hamilton, ON L8N 4A6, Canada Full list of author information is available at the end of the article
To date, the association between active TB and mor-tality in HIV-infected patients who receive ART is poorly understood, particularly in settings with a rela-tively lower TB prevalence, such as Eastern Africa [9,13,14]. An observational study from Tororo, Uganda, comprising 1,044 HIV patients showed that TB at the initiation or during follow-up of ART was associated with a 4.7-fold increase in cumulative mortality relative to those without TB [15]. Nevertheless the association of TB disease and mortality was clearly confounded by de-gree of immunosuppression [15,16]. Several studies in more developed countries suggest incident TB substan-tially increases the risk of AIDS-related mortality among HIV patients receiving ART [17,18]. A recent meta-analysis suggested little impact of TB on mortality in HIV patients receiving ART [19]. Small numbers of co-infected patients, different procedures of baseline confounding ad-justment, and incomplete information on clinical outcomes have led to uncertainty of the impact of active TB on subse-quent mortality among co-infected patients on ART and the optimal timing of treatment of both diseases.
Our study involved a large prospective cohort of HIV-infected adult patients in Uganda, and had two objectives: (1) to assess the effect of active pulmonary TB disease at ART initiation on overall survival among HIV patients during ART treatment by adjusting for potential con-founders using propensity score (PS) methods, [20-22] and (2) to explore the robustness of the study findings by comparing results from three PS methods (matching on PS, stratifying on PS, adjusting for PS as regression covari-ate) to conventional (not PS-based) multivariable Cox re-gression model. These results may help accurately plan TB and HIV/AIDS management activities in HIV patients with TB co-infection.
Methods
Setting, participants and data collection
Our prospective cohort contained HIV-infected patients initiating ART at ten service centres managed by the AIDS Support Organization (TASO) across different set-tings in Uganda since 2000. Patients received ART from experienced medical staff at TASO clinics, outreach clinics in rural areas, and through community-based treatment programs. Details of the treatment program have been published previously [23]. The standard regi-men was two nucleoside reverse transciptase inhibitors and one non-nucleoside reverse transcriptase inhibitor. The current study included adult patients (aged 14 years or older at ART initiation) enrolled between August 2000 and June 2009 (inclusive) as part of an ongoing observa-tional study intended to evaluate the programmatic deliv-ery of services. After ART initiation, patients were scheduled for clinic visits at least every three months. Pa-tients’demographic, clinical, psychosocial, and medication
use data were collected by clinicians, and field workers using standardized forms at ART initiation, and each visit.
At the time of data collection, national guidelines in Uganda used three strategies for initiating treatment of TB in a co-infected patient: (1) patient with TB and CD4 cell count < 250 cells/mm3 or a patient with extra-pulmonary TB or WHO stage IV disease: start TB ther-apy first and when tolerated (usually within two to six weeks) then introduce ART; (2) pulmonary TB and CD4 250–350 cells/mm3: start TB therapy for two months then introduce ART, and; (3) pulmonary TB and CD4 > 350 cells/mm3: defer ART, monitor clinically and also do CD4 cell counts regularly; re-evaluate the patient at eight weeks and the end of TB treatment [24].
Primary outcome, exposure and potential confounding variables
analyzed age and CD4 count as continuous variables, and the other 12 covariates as categorical data coded by a ref-erence level and dummy indicators (Additional file 1).
Statistical analysis
We adopted PS methods to control for confounding, and estimated the causal effect of TB at the initiation of ART on overall survival of HIV patients since their initiation of ART using Cox regression models. We reported the crude and adjusted effects of TB using hazard ratios [HRs]. A patient was censored at the time they were lost to follow-up, or at the end of the study if still alive. PS methods have been increasingly used to control for baseline confounding in observational studies [20-22,36-40]. PS methods are more advantageous than adjusting for multiple covariates simultaneously in a single outcome model when numerous confounders need to be accounted for and the outcome is rare. PS methods provide an easy means to compare distributions of confounding variables between exposure groups within PS-stratified sets. It can be difficult to examine balancing distributions of confounders post-adjustment using the conventional multiple regression methods. We chose Cox regression on PS-matched pairs as the primary method of analysis because empirical evidence suggested PS-matching provides better control for confounding than other PS methods, [41,42] and statistical diagnostic tools for assessing the balance of confounders between PS-matched pairs were readily available [40,43,44]. Spe-cifically, we fit a Cox proportional hazards (PH) model in a dataset containing 1,686 TB cases and 1,686 PS-matched non-TB patients to control for observed potential confounding using a two-step procedure. First, we modeled the relationship between having active TB at baseline and the observed baseline covariates using a logistic regression model (“PS model”). We employed an iterative approach [45] to build the PS model by starting with the 14 observed baseline covariates; we then considered pairwise interac-tions, and polynomial terms of the continuous variables (age and CD4 cell count) in the PS model. We ultimately included such terms in the model if adding them improved the predictive power of the PS model and its ability to balance covariates between PS-matched pairs. Greater predictive power of the PS model (i.e. how well covari-ates included in the PS model predict baseline TB dis-ease status) was likely to result in greater balance; the performance of matching was also affected by other factors such as the matching algorithm and associated tuning parameters (e.g. caliper width). We aimed to match each active TB patient to one non-TB patient with the closest logit of the estimated PS, within a cali-per of 0.2 of the standard deviation of the logit of the estimated PS [46]. This matching method was shown to lead to optimal estimation of exposure effects in
various simulation settings [41,47]. Propensity score is a balancing score, so we assessed PS model adequacy (selection of variables and functional form) based on examining the similarity of the joint distribution of multiple baseline covariates between TB and non-TB patients with the same estimated propensity score [42]. Balance diagnostics of baseline covariates consisted of a series of numerical and graphical measures, including standardized difference, and for continuous covariates, ratio of variance, five-number summaries, quantile-quantile plot, nonparametric density plot, empirical cumulative distribution function and side-by-side boxplot. We repeated the PS modeling–balance diagnostics steps until we were satisfied with the resulting balancing distribution. Second, we fit a stratified Cox PH model to estimate the impact of baseline TB on survival. As outcomes within PS-matched pairs are not independent, we stratified on pairs to controls for within-pair homogeneity, allowing baseline hazard functions to vary across matched strata [45,48]. The appropriateness of the PH assumption was assessed using log-log survival curves.
We applied two other PS methods for confounding control as supportive secondary analyses to assess the robustness of the results of the primary analysis, namely, stratified Cox regression on quintiles of the estimated PS, and a Cox model adjusting for PS and its quadratic and cubic terms as covariates. Conventional (not PS-based) Cox regression directly modeling the effect of TB on overall survival, adjusting for multiple baseline covar-iates in the same form as included in the final PS model, was also performed.
adherence, and AIDS status post-ART initiation) were included in the imputation procedure. The follow-up variables were assessed after the initiation of ART and before the end of the study (death, lost to follow-up or June 2009, whichever happened first). Patient adherence was assessed at two weeks, two months and thereafter at six months after ART initiation, based on a composite of pharmacy monitored drug possession ratio, pharmacy refill records, and a three day recall report by patients or care givers. TASO calculated the mean adherence to ART for each patient. Adequate clinical adherence was defined as≥95% (i.e. adherence = yes; Additional file 1) [50,51]. No post-ART variables were included in PS or Cox regression models as they could be causal inter-mediates between baseline TB status and death, and accounting for them in the models could induce bias. While the same covariates were used to achieve prog-nostic balance on the five imputed datasets, propensity scores and baseline TB – mortality association were estimated separately for each individual dataset. We then calculated the overall estimate of TB effect, using Rubin’s rule [49].
We conducted statistical analyses in SAS version 9.2 (Cary, NC), R 2.14.0 (R Core Development Team) and Stata 10 (College Station, TX).
Ethics approval
University of British Columbia, University of Ottawa, and Mbale Regional Referral Hospital research ethics boards approved this study.
Results
Participant baseline characteristics
The study cohort consisted of 22,477 HIV-infected adult patients aged 14 years or older who started ART between August 2000 and June 2009 (Additional file 2: Figure S1). A total of 1,690 of 22,477 patients (7.52%) had active pul-monary TB disease at the initiation of ART. Table 1 indi-cates TB patients had lower CD4 counts (p < 0.001) and more advanced clinical stages (p < 0.001) at the start of ART. TB patients tended to be younger, had higher pro-portions of male, AIDS-defining illnesses, and a history of PCP (p < 0.001). Higher proportions of the TB patients were managed by the Entebbe, Jinja, Tororo and Mulago regional centres, whereas higher proportions of the non-TB patients were observed in Masaka, Mbale, Mbarara, Masindi, and Soroti regions. Summary statistics of the four baseline covariates with missing values was similar in the original and imputed datasets (Additional file 3).
Association between TB at ART initiation and baseline covariates
The final PS model included all 14 baseline covariates, their pairwise interactions with gender and baseline
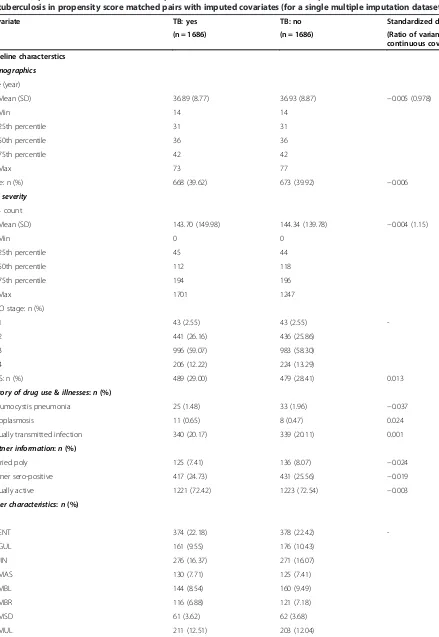
AIDS status (yes or no), and additional quadratic and interaction terms for the continuous variables to im-prove model fit (Additional file 4). Overall, the PS model predicted baseline TB status well (c statistic = 0.744, p-value = 0.203 for Hosmer and Lemeshow goodness-of-fit test). We were able to match 1,686 of 1,690 baseline TB patients to non-TB patients. PS matching improved the similarity of the distributions of all baseline covariates between TB and non-TB patients and reduced the stan-dardized differences to below 0.1. Table 2 displays the balancing distributions of the baseline covariates for one of the five imputed datasets. Consistent patterns were observed across the imputed datasets. Additional details on specific balance diagnostics of the two continuous covariates are in the appendices (Additional file 5: Figure S2 and Additional file 6: Figure S3).
Association between TB and all-cause mortality
During a median of 21.5 months of follow-up, 1,503 (6.69%) of the 22,477 HIV patients died. The propor-tions of patients who died with and without TB were 10.47% (median length of follow-up [IQR]: 627.5 days [205–1034]) and 6.38% (median length of follow-up [IQR]: 646 days [306–1045]), respectively, in the original unmatched sample. The proportion of deaths remained higher in the 1,686 PS-matched pairs, with 176 (10.44%; median length of follow-up [IQR]: 629 [205–1036]) and 137 (8.13%; median length of follow-up [IQR]: 659 [286–1023]) deaths in the TB and non-TB groups. An unadjusted Cox model suggested that TB, relative to no TB, increased the hazard of death by 74% (HR = 1.74, 95% CI: 1.49 – 2.04). The HR for all-cause mortality comparing TB to non-TB patients on the 1,686 PS-matched pairs (HR = 1.37, 95% CI: 1.08–1.75) was less substantial, indicating TB was associated with a 37% increase in the hazard of death over the course of the study after controlling for potential baseline confounding variables (Table 3). The PS-matched estimate was less precise than the crude due to a decrease of sample size. Kaplan-Meier survival curves for the original sample and PS-matched pairs are displayed in Figures 1 and 2. No violation of the PH assumption was suggested by log-log survival curves.
Additional analyses
Table 1 Comparison of baseline and follow-up characteristics between HIV-infected patients with and without co-infection of tuberculosis in the unmatched sample with imputed covariates (for a single multiple imputation dataset)
Characteristics TB: yes TB: no P-value Standardized difference
(n = 1690) (n = 20787) (Ratio of variance for
continuous covariate)
Baseline characteristics
Demographics
Age (year)
Mean (SD) 36.87 (8.78) 37.93 (9.48) <0.0001 −0.117 (0.86)
Min 14 14
25th percentile 31 31
50th percentile 36 37
75th percentile 42 43
Max 73 93
Male: n (%) 670 (39.64) 6216 (29.90) <0.0001 0.206
HIV severity
CD4 count
Mean (SD) 143.39 (149.94) 170.82 (172.26) <0.0001 −0.170 (0.76)
Min 0 0
25th percentile 45 66
50th percentile 111 139
75th percentile 193 208
Max 1701 1983
WHO stage: n (%)
1 43 (2.54) 992 (4.77) <0.0001
-2 441 (26.09) 11013 (52.98)
3 999 (59.11) 7173 (34.51)
4 207 (12.25) 1609 (7.74)
AIDS: n (%) 493 (29.17) 3881 (18.67) <0.0001 0.248
History of drug use&illnesses:n(%)
Pneumocystis pneumonia 28 (1.66) 101 (0.49) <0.0001 0.114
Toxoplasmosis 11 (0.65) 101 (0.49) 0.3542 0.022
Sexually transmitted infection 341 (20.17) 4353 (20.94) 0.4578 −0.019
Partner information:n(%)
Married poly 125 (7.40) 1801 (8.66) 0.0734 −0.047
Partner sero-positive 417 (24.67) 5801 (27.91) 0.0043 −0.073
Sexually active 1224 (72.43) 15272 (73.47) 0.3508 −0.023
Other characteristics:n(%)
Site
ENT 378 (22.37) 1950 (9.38) <0.0001
-GUL 161 (9.53) 1891 (9.10)
JIN 276 (16.33) 2586 (12.44)
MAS 130 (7.69) 2246 (10.80)
MBL 144 (8.52) 2446 (11.77)
MBR 116 (6.86) 2641 (12.71)
MSD 61 (3.61) 1254 (6.03)
methods had greater precision relative to the result of the PS-matched analysis, as the latter only utilized data from the matched pairs, a subset of the study sample. The trade-off between accuracy and precision of the PS methods has been noted in previous studies [40,42].
Discussion
This is, to our knowledge, the largest cohort of HIV-infected patients receiving ART in a single African coun-try that has evaluated mortality outcomes in co-infected patients. Descriptive analysis showed that TB patients, compared to non-TB patients, were more likely to be immunosuppressed, have a history of opportunistic infections, and live in particular geographical regions of Uganda. The results of Cox PH analysis using PS matching for confounding control showed that having pulmonary TB disease at the initiation of ART led to a 37% increase in the hazard of all-cause mortality during the follow-up period between 2000 and 2009. Additional analyses using two other PS methods and the conventional (not PS-based) multivariable Cox re-gression model showed similar results. These analyses may be viewed as sensitivity analyses because differ-ent methods use differdiffer-ent assumptions and the results seem to remain robust to different ways of adjusting for baseline confounding.
The prevalence of active pulmonary TB at the initi-ation of ART of 7.52% in the study is consistent with results from a smaller TASO cohort reported from
Tororo, Uganda [15]. This indicates that TB is less prevalent in Uganda compared with other African coun-tries, particularly Southern Africa [16]. An open cohort of 7,512 patients receiving ART in South Africa sug-gested that 15.9% of HIV patients were treated for pul-monary TB at ART initiation between 2004 and 2007. Our finding of a 37% increase in hazard of overall mor-tality associated with having active TB at ART initiation after controlling for potential baseline confounding is both statistically significant and clinically relevant. This result is different from Westreich et al.’s findings on 7,512 HIV patients in South Africa, indicating pulmon-ary TB treatment at ART initiation was uncorrelated to the overall survival (HR = 1.06, 95% CI: 0.75-1.49) after adjusting for multiple confounders [16]. While all TB patients in the South Africa study received ART soon after initiation of TB treatment if TB treatment was well tolerated, the current study did not have reliable data on TB treatment at the initiation of ART. Instead the effect of baseline active pulmonary TB disease on mortality was evaluated and active TB patients might or might not have received TB treatment during the course of the study. The difference in baseline exposure between the two studies is likely to be the most important factor explaining the different results and suggests a benefit of starting TB treatment at ART initiation to reduce overall mortality in a co-infected population.
Guidelines on the treatment of TB co-infection with HIV have changed dramatically over the last few years Table 1 Comparison of baseline and follow-up characteristics between HIV-infected patients with and without co-infection of tuberculosis in the unmatched sample with imputed covariates (for a single multiple imputation dataset)(Continued)
SOR 29 (1.72) 1546 (7.44)
TOR 184 (10.89) 1837 (8.84)
Education (Higher institute) 58 (3.43) 623 (3.00) 0.3158 0.025
ART start year since 2000
0 0 (0) 2 (0.01) <0.0001
-4 23 (1.36) 946 (4.55)
5 453 (26.80) 4532 (21.80)
6 373 (22.07) 3627 (17.45)
6 507 (30.00) 6715 (32.30)
8 330 (19.53) 4943 (23.78)
9 4 (0.24) 22 (0.11)
Follow-up characteristics
Death: n (%) 177 (10.47) 1326 (6.38) <0.0001 0.148
Median (IQR) length of follow-up (days) 627.5 (205–1034) 646 (306–1045) -
Table 2 Comparison of baseline and follow-up characteristics between HIV-infected patients with and without co-infection of tuberculosis in propensity score matched pairs with imputed covariates (for a single multiple imputation dataset)
Covariate TB: yes TB: no Standardized difference
(n = 1686) (n = 1686) (Ratio of variance for continuous covariate)
Baseline characterstics
Demographics
Age (year)
Mean (SD) 36.89 (8.77) 36.93 (8.87) −0.005 (0.978)
Min 14 14
25th percentile 31 31
50th percentile 36 36
75th percentile 42 42
Max 73 77
Male: n (%) 668 (39.62) 673 (39.92) −0.006
HIV severity
CD4 count
Mean (SD) 143.70 (149.98) 144.34 (139.78) −0.004 (1.15)
Min 0 0
25th percentile 45 44
50th percentile 112 118
75th percentile 194 196
Max 1701 1247
WHO stage: n (%)
1 43 (2.55) 43 (2.55)
-2 441 (26.16) 436 (25.86)
3 996 (59.07) 983 (58.30)
4 206 (12.22) 224 (13.29)
AIDS: n (%) 489 (29.00) 479 (28.41) 0.013
History of drug use&illnesses:n(%)
Pneumocystis pneumonia 25 (1.48) 33 (1.96) −0.037
Toxoplasmosis 11 (0.65) 8 (0.47) 0.024
Sexually transmitted infection 340 (20.17) 339 (20.11) 0.001
Partner information:n(%)
Married poly 125 (7.41) 136 (8.07) −0.024
Partner sero-positive 417 (24.73) 431 (25.56) −0.019
Sexually active 1221 (72.42) 1223 (72.54) −0.003
Other characteristics:n(%)
Site
ENT 374 (22.18) 378 (22.42)
-GUL 161 (9.55) 176 (10.43)
JIN 276 (16.37) 271 (16.07)
MAS 130 (7.71) 125 (7.41)
MBL 144 (8.54) 160 (9.49)
MBR 116 (6.88) 121 (7.18)
MSD 61 (3.62) 62 (3.68)
and may not reflect within-country variability. For ex-ample, early guidelines feared drug interactions between TB medication and ART or negative impact on adherence of ART or TB due to pill burden and suggested early treatment for TB disease followed by stabilization with ART. However, more recent evidence from randomized trials [4-6] suggests that starting ART within two weeks of TB treatment to improve survival appears to be well tolerated, and has persuaded guideline makers to recom-mend co-administration of treatment. In addition, re-cent data from South Africa found that although IRIS events were associated with slightly lower adherence rates, overall adherence to ART remained high in this co-infected population. The data suggested that con-cerns about IRIS or drug-drug interactions should not deter clinicians from early ART initiation, but patients developing IRIS events should be monitored closely and potentially targeted for interventions to increase
adherence [52]. Other developments are related to the specific setting. Uganda, for example, has a lower na-tional prevalence of co-infection than Southern Africa and has not reported any cases of extensively drug re-sistant (XDR) TB infections. South Africa, on the other hand, has had an epidemic of XDR co-infections that has resulted in quarantine of some patients and recom-mendations about interacting with other individuals [53]. National guidelines from Uganda do not match those of South Africa, as discussed earlier.
Limitations of the study emerge from three key sources. First, propensity score methods cannot balance unmeasured confounders in estimating a causal relation-ship, which is an issue faced by all observational cohorts. Our results may be biased if some unobserved prognos-tic factors were unbalanced between TB and non-TB groups. While some studies examined the impact of body mass index and anemia on clinical outcomes in co-Table 2 Comparison of baseline and follow-up characteristics between HIV-infected patients with and without co-infection of tuberculosis in propensity score matched pairs with imputed covariates (for a single multiple imputation dataset)
(Continued)
SOR 29 (1.72) 18 (1.07)
TOR 184 (10.91) 172 (10.20)
Education (Higher institute) 58 (3.44) 59 (3.50) −0.003
ART start year since 2000
4 23 (1.36) 15 (0.89)
-5 452 (26.81) 428 (25.39)
6 372 (22.06) 360 (21.35)
7 505 (29.95) 548 (32.50)
8 330 (19.57) 330 (19.57)
9 4 (0.24) 5 (0.30)
Follow-up characteristics
Death: n (%) 176 (10.44) 137 (8.13) 0.080
Median (IQR) length of follow-up (days) 629 (205–1036) 659 (286–1023)
-Note: For continuous variables, mean and standard deviation for each group, standardized mean difference and ratio of variances between TB and no-TB patients are reported. For categorical variables, frequency and percentage of the specified level, and standardized difference between TB and no-TB patients are reported, unless noted otherwise.MImultiple imputation,SDstandard deviation,WHOWorld Health Organization,HIVhuman immunodeficiency virus,AIDSacquired immune deficiency syndromes,ENTEntebbe,JINJinja,MASMasaka,MBLMbale,MBRMbarara,MULMulago,TORTororo,GULGulu,SORSoroti,MSDMasindi,IQR interquantile range.
Table 3 Effect of tuberculosis (TB) at the initiation of antiretroviral therapy (ART) on overall survival
Method HR 95% CI P-value CI width ratio*
Primary analysis
Matching on PS 1.37 (1.08, 1.75) 0.011 1
Additional analyses
Unadjusted Cox regression 1.74 (1.49, 2.04) <0.001 0.82
Stratified on PS 1.36 (1.15, 1.60) <0.001 0.66
PS as covariate (linear, quadratic and cubic terms) 1.34 (1.14, 1.58) <0.001 0.65
Conventional adjusted Cox regression 1.40 (1.19, 1.65) <0.001 0.69
infected patients [16], such baseline information was un-available in the current study. More resources need to be dedicated to improve the completeness and accuracy of data collection in HIV patients in underdeveloped regions. Although statistical tools instrumental vari-able analysis, have been developed to control for bias due to unmeasured confounders [54], strong assump-tions are required to ensure estimation accuracy, and such assumptions can be difficult to verify using em-pirical data. Second, the multiple imputation method employed to impute the missing values for baseline co-variates requires missing at random (MAR) assump-tion (i.e. missingness can be explained by differences in the observed data). Although the current imputation procedure included a number of baseline characteristics and follow-up variables, we could not rule out the exist-ence of additional variables that were highly associated with missingness. The MAR assumption is unverifiable using data collected within a study. Third, our results are
predominantly based on adult, HIV-infected, African pa-tients who initiated ART in Uganda, during 2004 to 2009, hence limiting their generalizability. The effect of active pulmonary TB disease on HIV patients in other age or ethnic groups (for instance, children and adolescents) and from different geographic regions should be fur-ther investigated.
Our study shows a 37% increase in the hazard of death among co-infected patients compared with those only infected with HIV. We used pulmonary TB disease as documented through sputum and radiologic confirmation for the diagnosis of TB disease as TASO, along with most AIDS service organizations in Africa, lacked the infrastruc-ture to consistently diagnose extra-pulmonary TB disease. Also, we recognize that sensitivity of sputum smear for diagnosis of pulmonary TB in HIV-infected patients was poor (less than 50%) and thus we followed up patients with suspect TB disease with radiologic examinations regardless of sputum results. Because TB is associated with mortality (as observed in this study), misclassifying actual active TB patients into the non-TB group would attenuate the magni-tude of the TB effect on death; as a result the apparent esti-mates of TB effects on death would be less substantial than the actual effects.
Conclusions
In summary, our current study suggests a moderate in-crease in the hazard of death associated with having active TB disease at the initiation of ART in HIV-infected pa-tients receiving ART in Uganda. Our finding is comple-mentary to results of the recent SAPIT, [4] CAMELIA, [5] and STRIDE trials [6] that demonstrate improved survival when ART is initiated during TB therapy. The results also validate the WHO guidelines that urge a more aggressive approach to management of both TB and HIV [55].
Additional files
Additional file 1:Coding of baseline covariates and post-ART variables.
Additional file 2: Figure S1.Study flowchart.
Additional file 3:Summary statistics of the four baseline covariates with missing values in the original and imputed datasets.
Additional file 4:Results of the final propensity score (PS) model.
Additional file 5: Figure S2.Distribution of age (in years) at ART initiation in TB and no-TB group in the original sample and PS-matched pairs for a single MI dataset. From top to bottom: quantile-quantile plots, empirical cumulative distribution functions (circles represent TB and triangles represent no-TB), nonparametric density curves (solid line represents TB and dashed line represents no-TB), and side-by-side boxplots.
Additional file 6: Figure S3.Distribution of CD4 cell counts at ART initiation in TB and no-TB group in the original sample and PS matched pairs for a single MI dataset. From top to bottom: quantile-quantile plots, empirical cumulative distribution functions (circles represent TB and triangles represent no-TB), nonparametric density curves (solid line represents TB and dashed line represents no-TB), and side-by-side boxplots.
0.85
0.90
0.95
1.00
Survival probability
0 500 1000 1500 2000 2500 3000
Survival time (days) TB
TB Number at risk
20676 Non-TB
Non-TB
5420 2 1
1676 441 0 0
Figure 1Kaplan–Meier survival curves by baseline TB status in the unmatched study sample.
0.85
0.90
0.95
1.00
Survival probability
0 500 1000 1500 2000
Survival time (days) TB
991 Number at risk
TB
1670 Non-TB
Non-TB
1672 1065 435441 2624 00
Abbreviations
TB:Tuberculosis; ART: Antiretroviral therapy; HIV: Human immunodeficiency virus; AIDS: Acquired immune deficiency syndromes; WHO: World Health Organization; TASO: AIDS Support Organization; IRIS: Immune reconstitution inflammatory syndrome; PCP: Pneumocystis pneumonia; PS: Propensity score; HR: Hazard ratio; MI: Multiple imputation; MAR: Missing at random; SD: Standard deviation; CI: Confidence interval; ENT: Entebbe; JIN: Jinja; MAS: Masaka; MBL: Mbale; MBR: Mbarara; MUL: Mulago; TOR: Tororo; GUL: Gulu; SOR: Soroti; MSD: Masindi; IQR: Interquantile range.
Competing interests
The authors declare that they have no competing interest.
Authors’contributions
RC participated in the conception and design of the study, data cleaning and analysis, results interpretation, and drafting and revision of the manuscript. EM participated in the conception and design of the study, data collection, results interpretation, and revision of the manuscript. JB and EP participated in review of statistical methods, results interpretation, and revision of the manuscript. CN participated in data collection from TASO clinics and review of drafts. JBN and PJD participated in results interpretation and revision of the manuscript. LT participated in the conception and design of the study, results interpretation, and revision of the manuscript. All authors read and approved the final manuscript.
Acknowledgements
RC received studentship from Father Sean O’Sullivan Research Centre, St. Joseph’s Healthcare Hamilton. RC holds a doctoral research award from the Canadian Institutes of Health Research. This study was supported in part by funds from the CANNeCTIN program.
Author details
1Department of Clinical Epidemiology and Biostatistics, McMaster University, Hamilton, Canada.2Biostatistics Unit, 3rd Floor Martha, Room H325, St Joseph’s Healthcare Hamilton, 50 Charlton Avenue East, Hamilton, ON L8N 4A6, Canada.3Faculty of Health Sciences, University of Ottawa, Ottawa, Canada.4The AIDS Support Organization (TASO), Kampala, Uganda. 5Department of Medicine and Centre for Infectious Diseases, Stellenbosch University, Cape Town, South Africa.6Departments of Epidemiology and International Health, Johns Hopkins Bloomberg School of Public Health, Baltimore, MD, USA.7Hamilton Health Sciences, Population Health Research Institute, Hamilton, Canada.
Received: 13 August 2012 Accepted: 2 July 2013 Published: 13 July 2013
References
1. World Health Organization:Global summary of the HIV/AIDS epidemic.2009. [http://www.who.int/hiv/data/2009_global_summary.gif] Accessed July 16, 2012. 2. Selwyn PA, Hartel D, Lewis VA, Schoenbaum EE, Vermund SH, Klein RS,
Walker AT, Friedland GH:A prospective study of the risk of tuberculosis among intravenous drug users with human immunodeficiency virus infection.N Engl J Med1989,320(9):545–550.
3. Centers for Disease Control and Prevention. TB and HIV/AIDS. CDC HIV/AIDS facts.2012. [http://www.cdc.gov/hiv/resources/factsheets/PDF/hivtb.pdf] Accessed July 16, 2012.
4. Abdool Karim SS, Naidoo K, Grobler A, Padayatchi N, Baxter C, Gray A, Gengiah T, Nair G, Bamber S, Singh A, Khan M, Pienaar J, El-Sadr W, Friedland G, Abdool Karim Q:Timing of initiation of antiretroviral drugs during tuberculosis therapy.N Engl J Med2010,362(8):697–706. 5. Blanc FX, Sok T, Laureillard D, Borand L, Rekacewicz C, Nerrienet E, Madec Y,
Marcy O, Chan S, Prak N, Kim C, Lak KK, Hak C, Dim B, Sin CI, Sun S, Guillard B, Sar B, Vong S, Fernandez M, Fox L, Delfraissy JF, Goldfeld AE, CAMELIA (ANRS 1295-CIPRA KH001) Study Team:Earlier versus later start of antiretroviral therapy in HIV-infected adults with tuberculosis.N Engl J Med2011,365(16):1471–1481.
6. Havlir DV, Kendall MA, Ive P, Kumwenda J, Swindells S, Qasba SS, Luetkemeyer AF, Hogg E, Rooney JF, Wu X, Hosseinipour MC, Lalloo U, Veloso VG, Some FF, Kumarasamy N, Padayatchi N, Santos BR, Reid S, Hakim J, Mohapi L, Mugyenyi P, Sanchez J, Lama JR, Pape JW, Sanchez A, Asmelash A, Moko E, Sawe F, Andersen J, Sanne I, AIDS Clinical Trials Group Study
A5221:Timing of antiretroviral therapy for HIV-1 infection and tuberculosis.N Engl J Med2011,365(16):1482–1491.
7. World Health Organization:Joint HIV/Tuberculosis interventions.2012. [http://www.who.int/hiv/topics/tb/tuberculosis/en/] Accessed July 16, 2012. 8. Marks S, Magee E, Robison V:Reported HIV status of tuberculosis patients—
United States, 1993-2005.MMWR Morb Mortal Wkly Rep2007,56(42):1103–1106. 9. Harries AD, Zachariah R, Corbett EL, Lawn SD, Santos-Filho ET, Chimzizi R,
Harrington M, Maher D, Williams BG, De Cock KM:The HIV-associated tuberculosis epidemic–when will we act?Lancet2010,375(9729):1906–1919. 10. Burman WJ, Jones BE:Treatment of HIV-related tuberculosis in the era of
effective antiretroviral therapy.Am J Respir Crit Care Med2001,164(1):7–12. 11. Narita M, Ashkin D, Hollender ES, Pitchenik AE:Paradoxical worsening of
tuberculosis following antiretroviral therapy in patients with AIDS.
Am J Respir Crit Care Med1998,158(1):157–161.
12. McIlleron H, Meintjes G, Burman WJ, Maartens G:Complications of antiretroviral therapy in patients with tuberculosis: drug interactions, toxicity, and immune reconstitution inflammatory syndrome.J Infect Dis
2007,196(Suppl 1):S63–S75.
13. Gandhi NR, Nunn P, Dheda K, Schaaf HS, Zignol M, van Soolingen D, Jensen P, Bayona J:Multidrug-resistant and extensively drug-resistant
tuberculosis: a threat to global control of tuberculosis.Lancet2010, 375(9728):1830–1843.
14. Lonnroth K, Castro KG, Chakaya JM, Chauhan LS, Floyd K, Glaziou P, Raviglione MC:Tuberculosis control and elimination 2010–50: cure, care, and social development.Lancet2010,375(9728):1814–1829.
15. Moore D, Liechty C, Ekwaru P, Were W, Mwima G, Solberg P, Rutherford G, Mermin J:Prevalence, incidence and mortality associated with tuberculosis in HIV-infected patients initiating antiretroviral therapy in rural Uganda.AIDS2007,21(6):713–719.
16. Westreich D, MacPhail P, Van Rie A, Malope-Kgokong B, Ive P, Rubel D, Boulme R, Eron J, Sanne I:Effect of pulmonary tuberculosis on mortality in patients receiving HAART.AIDS2009,23(6):707–715.
17. Lopez-Gatell H, Cole SR, Hessol NA, French AL, Greenblatt RM, Landesman S, Preston-Martin S, Anastos K:Effect of tuberculosis on the survival of women infected with human immunodeficiency virus.Am J Epidemiol
2007,165(10):1134–1142.
18. Lopez-Gatell H, Cole SR, Margolick JB, Witt MD, Martinson J, Phair JP, Jacobson LP, Multicenter AIDS Cohort Study:Effect of tuberculosis on the survival of HIV-infected men in a country with low tuberculosis incidence.AIDS2008,22(14):1869–1873.
19. Straetemans M, Bierrenbach AL, Nagelkerke N, Glaziou P, van der Werf MJ: The effect of tuberculosis on mortality in HIV positive people: a meta-analysis.PLoS One2010,5(12):e15241.
20. Rosenbaum PR, Rubin DB:The central role of the propensity score in observational studies for causal effects.Biometrika1983,70(1):41–55. 21. Rosenbaum PR, Rubin DB:Reducing bias in observational studies using
subclassification on the propensity score.J Am Stat Assoc1984, 79:516–524.
22. Rubin DB:The design versus the analysis of observational studies for causal effects: parallels with the design of randomized trials.Stat Med
2007,26(1):20–36.
23. Bakanda C, Birungi J, Nkoyooyo A, Featherstone A, Cooper CL, Hogg RS, Mills EJ:Cohort Profile: The TASO-CAN Cohort Collaboration.Int J Epidemiol
2012,41(4):946–950. http://ije.oxfordjournals.org/content/41/4/946. 24. Ministry of health:National Antiretroviral Treatment and Care Guidelines for
Adults and Children: Kampala.Uganda: Earnest Publishers; 2008. 25. Druyts E, Dybul M, Kanters S, Nachega J, Birungi J, Ford N, Thorlund K,
Negin J, Lester R, Yaya S, Mills EJ:Male sex and the risk of mortality among individuals enrolled in antiretroviral therapy programs in Africa: a systematic review and meta-analysis.AIDS2013,27(3):417–425. 26. AIDS Basics.; 2013. [http://aids.gov/hiv-aids-basics/] Accessed June 22, 2013. 27. Vlahov D, Graham N, Hoover D, Flynn C, Bartlett JG, Margolick JB, Lyles CM, Nelson KE, Smith D, Holmberg S, Farzadegan H:Prognostic indicators for AIDS and infectious disease death in HIV-infected injection drug users: plasma viral load and CD4+ cell count.JAMA1998,279(1):35–40. 28. May M, Sterne JA, Sabin C, Costagliola D, Justice AC, Thiebaut R, Gill J,
29. Dheda K, Shean K, Zumla A, Badri M, Streicher EM, Page-Shipp L, Willcox P, John MA, Reubenson G, Govindasamy D, Wong M, Padanilam X, Dziwiecki A, van Helden PD, Siwendu S, Jarand J, Menezes CN, Burns A, Victor T, Warren R, Grobusch MP, van der Walt M, Kvasnovsky C:Early treatment outcomes and HIV status of patients with extensively drug-resistant tuberculosis in South Africa: a retrospective cohort study.Lancet2010, 375(9728):1798–1807.
30. Bakanda C, Birungi J, Mwesigwa R, Zhang W, Hagopian A, Ford N, Mills EJ: Density of healthcare providers and patient outcomes: evidence from a nationally representative multi-site HIV treatment program in Uganda.
PLoS One2011,6(1):e16279.
31. Mills EJ, Beyrer C, Birungi J, Dybul MR:Engaging men in prevention and care for HIV/AIDS in Africa.PLoS Med2012,9(2):e1001167.
32. Epstein H, Swidler A, Gray R, Reniers G, Parker W, Parkhurst J, Short R, Halperin D:Measuring concurrent partnerships.Lancet2010, 375(9729):1869. author reply 1870.
33. Eyawo O, de Walque D, Ford N, Gakii G, Lester RT, Mills EJ:HIV status in discordant couples in sub-Saharan Africa: a systematic review and meta-analysis.Lancet Infect Dis2010,10(11):770–777.
34. Padian NS, Manian S:The concurrency debate: time to put it to rest.
Lancet2011,378(9787):203–204.
35. Centers for Disease Control and Prevention:Basic TB Facts.2013. [http://www.cdc.gov/tb/topic/basics/risk.htm] Accessed June 22, 2013. 36. Austin PC:A critical appraisal of propensity-score matching in the medical
literature between 1996 and 2003.Stat Med2008,27(12):2037–2049. 37. Gayat E, Pirracchio R, Resche-Rigon M, Mebazaa A, Mary JY, Porcher R:
Propensity scores in intensive care and anaesthesiology literature: a systematic review.Intensive Care Med2010,36(12):1993–2003.
38. Tleyjeh IM, Kashour T, Zimmerman V, Steckelberg JM, Wilson WR, Baddour LM:The role of valve surgery in infective endocarditis management: a systematic review of observational studies that included propensity score analysis.Am Heart J2008,156(5):901–909.
39. Guo S, Fraser MW:Propensity Score Analysis: Statistical Methods and Applications.Thousand Oaks, CA: SAGE Publications, Inc.; 2010.
40. Austin PC:Balance diagnostics for comparing the distribution of baseline covariates between treatment groups in propensity-score matched samples.Stat Med2009,28(25):3083–3107.
41. Austin PC:A Tutorial and Case Study in Propensity Score Analysis: An Application to Estimating the Effect of In-Hospital Smoking Cessation Counseling on Mortality.Multivariate Behav Res2011,46(1):119–151. 42. Austin PC:An Introduction to Propensity Score Methods for Reducing
the Effects of Confounding in Observational Studies.Multivariate Behav Res2011,46(3):399–424.
43. Cohen J:Statistical power analysis for the behavioural sciences: 2nd ed.
Hillsdale, NJ: Lawrence Erlbaum Associates Publishers; 1988.
44. Ho DE:Using propensity scores to help design observational studies: application to the tobacco litigation.Health sciences and outcomes research methodology2001,2:169–188.
45. Austin PC, Mamdani MM:A comparison of propensity score methods: a case-study estimating the effectiveness of post-AMI statin use.Stat Med
2006,25(12):2084–2106.
46. Coca-Perraillon M:Local and global optimal propensity score matching.
Orlando, Florida: Proceedings of the SAS Global Forum 2007; 2007. 47. Austin PC:Optimal caliper widths for propensity-score matching when
estimating differences in means and differences in proportions in observational studies.Pharm Stat2011,10(2):150–161.
48. Cummings P, McKnight B, Greenland S:Matched cohort methods for injury research.Epidemiol Rev2003,25:43–50.
49. Little RJA, Rubin DB:Statistical Analysis with Missing Data: 2nd ed.New Jersey: John Wiley & Sons, Inc.; 2002.
50. Abaasa AM, Todd J, Ekoru K, Kalyango JN, Levin J, Odeke E, Karamagi CA: Good adherence to HAART and improved survival in a community HIV/ AIDS treatment and care programme: the experience of The AIDS Support Organization (TASO), Kampala, Uganda.BMC Health Serv Res
2008,8:241-6963-8-241.
51. Kiboneka A, Nyatia RJ, Nabiryo C, Anema A, Cooper CL, Fernandes KA, Montaner JS, Mills EJ:Combination antiretroviral therapy in population affected by conflict: outcomes from large cohort in northern Uganda.
BMJ2009,338:b201.
52. Morroni C, Chaisson R, Goliath R,et al:Influence of IRIS on ART adherence in HIV + adults.South Africa: CROI; 2012. Abstract# 941.
53. Gandhi NR, Moll A, Sturm AW, Pawinski R, Govender T, Lalloo U, Zeller K, Andrews J, Friedland G:Extensively drug-resistant tuberculosis as a cause of death in patients co-infected with tuberculosis and HIV in a rural area of South Africa.Lancet2006,368(9547):1575–1580.
54. Stukel TA, Fisher ES, Wennberg DE, Alter DA, Gottlieb DJ, Vermeulen MJ: Analysis of observational studies in the presence of treatment selection bias: effects of invasive cardiac management on AMI survival using propensity score and instrumental variable methods.JAMA2007, 297(3):278–285.
55. World Health Organization:Treatment of tuberculosis: guidelines for national programmes: 3rd ed.Geneva, Switzerland: World Health Organization; 2003.
doi:10.1186/1742-6405-10-19
Cite this article as:Chuet al.:Impact of tuberculosis on mortality among HIV-infected patients receiving antiretroviral therapy in Uganda: a prospective cohort analysis.AIDS Research and Therapy201310:19.
Submit your next manuscript to BioMed Central and take full advantage of:
• Convenient online submission
• Thorough peer review
• No space constraints or color figure charges
• Immediate publication on acceptance
• Inclusion in PubMed, CAS, Scopus and Google Scholar
• Research which is freely available for redistribution