R E S E A R C H A R T I C L E
Open Access
Development and validation of
elder-friendly urban spaces questionnaire
(EFUSQ)
Azadeh Lak
1, Reihaneh Aghamolaei
2, Hamid R. Baradaran
3,4*and Phyo K. Myint
4Abstract
Background:Considering the lack of specific measurement tools to study elders’perceptions in outdoor spaces, the study objectives were to derive and validate a questionnaire that assesses the essential features of elderly-friendly urban spaces.
Methods:We used closed-ended questions in two phases. In the first qualitative phase, a preliminary questionnaire was defined using grounded theory. In the second phase, the psychometric properties of the elderly-friendly urban spaces were examined through validity and reliability indices.
Results:The findings of the first phase led to a preliminary item extraction and questionnaire with 15 major domains based on three dimensions: place function, place preferences, and process. In the second phase, a 48-item questionnaire, based on three dimensions, in addition to personal characteristics, was introduced.
Conclusions:The Elderly-Friendly Urban Spaces Questionnaire (EFUSQ) can be adopted in various communities in understanding of how to create age-friendly urban spaces to promote active aging.
Keywords:Older people, Public space, Age-friendly environment, Active aging
Background
The population of older people aged≥65 years is predicted to grow from 524 million in 2010 to approximately 1.5 billion by 2050 in an exponential trend golbally [1]. A high percent-age of this drastic growth is expected to occur in urban areas [2]. Studies have revealed the influence of the environment on older peoples’ health, physical activity, and well-being at the neighborhood and public space scales. Hence recent at-tention has been paid in making public spaces suitable for the active aging and aging in place of the population [3].
Open and green spaces provide social interaction op-portunities and generate a sense of community. They also promote social engagement, physical activity, relax-ation, and interaction with nature [4]. These places are accessible most of the time for the majority of the public with low cost [5]. Research is needed to create valid and
reliable tools for assessing age-friendliness of urban places to be used at baseline and follow-up so as to be able to evaluate improvements over time [6]. However, a considerable gap exists between research run on age-friendly assessment methods and the evolving local com-munity initiatives [6]. Age-friendly studies highlight the importance of local surveys to precisely obtain informa-tion and incorporate them into local attributes through the application of grounded approaches [7].
It is, therefore, essential to develop population-specific tools to collect information on older people’s expectation of public spaces. The objective of this study is to develop and determine the psychometric properties of a tool for meas-uring age-friendly urban spaces according to older people’s preferences. This step is a critical prerequisite for develop-ing age-friendly urban spaces to promote active agdevelop-ing cities.
Methods
Theoretical background
According to the guidelines introduced by WHO, an age-friendly city encourages active aging by optimizing
© The Author(s). 2019Open AccessThis article is distributed under the terms of the Creative Commons Attribution 4.0 International License (http://creativecommons.org/licenses/by/4.0/), which permits unrestricted use, distribution, and reproduction in any medium, provided you give appropriate credit to the original author(s) and the source, provide a link to the Creative Commons license, and indicate if changes were made. The Creative Commons Public Domain Dedication waiver (http://creativecommons.org/publicdomain/zero/1.0/) applies to the data made available in this article, unless otherwise stated.
* Correspondence:[email protected];[email protected]
3
Department of Epidemiology, School of Public Health, Iran University of Medical Sciences, Tehran, Iran
4Ageing Clinical & Experimental Research Team, Institute of Applied Health Sciences, University of Aberdeen, Aberdeen, Scotland, UK
opportunities for health, participation, and security to enhance the quality of life [8]. WHO has proposed 6 de-terminants for the concept of active aging in cities: [1] health and social services, [2] behavioral, [3] personal, [4] physical environment, [5] social, and [6] economic determinants [9]. “Active aging” is perceived as the de-sire and ability of older people to integrate physical ac-tivity into their daily routines and engagement in economic and socially productive activities [10].
There are many different methods to assess the age-friendliness of urban spaces [6]. Current methods of asses-sing older peoples’ view of the built environment can be categorized into 3 groups. Observational audit tools typic-ally aimed to capture descriptive and objective data on specific street-level attributes such as presence and qual-ities. The second method is a well-established tradition of perceived-environment measures through surveys to col-lect self-reported data [11, 12]. Lastly, spatial qualitative methods use a more heterogeneous group of tools, com-prising techniques such as photo-voice, walk-along inter-views, or virtual reality experiments, as exemplified in a recent review of qualitative studies [11,12].
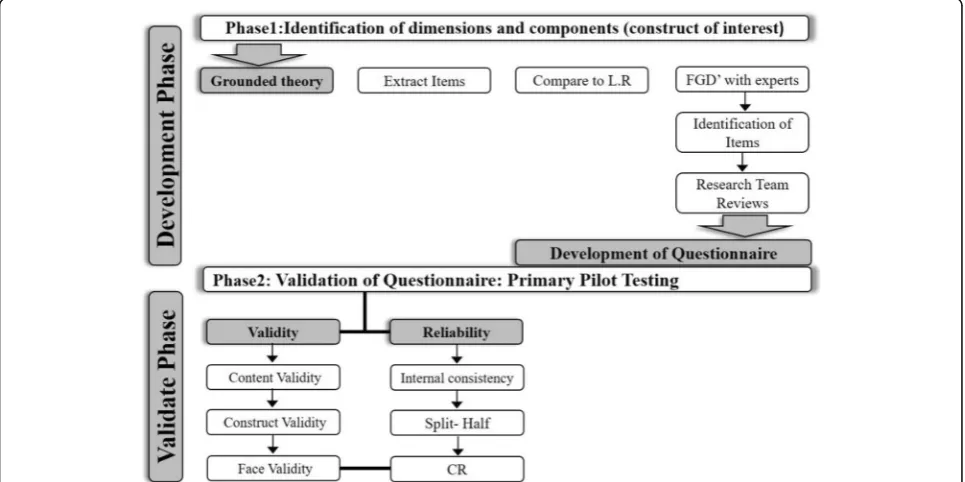
The objective of this study was to develop and determine the psychometric properties of the developed questionnaire for measuring age-friendly urban spaces according to older peoples’ preferences. Developing the questionnaire and its validation is done in two phases (Fig.1).
The objective of the first phase was to develop the over-all scheme of the questionnaire based on grounded theory (GT) and context characteristics. The extraction and
design of the items and phrases of the initial questionnaire consisted of three steps: [1] adopting the GT (qualitative research and extracting appropriate phrases through con-tent analysis technique), [2] conducting desk study and extracting the phrases and [3] designing the initial questionnaire.
The objective of the second phase was to validate the questionnaire developed in phase 1 by assessing the validity of the psychometric characteristics of the questionnaire and assessing reliability through structural validity, split-half analysis, and Cronbach’sαcoefficient in SPSS 22. Validity analysis was checked by 3 indicators of content, construct, and face validation according to Waltz and Bausell content validity index and Lawshe content validity ratio [13, 14]. The study protocol was approved by the Ethics Board of Iran University of Medical Sciences.
Grounded theory (GT) and item extraction
The purposeful sampling is used to have maximum vari-ation in the age, sex, literacy, physical and mental health status, and socioeconomic status with a high presence in neighborhoods’ community centers with registered local information in the health department of the community center in Tehran’s neighborhoods. Since the participants in the GT study were selected from older people living in Tehran. The inclusion criteria were [1] age over 65 years, [2] local residents in neighborhoods, [3] willing to participate in the study and [4] providing consent.
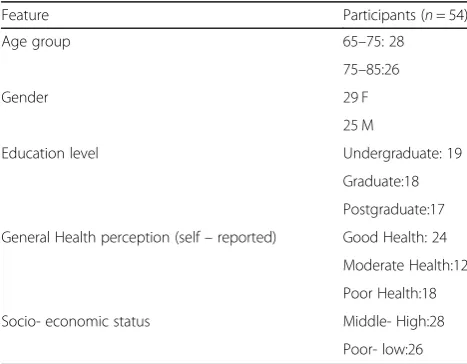
The interviews were carried out with 54 older partici-pants who were presents in urban outdoors 3–5 times a
week. They were chosen from different public spaces such as parks, streets, and squares in different neighborhoods with different socio-economic classes which have active community centres to collect the elders’health informa-tion from June and July 2018 (Table 1). The duration of the interviews was 20 to 45 min depending on the partici-pant’s level of interest and cooperation (Table1).
Moreover, a Focus Group Discussion (FGD) with 12 older peoples (7 women and 5 men) among interviewees was held for trustworthiness in the City Council of Dis-trict 10 in Tehran Municipality in August 2018.
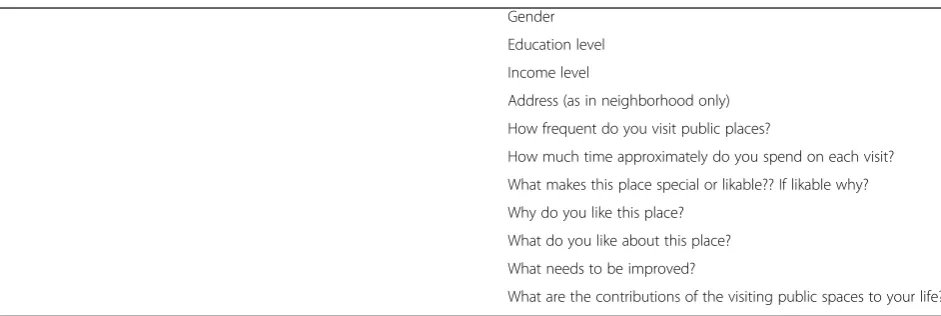
During the semi-structured interviews according (Table 12), the participants were asked the following questions: How do you like this place to be? What qual-ities should this place have so that you would want to spend more time in it? The subsequent questions were asked according to the participants’ responses to these two initial open-ended questions. The data were ana-lyzed using Strauss and Corbin’s coding supervised method by two people in the research team’s experts [15]. The last five interviews and the FGD were con-ducted after reaching theoretical saturation for more certainty and validity.
The credibility of data was assured through peer checking and member checking [16–18]. Peer checks were conducted via weekly research team meetings during which the emer-ging data were discussed and reviewed and analyzed the data among research group. Member checks occurred by provid-ing a summary of the analyzed interviews and extracted codes to participants so the research team could be asked and incorporated their feedback and ideas for corrections. In addition, the quality of public places was appraised through observational field studies by applying the urban design tech-niques to assess public spaces’ qualities for instance Jan Gehl’s toolbox [19]. Thus, conformability was observed by
considering the opinions of other researchers and transfer-ability by fully describing all the stages of the procedure [18].
Item finalization
The relevant literature was reviewed to validate the ex-tracted subcategories. In this process, all of the exex-tracted codes are assessed by similar concepts in the literature of this domain (Table13).
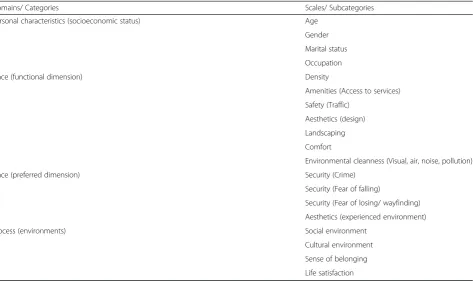
The extracted items and gathered data from desk study are used to guide item development. The devel-oped questionnaire consisted of three scales: place (functional dimension), place (preferred dimension) and process (environments). All items used in the questionnaire were locally experienced items by the elder (Table 2).
The questionnaire was initially designed in the Persian language and then checked by two experts in Persian lit-erature to assure cultural appropriateness. In addition, the questionnaire was piloted on a group of 18 older people, and modifications were made prior to the study.
As an initial instrument, the questionnaire of the frequency of use was devised based on a 5-point Likert-type scale (almost always, often, sometimes, seldom, and never) (Table 3). The reasons for select-ing this scale were its pivotal role in buildselect-ing the older peoples’ preferences in public spaces and its focus on dynamic interactions between people and the environment [20].
Questionnaire validation
After pilot testing and revisions of the questionnaire, a second pilot test was run on the intended respondents for initial validation among 42 elder people participated in the qualitative phase. After considering validity and reliability, the final version of the questionnaire was given to the specified sample of 350 respondents in two neighborhoods.
Questionnaires’validity
In this section three concepts of content, face, and con-struct validity are considered to investigate the question-naire validity.
Content validity
Lawshe’s method was adopted for content validity analysis by calculating the Content Validity Ratio (CVR) [14]. The questionnaire items were evaluated by a group of nine experts in landscape architecture, urban design, planning, and gerontology. The experts rated items either as essential, useful, or not necessary. A dichotomy was then devised from the 3-point rat-ing scale into essential, useful, and not necessary. The revised binomial probability distribution for Lawshe’s critical values was applied in excluded items rated as Table 1The participants’socio-demographic status who
attended the interview
Feature Participants (n= 54)
Age group 65–75: 28
75–85:26
Gender 29 F
25 M
Education level Undergraduate: 19
Graduate:18
Postgraduate:17
General Health perception (self–reported) Good Health: 24
Moderate Health:12
Poor Health:18
Socio- economic status Middle- High:28
not necessary [21]. A scale content validity index (S-CVI) was calculated for each scale by averaging the CVR for all the retained items in the scale [22, 23]. If CVI is higher than 0.9, it indicates excellent content validity at the scale level [22].
Face validity
Initially, 18 older people were asked whether there was any ambiguity in items of the questionnaire, and if any, the items were modified. In the quantitative phase, the impact score (frequency in importance) Table 2The extracted items from GT and literature reviewed during phase 1
Domains/ Categories Scales/ Subcategories
Personal characteristics (socioeconomic status) Age
Gender
Marital status
Occupation
Place (functional dimension) Density
Amenities (Access to services)
Safety (Traffic)
Aesthetics (design)
Landscaping
Comfort
Environmental cleanness (Visual, air, noise, pollution)
Place (preferred dimension) Security (Crime)
Security (Fear of falling)
Security (Fear of losing/ wayfinding)
Aesthetics (experienced environment)
Process (environments) Social environment
Cultural environment
Sense of belonging
Life satisfaction
Table 3The scales, items, and the number of items presented in the questionnaire
Domains Scales Number of items
PF: Place (functional dimension) Density 9
Amenities (Access to services) 10,11,12,13,14
Safety (Traffic) 15,16
Aesthetics (Objective) 26,27
Landscaping 30,31,32
Comfort 33,34,35,36
Environmental cleanness (Visual, air, noise, pollution) 37,38
PP: Place (preferred dimension) Security (Crime) 17,18,19
Security (Fear of falling) 20,21,22,23
Security (Fear of losing/ wayfinding) 24,25
Aesthetics (Subjective) 28,29
PE: Process (environments) Social environment 39,40,41,42
Cultural environment 43,44
Sense of belonging 45,46,47,48
was evaluated by nine experts considering difficulty, inappropriateness, and ambiguity of the phrases. Qualitative face validity was determined by a panel including three urban designers, three urban planners, two gerontologists and one epidemiologist. These spe-cialists evaluated the level of difficulty, inappropriate-ness, and ambiguity of the phrases. Their comments were used in the questionnaire.
The impact score was calculated for each question to determine the quantitative face validity (Eq. 1) [24]. For each of the 41 questions, a 5-point Likert scale was used to determine impact score. This scale range included strongly agree (score 5), agree (score 4), no idea (score 3), disagree (point 2), and strongly disagree (score 1). After completing the questionnaire by the target group (by 12 participants of FGD and 9 health expert), the face validity of the item was calcu-lated by using the impact score equation (Eq. 1). The impact scores equal to or greater than 1.5 are consid-ered appropriate [25].
Impact Score¼Frequencyð Þ%
Importance value ð1Þ
Construct validity
To examine the construct validity and internal consistency of the final questionnaire, a random sam-ple of 350 older peosam-ple (≥ 65 years old) from different public spaces in the selected district was invited to participate in answering the questionnaire in August and September of 2018. Stratified random sampling is used in this study to improve the representative ness of the sample. The population of the elders is divided into nine neighborhoods with different public spaces called sub-region and random samples are drawn from each of these public spaces (parks, community centres) in sub-regions. The time needed to complete the questionnaire was 30–40 min. Construct validity was determined by the Kaiser–Meyer– Olkin (KMO) value. The Bartlett’s test of sphericity was used to test the sampling adequacy and the strength of correla-tions between each scale item, respectively [26].
We applied Partial least squares (PLS) to test the con-ceptual model. PLS is useful in structural equation modeling for applied research projects, especially when the participants are limited with skewed data distribu-tion [27]. To measure the validity in PLS, the 3 indica-tors of Average Variance Extracted (AVE), Confirmatory Factor Analysis (CFA), and Fornel and Larker methods were adopted [28]. Fornel and Larker introduced the AVE criterion in 1981 to measure con-vergent validity and claimed that the critical number is 0.5. Any output of more than 0.5 indicates acceptable
convergence [28]. The AVE criterion indicates the shared average variance between any structures and the indices thereof, and the more the correlation, the greater the goodness-of-fit. Convergent validity was ap-plied as the substantial criterion as the goodness-of-fit measuring model in PLS.
Questionnaires’reliability
We evaluated the reliability of the questionnaire through internal consistent split-half reliability, composite reli-ability (CR), and item relireli-ability.
Split-half & internal consistency
The split-half method as an improvement method is used when it may not be possible to use the same test twice and to get an equivalent form of test espe-cially among older adults [29]. The items of a test were divided into two matched halves and, then, the score of the first half questions and that of the sec-ond half are calculated [30]. The split-half method cannot be applied with heterogeneous questionnaires, as the division of the questionnaire will not yield equivalent forms. In this situation (heterogeneous questionnaires), one may repeat questions through-out the questionnaire, while only the original ques-tion is kept in the final form [30].
In this study to divide the measuring instrument into two halves, the correlation coefficient was calcu-lated between scores of odd numbered and even numbered items based on Eq. 2. Coefficient α repre-sents the average of all possible split-half estimates.
Reliability coefficient¼ðCorrelation Coefficient2Þ= Correlation Coefficientþ1
ð Þ
ð2Þ
Composite reliability (CR)
A more up-to-date PLS criterion named “composite reliability” is applied in relation to coefficient α, as this criterion is introduced in1974 [31]. Here, the validity is measured in accordance with the correlations within, not in an absolute sense. Ac-cordingly, both of these criteria are applied to meas-ure validity in PLS more accurately. In case the CR volume for each structure is higher than 0.7, appro-priate internal stability is assured for the measuring methods [32].
Item reliability (factor loading)
its measuring error variance and that the validity of the measuring model is acceptable [33].
Results
Questionnaires development
In the first step, participants’ objective and subjective preferences were considered in a psychological process. Statements describing the preferences of older people were extracted from the interviews. At the initial stage, a total of 98 statements were extracted. After assessing contextual overlapping and closeness, they were reduced to 65 concepts, 15 subcategories, and three categories (Table2and Table13).
In the next step, the related terms were searched in Google Scholar, Science Direct, Sage, Wiley online, Springer, and Scopus. In total, in this context, 25 meas-uring tools were found while“Age-friendly Cities Check-list of Essential Features” and “AARP Livable Communities” had the most appropriate statements [8]. From these two questionnaires, eight appropriate con-cepts corresponding to the extracted qualities of the sub-components were extracted.
Then, we combined all as 73 concepts (65 from the interviews and 8 from the literature review) and were assessed again for closeness, similarities, and relativeness. Factors with conceptual similarity and overlaps were eliminated, reducing the concepts to 40 statements. The environmental properties of the older people were categorized and the questionnaire with a Likert-type scale response was constructed as follows:
– Statements in the first person singular, with a true and false response range. For instance, the signs and the buildings’ façade in the
neighborhood assist me to find my way (strongly disagree, somewhat disagree, neither agree nor disagree, somewhat agree, strongly agree). – Statements in the first person singular, with a
range from none to many. For example, the path on the sidewalk from my home to the bus/ subway is comfortable (always, very frequently, rarely, very rarely, never).
– Statements in second person singular such as the possibility of seeing friends per week (very high, above average, average, below average, and very low). – Question statements such as how clean is the air
and is it good for taking a walk? (Excellent, above average, average, below average, and very poor).
Finally, a 5-scale questionnaire was developed to assess and validate the temporal stability (always, very fre-quently, rarely, very rarely, and never) (Table14).
Questionnaire’s validation Demographic variables analysis
A total of randomly selected 350 older people from public spaces of Tehran 10th municipality region. This region is claimed partially as the highest popu-lated region with the most the elder population in Tehran. According to the low area of residential set-telments in this region, the majority of the older adults use neighborhoods’ public spaces [34].
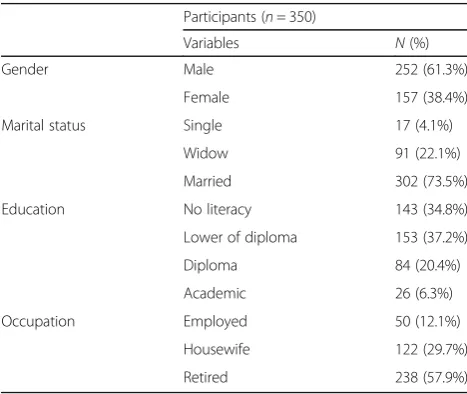
Their mean (SD) age was 76.3 ± 9.2 years, and 61.3% of the total participants were male, 73.5% were married, and 27.2% had not finished high school. Table 4 showes the summary of participants’ demographic information for the questionnaire valid-ation phase.
Questionnaires’validity
Content validity and face validity
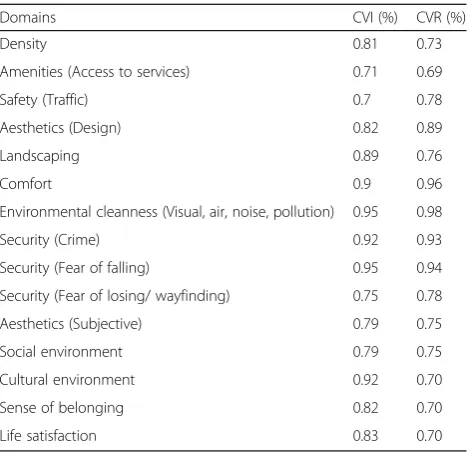
The Lawshe method of content validation was used to validate the questionnaire and showed the content index and validity ratio of 0.82 and 0.79, respect-ively. According to Lawshe, the minimum acceptable CVR is 0.78 and CVI ≥0.82 [14]. However, if a ques-tion has a value < 0.78 and the mean of judgments > 1.50, it is acceptable. Moreover, face validity with the impact score of 1.8 is considered appropriate. Table 5 indicates the content validity of domains used in the questionnaire. Construct Validity:
The construct validity of all the respondents was analyzed using CFA. To extract the underlying fac-tors, the principal component analysis was run through varimax rotation. The sampling adequacy and sphericity were tested using KMO and Bartlett’s
Table 4The participants’demographic information in quantitative phase
Participants (n= 350)
Variables N(%)
Gender Male 252 (61.3%)
Female 157 (38.4%)
Marital status Single 17 (4.1%)
Widow 91 (22.1%)
Married 302 (73.5%)
Education No literacy 143 (34.8%)
Lower of diploma 153 (37.2%)
Diploma 84 (20.4%)
Academic 26 (6.3%)
Occupation Employed 50 (12.1%)
Housewife 122 (29.7%)
test, respectively. The findings indicated strong sig-nificance for Bartlett’s test (x = 9951 and p< 0.001). Moreover, the KMO value was measured to be 0.88, indicating that the correlations among the items of each scale were sufficiently strong for the factor ana-lysis [26, 35].
The AVE and Fornel and Larker methods were ap-plied to measure validity, and the findings are pre-sented in Table 6. In this study, the AVE for all variables was more than 0.5 (Table 6), which showed the convergent validity (CV) [26, 35].
As observed in Tables 7 and 8, all relationships were statistically significant because of their abso-lute value, which was less than 1.69. The factor loadings and the path coefficients, > 0.4, showed that the analyzed variables had acceptable validity (Tables 7 and 8).
The third method for assessing validity is Fornell - Larker’s method, which analyzes convergence val-idity. Results showed that the AVE value for the main matrix diameter was more than its lower num-ber of the main dimension, thus convergent validity was confirmed [28] (Table 9).
Questionnaires’reliability
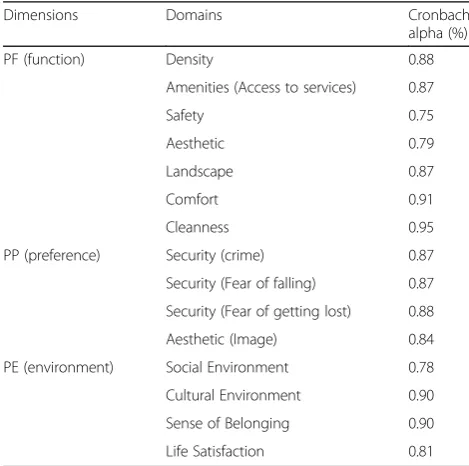
The composite reliability (CR) was measured in PLS. Results showed that the Cronbach’s alpha was 0.81, the Spearman-Brown coefficient 0.72, and the Gutt-man split-half coefficient 0.73, suggesting high stabil-ity and internal consistency of the items. Table 10 showes the the validate Cronbach alpha for each item. Moreover, Table 11 indicates the validate composite reliability (CR) for both Older people preferences and Place in developed questionnaire. In this context, scores were calculated and the correlation between scores for both measurement times was determined using the Spearman correlation coefficient, revealing 0.85 at p < 0.001. As the observed results were less than 0.7, thus appropriate stability was approved for all variables.
Table 5The content validity of domains used in the questionnaire
Domains CVI (%) CVR (%)
Density 0.81 0.73
Amenities (Access to services) 0.71 0.69
Safety (Traffic) 0.7 0.78
Aesthetics (Design) 0.82 0.89
Landscaping 0.89 0.76
Comfort 0.9 0.96
Environmental cleanness (Visual, air, noise, pollution) 0.95 0.98
Security (Crime) 0.92 0.93
Security (Fear of falling) 0.95 0.94
Security (Fear of losing/ wayfinding) 0.75 0.78
Aesthetics (Subjective) 0.79 0.75
Social environment 0.79 0.75
Cultural environment 0.92 0.70
Sense of belonging 0.82 0.70
Life satisfaction 0.83 0.70
Table 6The validity of AWE on older people preferences and place attributes
Variables AVE
Older people preferences 0.7844
Place 0.8240
Table 7The factor loading calculated for the subcategories of PF, PP, and PE
Older peoples’preferences Factor
Loading
Place Function (PF) Density 0.8849
Amenities (Access to services) 0.8864
Safety (Traffic) 0.5679
Aesthetics (Objective) 0.5938
Landscaping 0.7277
Comfort 0.6552
Environmental cleanness (Visual, air, noise, pollution)
0.6903
Place Preferences (PP) Security (Crime) −0.2212
Security (Fear of falling) 0.6091
Security (Fear of losing/ wayfinding) 0.3721
Aesthetics (Subjective) 0.5368
Place Environment (PE) Social environment 0.743
Cultural environment 0.7908
Sense of belonging 0.4175
Life satisfaction 0.5111
Table 8The results of factor loadings and path coefficient for the place and older people preferences and three dimensions of PF, PP, and PE
Path coefficients (factor loading)
PLACE - > Older peoples’preferences 0.548
PF - > Older peoples’preferences 0.315
PF - > Place 0.576
PE - > Older peoples’preferences 0.578
PP - > Older peoples’preferences 0.276
Discussion
This study reported the development and validation of an older people-friendly public space tool as a measure based on the perceived and preferred out-door urban environment in a special context. This type of instrument fills important research and imple-mentation gaps to define the older people needs and expectations of active living. The study highlighted that this developed tool would be suitable for the as-sessment of public spaces based on adults’ preferences.
Results of the present study indicate that public spaces evaluation scale incorporate density, amenities (access to services), safety aesthetic (design), landscap-ing, comfort, cleanness, security (from crime), security (fear of falling), security (fear of getting lost), aes-thetic (image), social environment, cultural environ-ment, sense of belonging, and life satisfaction. These indicators are useful in assessing the older peoples’ perception of age-friendly environments in urban neighborhoods in Tehran.
Public places are important for older people’s health and thus it is important to understand which aspects of built and social environments are essential in im-proving the use of public spaces with the view of pro-moting active aging and aging in place. Creation of age-friendly active living cities has increasingly been recognized as an important health policy strategy and require robust new methods that are suitable for intersectoral actions and transdisciplinary approaches [36]. Implementation of such methods promotes the participation of adults in public spaces and their in-volvement in urban planning and design [37].
The scales and dimensions for all the constructs measured in the questionnaire met the standard cri-teria for excellent content validity [22]. CVR and CVI validity indices were in line with the existing litera-ture [38]. The results of construct validity revealed an appropriate correlation between extracted items; however, the multidimensionality of different scales was observed. The observed dimensions or subscales were in parallel with the content of the urban design guidelines examined. The experiences about density, amenities (access to services), safety (traffic), aesthetics (design), landscaping, comfort, and environ-mental cleanness (visual, air, noise, pollution) were measured through place function dimension. Adher-ence to security (crime), security (fear of falling), se-curity (fear of losing/wayfinding), and aesthetics (image) was evaluated using place preference scale. Social environment, cultural environment, sense of belonging, and life satisfaction were measured using process scale. Also, age, gender, marital status, occu-pation, and education were measured using person statues scale [38, 39].
The findings are compatible with those of previ-ous studies, as all of those attributes that can Table 9The discriminant validity of Fornell-Larcker test for the main domain of the questionnaire
Older people preferences
Place PF PE PP
Older people preferences 1 0 0 0 0
Place 0.8753 1 0 0 0
PF 0.8639 0.9272 1 0 0
PP 0.7414 0.9052 0.697 0.4703 1
PE 0.8887 0.5655 0.5767 1 0
Table 10The Cronbach Alpha for the extracted dimensions
Dimensions Domains Cronbach
alpha (%)
PF (function) Density 0.88
Amenities (Access to services) 0.87
Safety 0.75
Aesthetic 0.79
Landscape 0.87
Comfort 0.91
Cleanness 0.95
PP (preference) Security (crime) 0.87
Security (Fear of falling) 0.87
Security (Fear of getting lost) 0.88
Aesthetic (Image) 0.84
PE (environment) Social Environment 0.78
Cultural Environment 0.90
Sense of Belonging 0.90
Life Satisfaction 0.81
Table 11-Reliability indicator tested for older people preferences and place attributes
Variables Cronbach’sα CR
Older people preferences 0.725 .879
compromise the basic qualities of public spaces are partially dependent on characteristics of the physical environment. However, they are also influenced by “soft” aspects of the environment and can signifi-cantly add or detract from the incentives and sub-jective experience of a particular public space. Furthermore, the findings of this study fit well with the 4 main features of Pikora conceptual framework for assessing environmental determinants of active travel functionality, safety, aesthetics, and destina-tions, and reviews [40].
WHO defines age-friendly outdoor spaces as public spaces that have the following criteria: clean and pleasant; sufficient green spaces and landscape; well-maintained and safe; well-well-maintained pavements; free of obstructions; non-slip pavements; comfortable for wheelchairs; accessible and safe design for traffic and pedestrians at intersections and pedestrian crossings; street lighting; and police patrols and community education [8]. “Livable Communities: An Evaluation Guide” claims that walkable communities improve active aging. The required indicators are designing high-quality sidewalks and their maintenance, traffic signals, pedestrian amenities, safety and security (lighting, sight Lines, eye/ear isolation, entrapment areas, escape routes, sense of ownership/mainten-ance, and police services) [41].
Analysis of item-to-total correlation confirmed that each item belonged to its corresponding subscale. The internal consistency analysis with Cronbach’s α revealed an acceptable level of internal consistency for the total scales and subscales identified through factor analysis for PF, PP, and PE domains. Although certain subscales have moderate alpha values, the Cronbach’s α, within 0.5 and 0.8 range, has been re-ported in the literature [38].
Furthermore, the moderate Cronbach’s α for items in each scale or subscale indicates that items are in-terrelated with little redundancy [42]. Thus, each item in each scale measures something different. The low inter-item correlation indicates lower homogen-eity, which is preferable, particularly for application in areas of motivation and personality, and is the case in this questionnaire [42].
In terms of temporal stability, the scores for all the retained items in the different scales and subscales in-dicated a level of good to excellent stability [43]. The results for the temporal stability of the current scales corresponded to the reliability results of the age-friendly public spaces of WHO checklist and livable communities [6, 44].
Age-friendly community initiatives have excellent opportunities to combine the advantages of qualita-tive and quantitaqualita-tive methods to conduct a baseline
assessment that is comprehensive and representative of the diverse older adult population. Therefore, this study has provided the first validated psychometric tool for assessing older peoples’ preferences in public spaces as age-friendly public places in Iran. The re-sults indicated that the developed scales are valid and reliable to measure the corresponding constructs on a constant basis.
This tool includes items that are interrelated within each scale or subscale, as measured by Cronbach’s α statistic, with little redundancy. This tool measures the type and level of the likability of public places in the older peoples’ perspective. Further, it can measure the environmental potential to encourage older people to spend more time in outdoor spaces.
In summary, through analyzing older peoples’ ex-perience we have developed tools to measure the pos-sibility and concreteness of age-friendly environment at micro, meso, and macro scales. The extracted com-ponents from qualitative studies have led to develop-ing a psychometrical tool to measure the validity and stability of age-friendly public spaces based on the older peoples’ experience fit for local communities. We have shown the robustness of this method by sys-tematically examining the validity and reliability thus such methodology can be adopted in various commu-nities in understanding of how best to create age-friendly urban spaces to promote active aging.
This study, however, has several limitations. First, the questionnaire does not include all the proposed dimen-sions of the elders’ preferences of desired public spaces because of integration of all dimensions could result in developing an instrument with many items, making it very challenging to be applyed for the seniors. Second, the validity and reliability of the questionnaire were tested in only one region in Tehran as known to como-date the highest rate of older adult in Tehran. Therefore, it strongly advises that the generalization of the findings should be done with caution. Third, the sample size was about 350 peolple which is recommended for more than 480 older people to validate this questionnaire. Finally, most of recruited participants in qualitative phase had high education to be more familiar in interviewing process. More studies are required to refine items and generalize the findings to other industries or organiza-tions. In addition, another limitation of this study is that no bias analysis was performed between the participants.
Conclusions
Appendix
Table 12Survey questions in phase 1
1. Gender
2. Education level
3. Income level
4. Address (as in neighborhood only)
5. How frequent do you visit public places?
6. How much time approximately do you spend on each visit?
7. What makes this place special or likable?? If likable why?
8. Why do you like this place?
9. What do you like about this place?
10. What needs to be improved?
11. What are the contributions of the visiting public spaces to your life?
Table 13Concepts and Subcategories of Age-Friendly Public Spaces by Interviewees
Category: Place Category: Process
Functional Dimension Preference Dimension Social Dimension Cultural Dimension Sense of Belonging
Life Satisfaction
Low density Proper walking path Sanitary service Closeness to home
Easy commute to and from home Appropriate urban furniture Safety traffic signs
Establish library for the older people Chess game
Indoor space Protection from cold Sporting equipment
Safety Security
Relatively low population Congestion Need for space to sit
Need for a hangout
Need for environmental comfort Need for illuminate (Natural or artificial) Need for cleanness
Need for tidiness Need for law and order Need for calmness
Need to be safe from possible harms due to children’s play
Noise pollution (non-traffic) Need to separate older peoples’zone from the children’s game yards Noise pollution
Need for proper pavement, not slippery Civic misdemeanor, improper behavior Civic misdemeanor, motor-bike in the park
Civic misdemeanor, having pets in the park
Need for security (without a police) Need for security (due to presence of too many rascals)
Green space Plant and water Tree
Cosines Openness Low enclosure Spatial variety Past memories Traditional design and old moments Sense of richness in hearing Presence of artists, poet, Iranian idioms Public memories (sticking to old names) Need for space aesthetics Legibility
Not falling Pavement Security
Familiarity No crime No theft No graffiti No incivility Easy to wayfinding Order and symmetric design
Good pavement No slippery Surface No nuisance
Social interaction Friends and next of kin
Social wealth Social strata (good people) Foreigner hater No street vendors Home space satisfaction
Segregated space for female and male Segregate space for older peoples and house pets
Keep old memories Old habits Friendly relations Social capital Social relations
Sense of home Filling
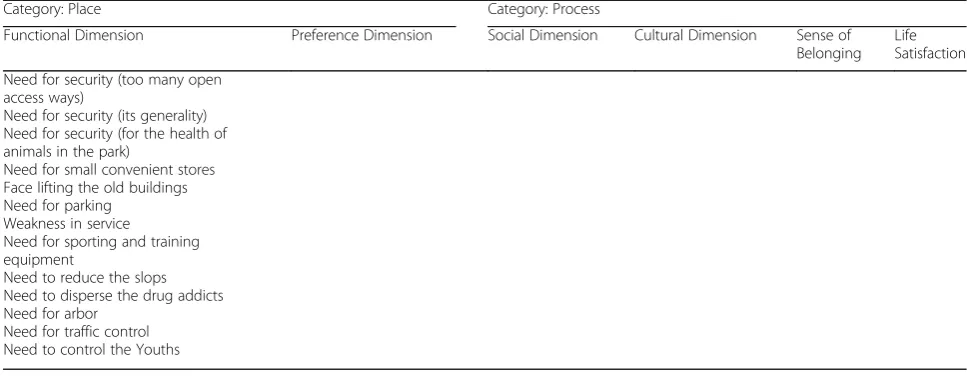
Table 13Concepts and Subcategories of Age-Friendly Public Spaces by Interviewees(Continued)
Category: Place Category: Process
Functional Dimension Preference Dimension Social Dimension Cultural Dimension Sense of Belonging
Life Satisfaction
Need for security (too many open access ways)
Need for security (its generality) Need for security (for the health of animals in the park)
Need for small convenient stores Face lifting the old buildings Need for parking
Weakness in service
Need for sporting and training equipment
Need to reduce the slops Need to disperse the drug addicts Need for arbor
Need for traffic control Need to control the Youths
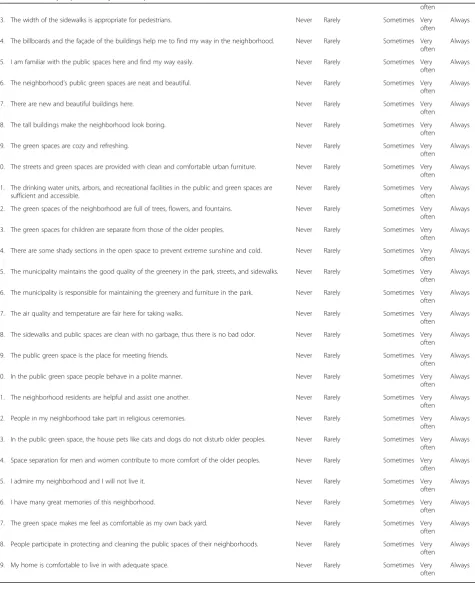
Table 14Older people-Friendly Public Space Questionnaire
1. Age
2. Marital status Single widowed Married
3. Education level Illiterate lower than High
school
Diploma University
4. Monthly expenses
5. Occupation: 1-Employed, 2- Housewife, 3-Retired
6. How long have you lived in this neighborhood?
7. Address: Ave., St., Alley?
8. Why did you choose this neighborhood for living?
9. The congestion in the streets and public spaces prevent my walk. Never Rarely Sometimes Very
often
Always
10. Access to the store, bank, mosque, pharmacy, clinic from my home is an easy walk. Never Rarely Sometimes Very
often
Always
11. Access to path to bus-stop and metro-station is easy. Never Rarely Sometimes Very
often
Always
12. There are sufficient and clean public sanitary services in the green space of the neighborhood. Never Rarely Sometimes Very
often
Always
13. The neighborhood streets have sufficient sidewalks for pedestrians. Never Rarely Sometimes Very
often
Always
14. There is only one park and green space close to my house. Never Rarely Sometimes Very
Often
Always
15. The speed of motor bikes and automobiles in the streets and cross roads of the neighborhood is low, thus walking is safe.
Never Rarely Sometimes Very
often
Always
16. The pedestrian signs, street lines, and lights are helpful. Never Rarely Sometimes Very
often
Always
17. The streets of the neighborhood are well-lit. Never Rarely Sometimes Very
often
Always
18. The lighting in the neighborhood’s green space is sufficient. Never Rarely Sometimes Very
often
Always
19. The public and green space here is safe and there are no drug dealers. Never Rarely Sometimes Very
often
Always
20. The street and green space sidewalks are smooth with no cracks or holes. Never Rarely Sometimes Very
often
Always
21. The sidewalks’slopes are acceptable. Never Rarely Sometimes Very
often
Always
Table 14Older people-Friendly Public Space Questionnaire(Continued)
often
23. The width of the sidewalks is appropriate for pedestrians. Never Rarely Sometimes Very
often
Always
24. The billboards and the façade of the buildings help me to find my way in the neighborhood. Never Rarely Sometimes Very
often
Always
25. I am familiar with the public spaces here and find my way easily. Never Rarely Sometimes Very
often
Always
26. The neighborhood’s public green spaces are neat and beautiful. Never Rarely Sometimes Very
often
Always
27. There are new and beautiful buildings here. Never Rarely Sometimes Very
often
Always
28. The tall buildings make the neighborhood look boring. Never Rarely Sometimes Very
often
Always
29. The green spaces are cozy and refreshing. Never Rarely Sometimes Very
often
Always
30. The streets and green spaces are provided with clean and comfortable urban furniture. Never Rarely Sometimes Very
often
Always
31. The drinking water units, arbors, and recreational facilities in the public and green spaces are sufficient and accessible.
Never Rarely Sometimes Very
often
Always
32. The green spaces of the neighborhood are full of trees, flowers, and fountains. Never Rarely Sometimes Very
often
Always
33. The green spaces for children are separate from those of the older peoples. Never Rarely Sometimes Very
often
Always
34. There are some shady sections in the open space to prevent extreme sunshine and cold. Never Rarely Sometimes Very
often
Always
35. The municipality maintains the good quality of the greenery in the park, streets, and sidewalks. Never Rarely Sometimes Very
often
Always
36. The municipality is responsible for maintaining the greenery and furniture in the park. Never Rarely Sometimes Very
often
Always
37. The air quality and temperature are fair here for taking walks. Never Rarely Sometimes Very
often
Always
38. The sidewalks and public spaces are clean with no garbage, thus there is no bad odor. Never Rarely Sometimes Very
often
Always
39. The public green space is the place for meeting friends. Never Rarely Sometimes Very
often
Always
40. In the public green space people behave in a polite manner. Never Rarely Sometimes Very
often
Always
41. The neighborhood residents are helpful and assist one another. Never Rarely Sometimes Very
often
Always
42. People in my neighborhood take part in religious ceremonies. Never Rarely Sometimes Very
often
Always
43. In the public green space, the house pets like cats and dogs do not disturb older peoples. Never Rarely Sometimes Very
often
Always
44. Space separation for men and women contribute to more comfort of the older peoples. Never Rarely Sometimes Very
often
Always
45. I admire my neighborhood and I will not live it. Never Rarely Sometimes Very
often
Always
46. I have many great memories of this neighborhood. Never Rarely Sometimes Very
often
Always
47. The green space makes me feel as comfortable as my own back yard. Never Rarely Sometimes Very
often
Always
48. People participate in protecting and cleaning the public spaces of their neighborhoods. Never Rarely Sometimes Very
often
Always
49. My home is comfortable to live in with adequate space. Never Rarely Sometimes Very
often
Abbreviations
AVE:Average variance extracted; CFA: Confirmatory factor analysis; CR: Composite reliability; CVI: Content validity index; CVR: Content validity ratio; FGD: Focus Group Discussion; GT: Grounded Theory; KMO: Kaiser– Meyer–Olkin; PLS: Partial least squares; WHO: World Health Organization
Acknowledgements
All the authors wish to express their gratitude to department of Cultural & Social & affairs located in Distric 10 of Tehran Municipality.
Authors’contributions
AL and RA carried out interview and focuse groups discussion. AL and HRB performed all statistical analyses, interpreted the results, and wrote the paper. PKM contributed to interpret the results and revising the paper. All authors read and approved the final manuscript.
Funding
There is no funding in this study.
Availability of data and materials
An anonymized dataset is available by request from corresponding author.
Ethics approval and consent to participate
This research was approved by theIran University of Medical Sciences Ethical Review Board(Ethics Code Number; IR.IUMS.REC.1397.148). All participants agreed to be interviewd in this study and verbal consent was obtained.
Consent for publication Not applicable.
Competing interests
The authors declare that they have no competing interests.
Author details
1Faculty of Architecture and Urban Planning, Shahid Beheshti University, Tehran, Iran.2Faculty of Fine Arts, University of Tehran, Tehran, Iran. 3Department of Epidemiology, School of Public Health, Iran University of Medical Sciences, Tehran, Iran.4Ageing Clinical & Experimental Research Team, Institute of Applied Health Sciences, University of Aberdeen, Aberdeen, Scotland, UK.
Received: 21 June 2019 Accepted: 12 November 2019
References
1. World Health Organization. World report on ageing and health 2015. Genève: WHO; 2015.
2. World Health Assembly, 69. Multisectoral action for a life course approach to healthy ageing: draft global strategy and plan of action on ageing and health: report by the Secretariat. World Health Organization; 2016.https:// apps.who.int/iris/handle/10665/252671.
3. Yen IH, Fandel Flood J, Thompson H, Anderson LA, Wong G. How design of places promotes or inhibits mobility of older adults: realist synthesis of 20 years of research. J Aging Health. 2014;26(8):1340–72.
4. Yung EH, Conejos S, Chan EH. Social needs of the elderly and active aging in public open spaces in urban renewal. Cities. 2016;52:114–22.
5. Pleson E, Nieuwendyk LM, Lee KK, Chaddah A, Nykiforuk CI, Schopflocher D. Understanding older adults’usage of community green spaces in Taipei, Taiwan. Int J Environ Res Public Health. 2014;11(2):1444–64.
6. Dellamora MC, Zecevic AA, Baxter D, Cramp A, Fitzsimmons D, Kloseck M. Review of assessment tools for baseline and follow-up measurement of age-friendliness. Ageing Int. 2015;40(2):149–64.
7. Yung EH, Conejos S, Chan EH. Public open spaces planning for the elderly: the case of dense urban renewal districts in Hong Kong. Land Use Policy. 2016;59:1–11.
8. World Health Organization. Global age-friendly cities: a guide. Genève: WHO; 2007.
9. Kalache A, Gatti A. Active ageing: a policy framework. Adv Gerontol. 2003;11:7–18.
10. Michael YL, Green MK, Farquhar SA. Neighborhood design and active aging. Health Place. 2006;12(4):734–40.
11. Paisana-Morais V, Bispo S, Encantado J, Carvalho C. Acessibilidade pedonal percebida em maiores de 65 anos: instrumento de avaliação. Psicologia, Saúde & Doenças. 2014;15(1):25–35.
12. Almeida MF. Age-friendly Walkable urban spaces: a participatory assessment tool. J Hous Elder. 2016;30(4):396–411.
13. Waltz CF, Bausell BR. Nursing research: design statistics and computer analysis: Davis FA; 1981.
14. Lawshe CH. A quantitative approach to content validity 1. Pers Psychol. 1975;28(4):563–75.
15. Corbin J, Strauss A, Strauss AL. Basics of qualitative research: sage; 2014. 16. Beck CT. Qualitative research: the evaluation of its credibility, fittingness, and
auditability. West J Nurs Res. 1993;15(2):263–6.
17. Lincoln YS. Emerging criteria for quality in qualitative and interpretive research. Qual Inq. 1995;1(3):275–89.
18. Schwandt TA, Lincoln YS, Guba EG. Judging interpretations: but is it rigorous? Trustworthiness and authenticity in naturalistic evaluation. N Dir Eval. 2007;2007(114):11–25.
19. Gehl J, Svarre B. How to study public life: island press; 2013.
20. Mohammadi E, Allahyari T, Darvishpoor Kakhaki A, Saraei H. Determining psychometric properties of Iranian active aging measurement instrument. Iran J Ageing. 2018;12(4):414–29.
21. Ayre C, Scally AJ. Critical values for Lawshe’s content validity ratio: revisiting the original methods of calculation. Meas Eval Couns Dev. 2014;47(1):79–86. 22. Polit DF, Beck CT. The content validity index: are you sure you know what's
being reported? Critique and recommendations. Res Nurs Health. 2006; 29(5):489–97.
23. DeVon HA, Block ME, Moyle-Wright P, Ernst DM, Hayden SJ, Lazzara DJ, et al. A psychometric toolbox for testing validity and reliability. J Nurs Scholarsh. 2007;39(2):155–64.
24. Neuendorf KA. The content analysis guidebook: sage; 2016.
25. Lacasse Y, Godbout C, Series F. Health-related quality of life in obstructive sleep apnoea. Eur Respir J. 2002;19(3):499–503.
26. Pett MA, Lackey NR, Sullivan JJ. Making sense of factor analysis: the use of factor analysis for instrument development in health care research: sage; 2003. 27. Wong KK-K. Partial least squares structural equation modeling (PLS-SEM)
techniques using SmartPLS. Mark Bull. 2013;24(1):1–32.
28. Fornell C, Lacker D. Evaluating structural equation modeling for travel behavior research. Transportation Res B Univ Mich. 1981;37:1–25. 29. Smith G, Del Sala S, Logie RH, Maylor EA. Prospective and retrospective
memory in normal ageing and dementia: a questionnaire study. Memory. 2000;8(5):311–21.
30. Del Greco L, Walop W, McCarthy RHJCCMAJ. Questionnaire development: 2. Validity Reliability. 1987;136(7):699.
31. Werts CE, Linn RL, Jöreskog KG. Intraclass reliability estimates: testing structural assumptions. Educ Psychol Meas. 1974;34(1):25–33.
32. Nunnally J, Bernstein I. Psychometric theory McGraw-hill new York Google scholar; 1978.
33. Rivard S, Huff SL. Factors of success for end-user computing. Commun ACM. 1988;31(5):552–61.
34. Rashedi V, Asadi-Lari M, Foroughan M, Delbari A, Fadayevatan R. Prevalence of disability in Iranian older adults in Tehran, Iran: a population-based study. J Health Soc Sci. 2016;1(3):251–62.
35. Lak A, Aghamolaei R, Azizkhani E. From segregation to integration of new developments in historic contexts: rural texture in Iran. J Settlements Spat Plann. 2018;9(1):59–66.
36. Sallis JF, Cervero RB, Ascher W, Henderson KA, Kraft MK, Kerr J. An ecological approach to creating active living communities. Annu Rev Public Health. 2006;27:297–322.
37. Buffel T, Phillipson C, Scharf T. Ageing in urban environments: developing ‘age-friendly’cities. Crit Soc Policy. 2012;32(4):597–617.
38. Ruza J, Kim JI, Leung I, Kam C, Ng SYM. Sustainable, age-friendly cities: An evaluation framework and case study application on Palo Alto, California. Sustain Cities Soc. 2015;14:390–6.
39. Annear M, Keeling S, Wilkinson T, Cushman G, Gidlow B, Hopkins H. Environmental influences on healthy and active ageing: a systematic review. Ageing Soc. 2014;34(4):590–622.
40. Pikora T, Giles-Corti B, Bull F, Jamrozik K, Donovan R. Developing a framework for assessment of the environmental determinants of walking and cycling. Soc Sci Med. 2003;56(8):1693–703.
42. Panayides P. Coefficient alpha: interpret with caution. Eur J Psychol. 2013; 9(4):687–96.
43. Fleiss JL. Design and analysis of clinical experiments: John Wiley & Sons; 2011.
44. Kano M, Rosenberg PE, Dalton SD. A global pilot study of Age-Friendly City indicators. Soc Indic Res. 2018;138:1205.
Publisher’s Note