R E S E A R C H A R T I C L E
Open Access
Item response analysis of the Geriatric
Anxiety Inventory among the elderly in
China: dimensionality and differential item
functioning test
Zhongquan Li
1*, Xia Zhao
1, Ang Sheng
1and Li Wang
2,3Abstract
Background:Anxiety symptoms are pervasive among elderly populations around the world. The Geriatric Anxiety
Inventory (the GAI) has been developed and widely used in screening those suffering from severe symptoms. Although debates about its dimensionality have been mostly resolved by Molde et al. (2019) with bifactor modeling, evidence regarding its measurement invariance across sex and somatic diseases is still missing.
Methods:This study attempted to provide complemental evidence to the dimensionality debates of the GAI with
Mokken scale analysis and to examine its measurement invariance across sex and somatic diseases by conducting differential item functioning (DIF) analysis among a sample of older Chinese adults. The data was from responses of a large representative sample (N= 1314) in the Chinese National Survey Data Archive, focusing on the mental health of elderly adults.
Results:The results of Mokken scale analysis confirmed the unidimensionality of the GAI, and DIF analysis indicated measurement invariance of this inventory across individuals with different sex and somatic diseases, with just a few items exhibiting item bias but all of them negligible.
Conclusions:All these findings supported the use of this inventory among Chinese elders to screen anxiety symptoms and to make comparisons across sex and somatic diseases.
Keywords:Geriatric anxiety inventory, Mokken scale technique, Differential item functioning, Dimensionality
Background
As the geriatric population increases, mental health of the elderly gains more and more substantial concerns, such as depression and anxiety. Prevalence estimates of anxiety disorders ranged from 3.2 to 14.2% in Switzerland and France, as reported in a comprehensive review of geriatric anxiety disorders [1]. Moreover, a sur-vey in one city in China, Chongqing, indicated that 21.63% of older people suffered anxiety, especially among those with physical illness [2]. Though anxiety disorders are highly prevalent among older adults, screening instruments for the aged leave much to be
desired [3]. Besides confusion with other disorders [4], cognitive deficits and somatic symptoms account to-gether for the unsatisfactory validity of most measures [5, 6]. To overcome the above deficiencies, Pachana et al. developed the Geriatric Anxiety Inventory (GAI), especially for older populations [3].
The Geriatric Anxiety Inventory only has 20 brief items and facilitates studies regarding anxiety disorders of the elderly prominently. It features a dichotomous and single direction response format, which can decrease the cognitive load of respondents. It also involves min-imal somatic symptoms, which helps distinguish mental disorders from somatic diseases [3]. Numerous studies have provided strong evidence for its desirability, with internal consistency ranging from 0.91 to 0.95 [3, 7], test-retest reliability ranging from 0.91–0.99 [3, 8] and
© The Author(s). 2019Open AccessThis article is distributed under the terms of the Creative Commons Attribution 4.0 International License (http://creativecommons.org/licenses/by/4.0/), which permits unrestricted use, distribution, and reproduction in any medium, provided you give appropriate credit to the original author(s) and the source, provide a link to the Creative Commons license, and indicate if changes were made. The Creative Commons Public Domain Dedication waiver (http://creativecommons.org/publicdomain/zero/1.0/) applies to the data made available in this article, unless otherwise stated. * Correspondence:[email protected]
1School of Social and Behavioral Sciences, Nanjing University, 163 Xianlin
Avenue, Qixia District, Nanjing 210023, Jiangsu, China
good convergent validity [3, 9]. For probing DSM-IV Generalized Anxiety Disorder (GAD), a cut-point of 10/11 in the Geriatric Anxiety Inventory had a specificity of 84% and a sensitivity of 75, and 83% of patients were correctly classified [3]. In another study, an optimal cutoff of 9 was suggested, which had a 100% sensitivity and a 60% specifi-city, with 65% of participants correctly classified [10]. In short, the psychometric properties of GAI were proven to be excellent, which made it a promising screening and as-sessment of anxiety among the elderly.
Factor structure is essential in understanding, scoring, and interpreting the responses on the GAI [11]. The GAI was de-veloped as a measure of a unidimensional construct [3,12]. However, researchers have not reached a consensus on the factor structure of this instrument. The one-factor model was confirmed by Johnco et al. among 256 community-dwelling old adults in Australia [13], among older people liv-ing in Beijliv-ing communities [14] and among institutionalized old population in Portugal using both exploratory factor ana-lysis (EFA) and confirmatory factor anaana-lysis (CFA) [15]. The unidimensionality was further supported by Molde et al. among psychogeriatric mixed in-and-out Norwegian patients using the bifactor analysis [11]. Although the one-factor model obtained most empirical support, two-, three-, and four-factor solutions also emerged in the current literature. A two-factor model was proposed by Ribeiro et al. based on the principal component analysis with varimax rotation on responses from a mixed sample of community-dwelling and clinical old adults [16]. Bendixen et al. found a similar two-factor solution among a sample of elderly with depression, dementia, or psychosis [17]. A three-factor model was first proposed by Márquez-González et al. among 302 old adults living in Spanish communities using principal-components analysis with varimax rotation [18]. Guan also obtained a similar three-factor among 1318 old adults living in Beijing communities with the same method [19]. Finally, a four-factor model was proposed by Diefenbach et al. among a mixed sample of 140 clinical and non-clinical old partici-pants using principal components analysis [20]. These incon-sistent findings regarding dimensionality of the GAI can be partly attributed to the analytic methods chosen: Traditional factorial analysis methods such as exploratory factor analysis (EFA) and principal components analysis (PCA) are mainly employed in those studies, and these methods may result in distorted results due to small size and unsatisfied assump-tions [21,22]. More recently, Molde et al. [23] resolved de-bates about the factor structure of the GAI with bifactor modeling in an extensive dataset with 3731 older adults from 10 national samples and found a primary unidimensional general factor of the GAI across nations.
Mokken scale analysis (MSA), a more sophisticated tool based on nonparametric item response theories, has been proposed to assess dimensionality [24, 25]. It is developed on the basis of the Guttman scaling model, which assumes
that scale items are hierarchically ordered along levels of a latent construct. It is less restrictive concerning statistical as-sumptions and sample size than IRT models, such as Rasch model and logistic models. Compared to traditional factorial analysis, MSA has advantages in conducting dimensionality investigation and model evaluation at the same time, avoid-ing“difficult factors”and distortions due to item-score dis-tributions. It is a better fit for discrete data sets [22]. The most general Mokken model, monotone homogeneity model (MHM) assumes unidimensionality, local independ-ence, and latent monotonicity [24]. Moreover, the unidi-mensionality assumption of MHM contributed precisely to test the latent structure of an inventory through automated item selection procedure (AISP) [26,27]. In a scale formed by Mokken analysis, the sum score of all items can be used as the indicator of the latent trait [24]. It is worth noting that the scale score is ordinal in nature, but it can be interpreted and used as interval values if ordinal transformations have no severe impact on the substantive interpretations of fur-ther statistical analyses [28]. Our study would adopt this method to provide complemental evidence to studies on the factor structure of the GAI.
Different groups of people may have different expressions of anxiety and depression. Previous studies indicated that fe-males tended to report more anxiety symptoms than fe-males did [29,30], but this gender difference disappeared with age increasing [31]. However, before coming to these conclusions, measurement invariance needs to be justified: this instrument must measure the same anxiety symptom of the same extent in all groups [32]. Several researchers have realized the prob-lem. They examined measurement invariance across sex and ages and found no item bias existed [11,13,33]. When devel-oping the international translations of the GAI, researchers often have difficulties in finding the exact corresponding words in their languages. For example, the Portuguese version [16], the Spanish version [18], and the Chinese version [34] have different translations of the item “I have butterflies in my stomach” with the original Australia version [35]. In addition, Molde et al. pointed out that due to different under-standings of the same item content, even the translation itself implied potential changes in the psychometric properties of the individual item and the whole scale [11]. It is still neces-sary to examine the item bias of the instrument in different cultures and languages.
Therefore, the present study had two aims: 1) to estab-lish the factor structure of the GAI in a large Chinese sample using Mokken scale analysis [24,25]; 2) to exam-ine the measurement invariance of the instrument across different groups using DIF analysis.
Methods
Data and sample
National Survey Data Archive (CNSD), which was collected by an extensive survey regarding the mental health of eld-erly adults [14]. Forty-five communities were randomly se-lected in Beijing, China, including old communities, new communities, and large villages. Thirty elderly adults in each community were selected by a systematic sampling method. The investigators read the items in the survey one by one, and the participants provided answers correspond-ing to those items. Finally, a total of 1314 valid records were collected regarding the GAI-CV, 59.5% of which were from females. The age of all participants ranged from 60 to 95 years, with a mean of 71.35 years (SD = 7.45). Other socio-demographic information and clinical characteristics of the sample were presented in Table1.
Measures
All participants completed three scales (including the Geriatric Anxiety Inventory-Chinese Version (GAI-CV) and two other scales) and provided information about their sociodemographic characteristics and health status. The other two scales were to measure self-care ability of daily living and social interactions respectively, and would not be the focus of this study.
The GAI-CV is the Chinese version of the Geriatric Anx-iety Inventory [3]. It was developed following a standard two-stage procedure of translation and back-translation from the original version [34]. It comprises 20 items (e.g., I worry a lot of the time). Participants are asked to make a dichotomous response to the description of each item (agree/disagree). A sum of these ratings composes a meas-ure of general anxiety symptoms (ranged from 0 to 20), with higher scores indicating more anxiety. The GAI-CV
has demonstrated sound psychometric properties in community-dwelling old adults in Beijing. Its internal consistency reliability as Cronbach’sαis 0.94. It has a high correlation with scores on the Beck Anxiety Inventory (r= 0.60). More detailed information about measures and pro-cedures should be referred to the report of the survey [14].
Statistical analyses
We conducted a Mokken scale analysis to examine the factor structure (i.e., dimensionality test) using “mokken” package in the statistical software R [24,25,36]. The mok-ken package offers an automated item selection algorithm (aisp) to produce unidimensional subscales from all items. The resulting pattern and scalability of each item (expressed by Hi) signal the structures of the inventory [26,37]. It also provides procedures to assess the assump-tions of local independence and monotonicity [38,39].
Examining of measurement invariance (i.e., DIF ana-lysis) was proceeded by another package called“difR” in the statistical software R [37]. We applied the logistic re-gression approach to detect both uniform and nonuni-form DIFs [40, 41]. Previous studies have indicated that females were more anxious than males and the elderly who had somatic diseases reported a higher level of anx-iety. Therefore, we would focus on the DIF analysis across sex and somatic diseases. More specifically, the following analysis concerned about whether there was any item bias between females and males and between populations who had no disease and those who had at least one kind of somatic disease.
Results
Descriptive statistics
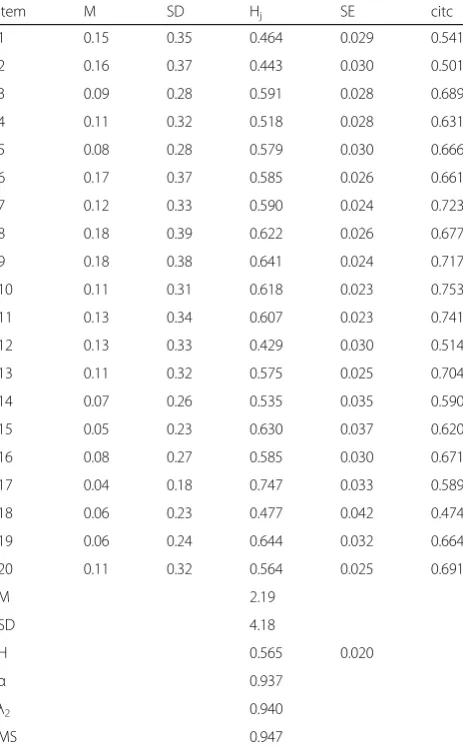
Descriptive statistics of the items and the scale for the GAI-CV were presented in Table 2. The endorsement rate for each item is relatively low, all less than 20%.
Examining factor structure
Scalability coefficients play an essential role in evaluating item quality. The results were also presented in Table2. The Inter-item scalability coefficients (Hij), scalability of each item pair in this analysis was always higher than 0.35. The item scalability coefficients, representing the accuracy of item order for respondents on the latent variable based on total scale scores, were more substan-tial than the suggested lower bound of 0.3 [38, 39], ranged from 0.43 to 0.75. Moreover, the whole inventory had a scalability coefficient H of 0.56, which suggested a scale of strong strength [38, 39]. The 20 items had an excellent internal consistency (Cronbach’s alpha =0.94).
Moreover, local independence and monotonicity were examined to ensure the data were adequately fit to the Mokken scale. For local independence, no item pairs were flagged as locally dependent according to two Table 1Other socio-demographic and clinical characteristics of
the sample
female male total
Marital status
Married 531 (54%) 445 (46%) 976 (100%)
Unmarried 2 (40%) 3 (60%) 5 (100%)
Divorced 43 (61%) 27 (39%) 70 (100%)
Widowed 206 (78%) 57 (22%) 263 (100%)
Education
Primary school 179 (67%) 88 (33%) 267 (100%)
middle school 189 (58%) 135 (42%) 324 (100%)
High school 140 (56%) 111 (44%) 251 (100%)
College degree or above 145 (45%) 176 (55%) 321 (100%)
Other 129 (85%) 22 (15%) 151 (100%)
Somatic diseases
No diseases 110 (50%) 112 (50%) 222 (100%)
At least one diseases 648 (62%) 404 (38%) 1052 (100%)
indices (W1 and W2) calculated in the conditional asso-ciation procedure [38]. That is, there is no evidence of local dependence. For monotonicity, the results showed that only item 12 violated the monotonicity assumption, but the viola-tion was not significant (See Table3). Mokken package also provides a simple index called crit for monotonicity serious-ness evaluation of each item. It was calculated based on item scalability coefficients Hi, choice frequency, and the magni-tude and significance of monotonicity violation. According to a rule of thumb, an item with a crit value less than 40 in-dicates no serious violation [42]. Item 12 had a crit value of 31, and should not be discarded from the Mokken scale. Graphical analysis indicated that all except Item 12 showed monotonical increases (see Fig.1). Item 12 showed a signifi-cant decrease in the middle, but the impact on its item re-sponse function was minimal.
We further investigated the dimensionality for all the 20 items by conducting iterative automated item selec-tion. The results were presented in Table 4. According to the suggestions from Hemker et al., lower bound c started from 0 to 0.75 with increment steps of 0.05. For 0≤c≤0.4, all items were selected in one scale, with Hi ranging from 0.56 to 0.89. For c = 0.45, one scale with 19 items was formed, and item 12 was dropped due to H < 0.45. For 0.5≤c≤0.55, two items (item 1 and item 2) were dropped out from the original, left one long scale with 16 items and one small short scale with two items (item 12 and item 18). The value of Hiin the long scale ranged from 0.63 to 0.89; the short scale had the same two Hivalues, 0.76. For c = 0.6, another two items (item 4 and item14) were got unscalable. For 0.6≤c≤0.75, three or four scales formed and the majority of items remained unscalable. For c = 0.8, only two scales (item 9 and item 17; item 8 and item 19) were kept, and for c = 0.85, one scale with two items (item 9 and item 17) remained. Finally, no items passed the automated selec-tion. The results were in accordance with typical pat-terns of unidimensionality described by Hemker et al., which exhibited a large scale at the beginning and split into several small scales with increasing c. In common practice, the procedure is often implemented for c = 0.3 Table 2Descriptive statistics of the items (upper panel) and the
scale (lower panel) for the GAI-CV
Item M SD Hj SE citc
1 0.15 0.35 0.464 0.029 0.541
2 0.16 0.37 0.443 0.030 0.501
3 0.09 0.28 0.591 0.028 0.689
4 0.11 0.32 0.518 0.028 0.631
5 0.08 0.28 0.579 0.030 0.666
6 0.17 0.37 0.585 0.026 0.661
7 0.12 0.33 0.590 0.024 0.723
8 0.18 0.39 0.622 0.026 0.677
9 0.18 0.38 0.641 0.024 0.717
10 0.11 0.31 0.618 0.023 0.753
11 0.13 0.34 0.607 0.023 0.741
12 0.13 0.33 0.429 0.030 0.514
13 0.11 0.32 0.575 0.025 0.704
14 0.07 0.26 0.535 0.035 0.590
15 0.05 0.23 0.630 0.037 0.620
16 0.08 0.27 0.585 0.030 0.671
17 0.04 0.18 0.747 0.033 0.589
18 0.06 0.23 0.477 0.042 0.474
19 0.06 0.24 0.644 0.032 0.664
20 0.11 0.32 0.564 0.025 0.691
M 2.19
SD 4.18
H 0.565 0.020
α 0.937
λ2 0.940
MS 0.947
Note.N = 1314. HjItem-scalability coefficient,SEStandard error of item scalability coefficient,citcCorrected item–test correlation,HTotal-scalability coefficient,αCronbach’s alpha,λ2Guttman’s lambda-2,MS
Molenaar–Sijtsma method
Table 3Output of assessment of monotonicity
Item #ac #vi #zsig crit
1 6 0 0 0
2 6 0 0 0
3 6 0 0 0
4 6 0 0 0
5 6 0 0 0
6 6 0 0 0
7 6 0 0 0
8 6 0 0 0
9 6 0 0 0
10 6 0 0 0
11 6 0 0 0
12 6 1 0 31
13 6 0 0 0
14 6 0 0 0
15 3 0 0 0
16 6 0 0 0
17 0 0 0 0
18 6 0 0 0
19 6 0 0 0
20 6 0 0 0
[25]. Thus, the unidimensionality of the GAI-CV was confirmed.
Examining measurement invariance
Following the logistic regression approach, the probability of answering items fitted to the logistic model by the total test score, group membership, and the interaction be-tween these two. We set the significance level of matching criterion at 0.01, and items were detected at the threshold of 9.21. In Table5, the results of the DIF analysis were ex-hibited. Regarding sex, item 20 indicated a high logistic re-gression DIF statistic (Logistic stats = 6.01), which reached significance at a 0.05 level. Nonetheless, the small effect size revealed that the bias was negligible in terms of the measure of square. A DIF is considered negligible if R-square≤0. 13, moderate if 0.13 < R-square≤0. 26, and large if R-square > 0.26 [43]. Before detecting item bias be-tween no disease and disease groups, we extracted 269 samples randomly from the disease group for balance. The results indicated that item 6 (Logistic stats = 6.60), item 12 (Logistic stats = 8.97), and item 13 (Logistic stats = 6.00) were significantly different across the subgroups. However, the small effect sizes revealed that these item biases were negligible. Hence, neither uniform nor non-uniform item bias was detected, and the GAI-CV function well across sex and disease groups. These plot outputs were given in Fig.2and Fig.3.
Discussion
The present study reevaluated the psychometric proper-ties of the GAI among a large community-dwelling Chinese elderly sample. Mokken scale analysis was used to determine its dimensionality, and the logistic regres-sion approach was used to detect differential item func-tions. Results revealed that the Chinese version of the Geriatric Anxiety Inventory possesses sound psychomet-ric properties. It is unidimensional and has no item bias across sex and disease groups.
and provides a clear view on the items’ scalability [22]. Through observing the pattern of AISP, we could differentiate unidimensionality and multidimensionality. The results indi-cated that the GAI-CV was unidimensional, which supported the conclusion of Yan et al. [34]. Therefore, it is justified to use a simple sum score of the 20 items within the GAI-CV as a re-liable index for anxiety among the elderly. It should be noted that the sum score is ordinal in nature, but it can be treated as
interval data in case of no serious influence of ordinal transfor-mations on interpretation of further statistical analyses. To our knowledge, this is the first time to explore the GAI with Mok-ken scale technique. MokMok-ken scale analysis provides a compre-hensive output about the scalability of items and the structure of scales [38]. The adoption of Mokken scale analysis in dimen-sionality test should be recommended in future studies of the GAI in different languages and cultures.
Table 4The results of automated item selection procedure
c Results Item Numbers
Scale 1 Scale 2 Scale 3 Scale 4 Unscalable
0–0.4 1: 20 1–20
0.45 1: 19 1–11, 12–20 12
0.5–0.55 2:16, 2 3–11, 13–17, 19–20 12, 18 1, 2
0.6 2:14, 2 3, 5, 6–11, 13, 15–17, 19–20 12, 18 1, 2, 4, 14
0.65 4: 9, 2, 2, 2 8–11, 13, 15–17, 19 12, 18 3, 4 6, 7 1, 2, 5, 20
0.7 3: 7, 3, 2 8–9, 13, 15–17, 19 3, 10, 11 12, 18 1, 2, 4–7, 14, 20
0.75 4: 4, 2, 2, 2 8–9, 17, 19 3, 10 15, 16 12, 18 1, 2, 4-7, 11, 13-14, 20
0.8 2: 2, 2 9, 17 8, 19 1–7, 10–16, 18, 20
0.85 1: 2 9, 17 1–8, 10–16, 18–20
Table 5The results of DIF analysis with logistic regression
Item Sex Somatic Disease
Statistic p R2 Effect size Statistic p R2 Effect size
1 1.46 0.48 0.0015 A 3.66 0.16 0.0105 A
2 0.92 0.63 0.0009 A 5.56 0.06 0.0162 A
3 2.14 0.34 0.0026 A 1.94 0.38 0.0074 A
4 3.06 0.21 0.0034 A 3.92 0.14 0.0118 A
5 1.39 0.50 0.0018 A 0.15 0.93 0.0006 A
6 3.61 0.16 0.0030 A 6.60 0.04a 0.0142 A
7 3.98 0.14 0.0038 A 0.76 0.69 0.0021 A
8 3.96 0.14 0.0030 A 5.98 0.05 0.0125 A
9 2.74 0.25 0.0020 A 3.05 0.22 0.0059 A
10 3.86 0.15 0.0039 A 2.44 0.30 0.0071 A
11 0.15 0.93 0.0001 A 5.32 0.07 0.0134 A
12 4.02 0.13 0.0045 A 8.97 0.01a 0.0289 A
13 3.97 0.14 0.0040 A 6.00 0.04a 0.0184 A
14 3.79 0.15 0.0056 A 3.10 0.21 0.0151 A
15 2.14 0.34 0.0037 A 0.50 0.78 0.0029 A
16 1.36 0.50 0.0018 A 4.61 0.10 0.0173 A
17 0.19 0.91 0.0004 A 0.22 0.90 0.0022 A
18 4.33 0.11 0.0080 A 1.68 0.43 0.0091 A
19 0.89 0.64 0.0014 A 1.13 0.57 0.0052 A
20 6.01 0.04a 0.0062 A 2.12 0.35 0.0061 A
Note.a
indicated significance at 0.05 level. The DIF estimates are classified according to effect size as“A”(negligible effect),“B”(moderate effect), and“C”
Measurement invariance of the GAI is very important, given researchers often make comparisons among groups with different sex, diseases, and cultures. Only Molde et al. have evaluated the differential item functions across sex, MMSE (The Mini-Mental State Examination) and MADRS (The Montgomery–Asberg Depression Rating Scale) groups. Their results indicated that no item had a substantial bias across those groups. We adopted the logistic regression method, which was one of the most effective and recom-mended ways to detect DIF [41,45]. Logistic regression has many advantages over other DIF methods, such as the Man-tel Haenszel. It does not require to categorize a continuous criterion variable, and it is capable of modeling both uni-form and non-uniuni-form DIF [46]. Previous studies have re-vealed that females tended to report more anxiety than males, and people with chronic diseases tended to be more anxious than those without somatic diseases. Our study veri-fied that comparisons among those groups were reasonable,
and the group differences on the GAI reflected substantial variability rather than differential item functions.
We acknowledged several potential limitations of this study. Although we conducted the analyses in a relative large representative sample, only old adults in Beijing communities were included. Therefore, the generalization of the conclusion to the elderly with various cultural and language backgrounds should be with caution. Future rep-lications in diverse samples in other cultures and lan-guages will be beneficial to the establishment of the worldwide adaptability of the GAI. Besides, our sample did not include clinical patients (e.g., older adults with a primary anxiety disorder). The generalizability of the find-ings is limited to those who are not clinically diagnosed with anxiety disorders. Future research should attempt to address the limitation of recruiting clinically disordered samples who met the criteria for a primary anxiety disorder.
Fig. 2Plots of DIF across sex
Conclusions This work is among the few studies to examine the factor structure and measurement invariance of the GAI in a large representative sample. Results of Mokken scale analysis confirmed the unidimensionality of the GAI among non-clinical old adults in Beijing commu-nities, and results of DIF analysis ensured the reasonability of comparisons across sex and somatic groups.
Abbreviations
AISP:Automated item selection procedure; CFA: Confirmatory factor analysis; DIF: Differential item functioning; EFA: Exploratory factor analysis;
GAD: Generalized Anxiety Disorder; GAI: Geriatric Anxiety Inventory; GAI-CV: Geriatric Anxiety Inventory-Chinese Version; MHM: Monotone
homogeneity model; MSA: Mokken scale analysis; PCA: Principal components analysis
Acknowledgements
This is part of a research project in the course“Advanced Psychometrics”for postgraduates. We would like to express our thanks to Chinese National Survey Data Archive (CNSD) for allowing us to use the data. We also greatly appreciate editors and three reviewers for their insightful comments.
Authors’contributions
XZ and ZL conceived and designed the study. AS and XZ performance the statistical analysis under the guidance of ZL. XZ wrote the first draft of the manuscript. ZL and XZ mostly involved in several revisions of the manuscript. LW provided critical comments and joined other authors in revising the manuscript and approving the final submission. All authors have read and approved the manuscript in its current state.
Funding
This study was supported by the Foundation of Humanities and Social Sciences, Ministry of Education of the PRC (No.16YJA190003), Project of Philosophy and Social Sciences from the Education Department, Jiangsu Province (No. 2018SJZDI203), and Fundamental Research Funds for the Central Universities. They played important roles in the design of the study and collection, analysis, and interpretation of data and in writing the manuscript.
Availability of data and materials
The raw data is publicly available at.
https://osf.io/9k5a4/?view_only=a5371241a2474b5fb97016ccd7c80888.
Ethics approval and consent to participate
All procedures performed in studies involving human participants were in accordance with the 1964 Helsinki declaration and its later amendments or comparable ethical standards. The ethics committee of Department of Psychology at Nanjing University reviewed and approved the study. Written informed consent was obtained from all participants included in the study.
Consent for publication
Not Applicable.
Competing interests
The authors declare that they have no competing interests.
Author details
1School of Social and Behavioral Sciences, Nanjing University, 163 Xianlin
Avenue, Qixia District, Nanjing 210023, Jiangsu, China.2Laboratory for Traumatic Stress Studies, CAS Key Laboratory of Mental Health, Institute of Psychology, Chinese Academy of Sciences, Beijing, China.3Department of
Psychology, University of Chinese Academy of Sciences, Beijing, China.
Received: 14 January 2019 Accepted: 6 November 2019
References
1. Wolitzky-Taylor KB, Castriotta N, Lenze EJ, Stanley MA, Craske MG. Anxiety disorders in older adults: a comprehensive review. Depress Anxiety. 2010; 27(2):190–211.
2. Zhang AP, Zeng XX, Yang DL. Investigation the influential factors of anxiety state in the elderly rooming house. Chin J Gerontol. 2010;30(5):672–4. 3. Pachana NA, Byrne GJ, Siddle H, Koloski NA, Harley E, Arnold E.
Development and validation of the geriatric anxiety inventory. Int Psychogeriatr. 2007;19(1):103–14.
4. Yochim BP, Mueller AE, Segal DL. Late life anxiety is associated with decreased memory and executive functioning in community dwelling older adults. J Anxiety Disord. 2013;27(6):567–75.
5. Pachana NA, Gallagher-Thompson D, Thompson LW. Assessment of depression. Annu Rev Gerontol Geriatr. 1994;14:234.
6. Gershuny BS, Sher KJ. Compulsive checking and anxiety in a nonclinical sample: differences in cognition, behavior, personality, and affect. J Psychopathol Behav Assess. 1995;17(1):19–38.
7. Matheson S, Byrne GJ, Dissanayaka NNW, Pachana NA, Mellick GD, Osullivan JD, et al. Validity and reliability of the geriatric anxiety inventory in Parkinson's disease. Australas J Ageing. 2012;31(1):13–6.
8. Byrne GJ, Pachana NA, Arnold L, Chalk JB, Appadurai K. P2-239: performance characteristics of the geriatric anxiety inventory in memory clinic attendees. Alzheimers Dement J Alzheimers Assoc. 2008;4(4):T441–T2.
9. Diefenbach GJ, Tolin DF, Meunier SA, Gilliam CM. Assessment of anxiety in older home care recipients. Gerontologist. 2009;49(2):141–53.
10. Gerolimatos LA, Gregg JJ, Edelstein BA. Assessment of anxiety in long-term care: examination of the geriatric anxiety inventory (GAI) and its short form. Int Psychogeriatr. 2013;25(9):1533–42.
11. Molde H, Hynninen KM, Torsheim T, Bendixen AB, Engedal K, Pachana NA, et al. A Bifactor and item response analysis of the geriatric anxiety inventory. Int Psychogeriatr. 2017;29:1–10.
12. Byrne GJ, Pachana NA. Development and validation of a short form of the geriatric anxiety inventory–the GAI-SF. Int Psychogeriatr. 2011;23(1):125–31. 13. Johnco C, Knight A, Tadic D, Wuthrich VM. Psychometric properties of the
geriatric anxiety inventory (GAI) and its short-form (GAI-SF) in a clinical and non-clinical sample of older adults. Int Psychogeriatr. 2015;27(7):1089–97. 14. Tang D, Wang D. Anxiety of Elderly Adults: Level and the Influencing
Factors. Stud Psychol Behav. 2014;12(1):52–7.
15. Daniel F, Vicente H, Guadalupe S, Santo HE. Psychometric properties of the Portuguese version of the geriatric anxiety inventory in a sample of eldery people in residential care. Soc Sci Electron Publishing. 2017;1(2):15–30. 16. Ribeiro O, Paul C, Simoes MR, Firmino H. Portuguese version of the geriatric
anxiety inventory: transcultural adaptation and psychometric validation. Aging Ment Health. 2011;15(6):742–8.
17. Bendixen AB, Hartberg CB, Selbaek G, Engedal K. Symptoms of anxiety in older adults with depression, dementia, or psychosis: a principal component analysis of the geriatric anxiety inventory. Dement Geriatr Cogn Disord. 2016;42:310–22.
18. Marque-Zgonzalez M, Losada A, Fernandez-Fernandez V, Pachana NA. Psychometric properties of the Spanish version of the geriatric anxiety inventory. Int Psychogeriatr. 2012;24(1):137–44.
19. Guan M. Factor structure of the Chinese version of the geriatric anxiety inventory. Ann General Psychiatry. 2016;15(1):4.
20. Diefenbach GJ, Bragdon LB, Blank K. Geriatric anxiety inventory: factor structure and associations with cognitive status. Am J Geriatr Psychiatr. 2014;22(12):1418–26.
21. Hattie J. Methodology review: assessing Unidimensionality of tests and items. Appl Psychol Meas. 1985;9(2):139–64.
22. Wismeijer AA, Sijtsma K, van Assen MA, Vingerhoets AJ. A comparative study of the dimensionality of the self-concealment scale using principal components analysis and Mokken scale analysis. J Pers Assess. 2008;90(4):323–34. 23. Molde H, Nordhus IH, Torsheim T, Engedal K, Bendixen AB, Byrne GJ,
Márquez-González M, Losada A, Feng L, Ow EKT, et al. A cross-National Analysis of the psychometric properties of the geriatric anxiety inventory. J Gerontol. 2019.https://doi.org/10.1093/geronb/gbz002.
24. Mokken RJ. A theory and procedure of scale analysis. Berlin: De Gruyter; 1971. 25. Mokken RJ, Lewis C. A nonparametric approach to the analysis of
26. Hemker BT, Sijtsma K, Molenaar IW. Selection of unidimensional scales from a multidimensional item bank in the polytomous Mokken IRT model. Appl Psychol Meas. 1995;19(4):337–52.
27. Sijtsma K, Meijer RR, Der Ark LAV. Mokken scale analysis as time goes by : an update for scaling practitioners. Personal Individ Differ. 2011;50(1):31–7. 28. van Schuur WH. Ordinal item response theory: Mokken scale analysis. Los
Angeles: Sage; 2011.
29. Gum AM, Kingkallimanis BL, Kohn R. Prevalence of mood, anxiety, and substance-abuse disorders for older Americans in the national comorbidity survey-replication. Am J Geriatr Psychiatr. 2009;17(9):769–81.
30. Gottschling J, Segal DL, Häusele C, Spinath FM, Stoll G. Assessment of anxiety in older adults: translation and psychometric evaluation of the German version of the geriatric anxiety scale (GAS). J Psychopathol Behav Assess. 2015;38(1):136–48.
31. Pachana NA, McLaughlin D, Leung J, Byrne G, Dobson A. Anxiety and depression in adults in their eighties: do gender differences remain? Int Psychogeriatr. 2012;24(1):145–50.
32. Milfont TL, Fischer R. Testing measurement invariance across groups: applications in cross-cultural research. Int J Psychol Res. 2010;3(1):111–30. 33. Mueller AE, Segal DL, Gavett B, Marty MA, Yochim B, June A, et al. Geriatric
anxiety scale: item response theory analysis, differential item functioning, and creation of a ten-item short form (GAS-10). Int Psychogeriatr. 2015;27(7):1099–111. 34. Yan Y, Xin T, Wang D, Tang D. Application of the geriatric anxiety
inventory-Chinese version (GAI-CV) to older people in Beijing communities. Int Psychogeriatr. 2014;26(3):517–23.
35. Der Ark V, Andries L. Mokken Scale Analysis in R. J Stat Softw. 2007;20(1):1–19. 36. Sijtsma K, Molenaar IW. Introduction to nonparametric item response
theory: sage; 2002.
37. R Development Core Team. R: A language and environment for statistical computing, vol. 2008. Vienna: R Foundation for Statistical Computing; 2014. 38. Sijtsma K, van der Ark LA. A tutorial on how to do a Mokken scale analysis on your test and questionnaire data. Br J Math Stat Psychol. 2017;70(1):137–58. 39. Stochl J, Jones PB, Croudace TJ. Mokken scale analysis of mental health and
well-being questionnaire item responses: a non-parametric IRT method in empirical research for applied health researchers. BMC Med Res Methodol. 2012;12(1):74.
40. Magis D, Beland S, Tuerlinckx F, De Boeck P. A general framework and an R package for the detection of dichotomous differential item functioning. Behav Res Methods. 2010;42(3):847–62.
41. Swaminathan H, Rogers HJ. Detecting differential item functioning using logistic regression procedures. J Educ Meas. 1990;27(4):361–70. 42. Molenaar I, Sijtsma K. User’s manual MSP5 for windows. Software manual.
Groningen: IEC ProGAMMA; 2000.
43. Zumbo B, Thomas D. A measure of effect size for a model-based approach for studying DIF. Prince George: University of Northern British Columbia, Edgeworth Laboratory for Quantitative Behavioral Science; 1997. 44. Michielsen HJ, De Vries J, Van Heck GL, De Vijver FJRV, Sijtsma K.
Examination of the dimensionality of fatigue. Eur J Psychol Assess. 2004; 20(1):39–48.
45. Clauser BE, Mazor KM. Using statistical procedures to identify differential item functioning test items. Educ Meas Issues Pract. 2005;17(1):31–44. 46. Zumbo B. A handbook on the theory and methods of differential item
functioning (DIF). Ottawa: National Defense Headquarters; 1999.
Publisher’s Note