Research on Remote Sensing Image Fusion Based on
Compressive Sensing Algorithm
Duo Wang*, GuoJin He, Weili Jiao
Institute of Remote Sensing and Digital Earth, Chinese Academy of Sciences, Beijing, China.
* Corresponding author. Tel.: 18600601142; email: [email protected] Manuscript submitted May 21, 2017; accepted July 15, 2017.
doi: 10.17706/jcp.13.5.519-526
Abstract: Compressive sensing (CS) theory is a new type of sampling theory based on information technology. It breaks through the limitations of traditional Nyquist/Shannon sampling theorem, and reconstructs a signal or digital image at a far lower sampling rate. In this paper, we present an efficient remote sensing fusion method based on compressive sensing. First, a sparse model according to the wavelet-based algorithm is used on the panchromatic image and the multispectral image separately. Then the sparse results are compressed through a measurement matrix and different fusion coefficients are chosen on each component of the compressed images. Finally, after reconstruction and invert wavelet transform, we acquire the final fusion image. Compared experiments are made and the simulation results show that the CS fusion algorithm has a more economic and effective performance than the other traditional methods.
Key words: Compressive sensing, fusion, measurement matrix, remote sensing, sparse expression.
1.
Introduction
In the process of acquiring remote sensing images, a sensor can only obtain images with either high spatial resolution or high spectral resolution. In many cases, a single sensor is not sufficient to provide a complete and fully informative perception of the real world [1]. Remote sensing image fusion can solve this contradiction. It combines information from multiple images into a fused image and provides more interpretation capabilities. But traditional fusion methods need to acquire all samples of the images. And new problems of storage burden and processing challenges are gradually emerging. That is the reason why compressive sensing (CS) theory is introduced.
The CS theory [2], [3] exploits the knowledge that the signals or images acquired are sparse in some known transform domain, which means that the signals or images are compressive. Then the compressive signals can be reconstructed accurately at a far lower data sampling rate from a significantly smaller number of measurements than sampling original signals at Nyquist/Shannon rate [4]. Therefore, the CS theory can lead to the reduction of sampling rate, storage volume, power consumption, and computational complexity in signal and image processing and related research fields.
The remainder of this paper is organized as follows: Section 2 provides a brief review of the CS theory. In Section 3, the proposed image fusion scheme in CS is presented. Compared experimental results and evaluations are given in Section 4. Finally, Section 5 concludes this paper.
2.
Compressive Sensing
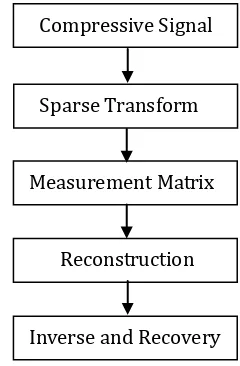
The core ideas of compressive sensing are sparse representation, measurement matrix and signal reconstruction [3]. Firstly, a sparse matrix is used to describe a signal. Secondly, we sample the signal with a measurement matrix which is irrelevant with the sparse basis but can reserve effective information as much as possible. Finally, a more accurate signal is reconstructed through recovery algorithm. The framework of compressive sensing is shown in Fig. 1.
Fig. 1. Framework of compressive sensing.
Consider an unknown signal n
x
∈
R
, which is K-Sparse with a certain basis ψ such as a wavelet basis or a Fourier basis. Then it can be expressed as the decomposition of the basis:x=ψθ, (1)
where θ is a column vector with proper dimension that is composed by corresponding coefficients. When signal x has less than k nonzero coefficients on basis ψ, then ψ can be regarded as a sparse basis of signal x. Studies have showed that a signal can be accurately reconstructed by a small number of measurements if it is sparse with some orthonormal bases. But there is a precondition that the measurement matrix is obtained through a measurement matrix (A) incoherent with the sparse basis ψ, and Ax must reach the restricted isometric property (RIP) [7] as:
(1−εk ||x||2≤||Ax||2≤(1+εk)||x||2). (2)
The
ε ∈
k(0,1)
is called RIP constant. And the measurement vectory
∈
R
m(k<m<<n) is obtained by the following liner system:y= Ax=Aψθ, (3)
where A is an m×n measurement matrix. Accordingly, we can calculate θ when y and ψ are already Compressive Signal
Sparse Transform
Measurement Matrix
Reconstruction
confirmed. It is a pathological solving process. That is the basic flow of compressive sensing. The advantage of this method is that the observation data with low-dimensional projection are greatly reduced, and it breaks through the bottleneck of traditional theorems. Fig. 2 describes the brief process of K-Sparse.
Fig. 2. Sketch map of K-Sparse.
3.
Image Fusion Scheme
For remote sensing image fusion in CS, we need to transform original images into sparse signals and fuse them according to certain rules. Then we reconstruct the fusion image in the transform domain with a measurement matrix. At last the final fusion image is acquired through inverse transform of the domain. Here come the specific steps of CS fusion algorithm.
3.1.
IHS Transform
There are two color spaces usually used in image processing, RGB space and IHS space [8]. The intensity (I), hue (H), and saturation (S) components in IHS space are relatively independent. They can describe color characteristics accurately and quantitatively. Therefore we normally transform a multispectral image from RGB space into IHS space. The IHS transform can be formulated as follows:
− − = B G R v v I 0 2 1 2 1 6 2 6 1 6 1 3 1 3 1 3 1 2 1
tan ( 2/ 1) 1
v v
H = − , 22
2
1 v
v
S = + (5)
3.2.
Sparse Expression
The basic idea of sparse expression is to find a transform domain that is able to represent the sparseness of a signal and get sparse coefficients in the transform domain. We choose wavelet [8], [9] as the transform basis because it has a better sparse degree. The wavelet transform is performed among the panchromatic image and the intensity (I) component of the multispectral image separately. We assume that the vectors to be fused are denoted as xS (pan) and xM (multi). After wavelet transform, fS and fM can be obtained. The process is expressed as:
* , * , ( , ) ( ) ( ) ( , ) ( ) ( )
i i j k
i i j k
fS j k xS t t dt
fM j k xM t t dt
ψ ψ +∞ −∞ +∞ −∞ = =
∫
∫
(6), ( ) 02 [ 0 ( 0)] j
j j k t a a t kb
ψ = − ψ − −
where
ψ
j k,( )
t
is the continuous wavelet function, and *,
( )
j k
t
ψ
is the complex conjugate ofψ
j k,( )
t
.3.3.
Measurement Matrix
Common measurement matrices include Gaussian random matrix, random Bernoulli matrix, partially orthogonal matrix, Hadamard random matrix, sparse random matrix and so on. In this paper, we choose the random Bernoulli measurement matrix because it can satisfy the irrelevancy condition with any given matrix and provide a good performance. Define the random Bernoulli matrix as A, and then we have:
A
∈
R
M N×(
M
<<
N
)
(8),
1
1
2
1
1
2
i j
P
m
A
P
m
+
=
=
−
=
(9)where
A
i j, represents the element in matrix A and obeys Bernoulli distribution, M stands for the dimension of the matrix, and N is the column number of the matrix. With the measurement matrix, we can obtain the measurement coefficients of the panchromatic and multispectral images:
i i
i i
yS AfS
yM AfM
=
=
(10)
3.4.
Fusion
We use two-dimensional wavelet decomposition [9] on the measurement values respectively and obtain high frequency and low frequency data. Based on different fusion rules we acquire the final fusion result. Suppose the fusion result is
f u
i( )
, the general fusion rules are expressed in (11):
( ) ( ) ( ), 0,1,..., 1 1
i i i
f u αyS u βyM u u M
α β
= + = −
+ =
(11)
where α and β are fusion coefficients and different values are chosen based on different fusion rules. The low frequency data represent general outline and profile of an image, and they mainly reflect spectral information. Therefore the coefficient of the multispectral image is taken as the low frequency fusion coefficient. The high frequency data represent detailed information of an image and information appear in the edge texture of the image. Because the panchromatic image and the intensity component of the multispectral image carry most of the detailed information, the maximum gradient of them is chosen as the high frequency fusion coefficient.
3.5.
Image Reconstruction
(SAMP), and Regularized Orthogonal Matching pursuit (ROMP) are commonly included. In this paper, we adopt the OMP algorithm for its more accurate reconstruction. Suppose the recovery coefficient obtained by OMP algorithm is
Z
i, the image is reconstructed as:1 1
OMP
M N
i i
f ∈R × → Z ∈R × (12)
After reconstruction we obtain the recovery coefficient of the measurement values, and then inverse wavelet transform is performed to get a new fusion component '
I
. At last, we combine the new component 'I
with previous components H and S to acquire the final fusion image.4.
Experimental Results and Performance Evaluations
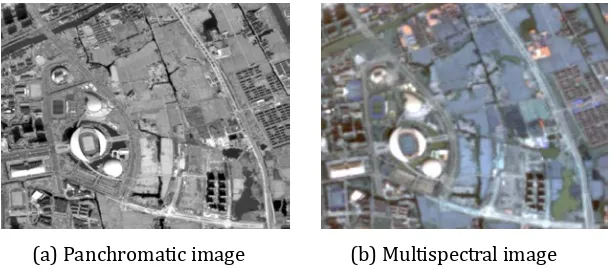
GF-1 is a high resolution satellite launched by China. The PMS sensor of GF-1 provides a panchromatic band with 2m spatial resolution and four multispectral bands with 8m spectral resolution. In this paper, we choose GF-1 PMS data in Changshu city, Jiangsu province as the experimental data. There are many different kinds of features in this region. The borders of features are clear and easy to be identified in the remote sensing image. After pretreatment such as spatial registration and image cropping, the panchromatic image and multispectral image are shown in Fig. 3.
(a) Panchromatic image (b) Multispectral image
Fig. 3. GF-1 images before fusion experiments.
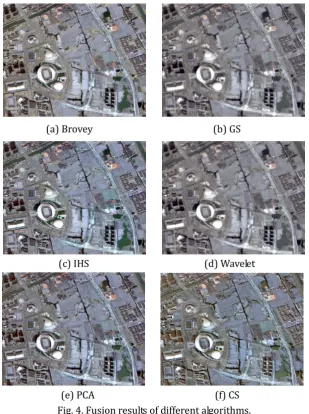
In order to verify the performance of the CS fusion algorithm presented in this paper, compared experiments are made between IHS algorithm, GS algorithm, PCA algorithm, Brovey algorithm, wavelet algorithm [11] and compressive sensing algorithm. The fusion images are shown in Fig. 4.
Table 1. Evaluation of Different Algorithms
Fusion
algorithm Objective MetricsEntropy Mutual
information Average gradient Spectral distortion
Brovey 7.2531 6.9272 9.5105 65.8437
GS 7.3134 7.1468 9.4578 80.0961
IHS 7.3056 7.2143 9.5130 64.7681
wavelet 7.1493 7.2465 8.9351 72.0189
PCA 7.4579 7.1098 9.8235 67.0105
CS 7.5809 7.5794 10.0938 70.7052
wavelet algorithm is so large that the whole tone is much shallower than the others. In the CS image, the tone of green lands and no cover features becomes shallow but the tone of houses and roads becomes dark. So we can conclude that different tone changes enhance the contrast between objects after CS fusion.
(a) Brovey (b) GS
(c) IHS (d) Wavelet
(e) PCA (f) CS
Fig. 4. Fusion results of different algorithms.
For the improvement of spatial resolution, the effect of wavelet fusion is not as good as the others. The IHS fusion also has a certain degree of fuzziness visually. The other algorithms provide ideal promotion of spatial resolution. CS fusion has obvious advantages in feature boundary processing. The boundaries of highlight features such as housetops, roads, and bare lands are particularly clear in CS fusion.
In order to give a more precise conclusion, we put forward some objective metrics [12] to analyze the fusion images above. The results are shown in Table 1.
a) Entropy: Entropy is a measurement of the amount of information. A high value of entropy indicates that an image contains a great amount of information. Also, the entropy is a kind of statistical forms of characteristics.
b) Mutual information: Mutual information represents the information of a fusion image that also belongs to the original images. The greater value of it stands for the more information they share.
d) Spectral distortion: Spectral distortion can directly reflect the distortion degree of spectral information in a fusion image. The greater the value is, the more serious the distortion is.
The spectral distortion is an evaluation metric of spectral information, the entropy and mutual information are evaluation metrics of information volume, and the average gradient is an evaluation metric of edge-texture information. From the table we can see that the CS fusion image contains the most information of the original images. The CS algorithm is better at processing detailed texture information. And the spectral information fidelity of CS algorithm is above the average of the others. In general, the CS fusion algorithm proposed in this paper has a better performance according to subjective and objective evaluations.
5.
Conclusion
In this paper, we choose GF-1 remote sensing images as the experimental data, introduce compressive sensing algorithm into remote sensing image fusion methods, and compare it with several common pixel-level fusion algorithms. With the CS fusion algorithm, computational complexity decreases because it only needs incomplete measurements rather than acquiring all samples of the whole image. Moreover, it preserves entire spectral information and much richer detailed texture information of the original images than traditional algorithms. Experiments demonstrate the promising performance of the CS algorithm.
However, compressive sensing theory is still in the developing stage, and more explorations and research are needed in the future.
Acknowledgment
This work is funded by the National Science and Technology Major Project(Grant No: 2016YFA0600302). Thanks are due to Weili Jiao for assistance with the experiments and to Guojin He for valuable discussion.
References
[1] Hall, D. L., & Llinas, J. (1997). An introduction to multisensor data fusion. Proceedings of the IEEE: Vol. 85. [2] Baraniuk, R. G. (2007). Compressive sensing [Lecture Notes]. IEEE Signal Processing Magazine, 24(4),
118-121.
[3] Donoho, D. L. (2006). Compressed sensing. IEEE Transactions on Information Theory, 52(4), 1289-1306. [4] Candès, E., & Romberg, J. (2006). Sparsity and incoherence in compressive sampling. Inverse Problems,
23(3), 969-985.
[5] Han, J., Loffeld, O., & Hartmann, K. (2010). Multi image fusion based on compressive sensing. Proceedings of International Conference on IEEE Audio Language and Image (ICALIP) (pp. 1463-1469).
[6] Usman, M., Prieto, C., & Odille, F. (2011). A computationally efficient OMP-based compressed sensing reconstruction for dynamic MRI. Physics in Medicine & Biology, 56(7), 99-114.
[7] Baraniuk, R., Davenport, M., & Devore, R. (2008). A simple proof of the restricted isometry property for random matrices. Constructive Approximation, 28(3), 253-263.
[8] Chianti, Y., & Houacine, A. (2002). The joint use of IHS transform and redundant wavelet decomposition for fusing multispectral and panchromatic images. Remote Sensing, 23(18), 3821-3833.
[9] Devore, R. A., Jawerth. B., & Lucier, B. J. (1992). Image compression through wavelet transform coding. IEEE Transactions on Information Theory, 38(2), 719-746.
[10]Candès, E. J., Romberg, J. K., & Tao, T. (2005). Stable signal recovery from incomplete and inaccurate measurements. Communications on Pure & Applied Mathematics, 59(8), 410-412.
[12]Qu, G., Zhang, D., & Yan, P. (2002). Information measure for performance of image fusion. Electronics Letters, 38(7), 313-315.
Duo Wang was born in Henan province, China in 1986. He received the B.S. degree in remote sensing science and technology from Wuhan University, Hubei, China, in 2008. He received the M.S. degree in cartography and geographic information system from University of Chinese Academy of Sciences, Beijing, China, in 2011.
From 2011 to 2016, he worked as a research assistant at the Institute of Remote Sensing and Digital Earth (RADI), Chinese Academy of Sciences (CAS). And now, he is pursuing his Ph.D. degree at the same institute. His research interests include intelligent processing of high spatial resolution remote sensing images, such as image segmentation and classification, and spatial information mining from long time series remote sensing images.
Guojin He was born in Fujian province, China, in 1968. He received the B.S. degree in geology from Fuzhou University in 1989 and the M.S. degree in remote sensing of geology from China University of Geosciences in Wuhan, in 1992. And he got the Ph.D. degree in geology from Institute of Geology, Chinese Academy of Sciences (CAS), in 1998.
From 1992 to 2007, he worked at the Information Processing Department of China Remote Sensing Satellite Ground Station (RSGS), CAS. In 2001, He became the deputy director of Information Processing Department of RSGS, CAS. From 2004, he was the professor and director of Information Processing Department of RSGS, and also headed the research group of remote sensing information mining and intelligent processing. From 2008 to 2012, he was the professor and director of the value-added product department, and the deputy director of the spatial data center, center for earth observation and digital earth, CAS. Since 2013, he has been the professor and director of the satellite data based value-added product department, and the deputy director of RSGS, institute of remote sensing and digital earth, CAS.
A large part of his earlier research dealt with information processing and applications of satellite remote sensing data. His current research interests are focusing on optical high resolution remote sensing image understanding as well as using information retrieved from satellite remote sensing images, in combination with other sources of data to support better understanding of the earth.
Weili Jiao received the B.S. degree in cartography from the Wuhan Technical University of Surveying and Mapping, Wuhan, China, in 1988 and the M.S. degree in geoinformatics from the International Institute for Aerospace Survey and Earth Sciences (ITC), Enschede, The Netherlands, in 1995.