G-Heart: A GPU-based System for
Electrophysiological Simulation and
Multi-modality Cardiac Visualization
Lei Zhang
a,b, Kuanquan Wang
a, Wangmeng Zuo
a, Changqing Gai
aa School of Computer Science and Technology, Harbin Institute of Technology, Harbin 150001, China
Email:{wangkq, wmzuo}@hit.edu.cn
b School of Art and Design, Harbin University, Harbin 150086, China
Email: [email protected]
Abstract— Cardiac electrophysiological simulation and multi-modality visualization are computationally intensive and valuable in studying the structure, mechanism, and dy-namics of heart. The existing multi-CPU based approaches can reduce the calculation time, but suffer from the hard-ware and communication cost problems and are inefficient for 3D data visualization. Compared with multi-CPU, the highly parallel and multi-core properties of GPU make it a suitable alternative for accelerating cardiac simulation and visualization. In this paper, we develop a G-Heart system where GPU-based acceleration technologies are adopted for both the simulation of cardiac electrophysiological activities and the online illustration 3D multi-modality (anatomical and electrophysiological) data. In the simulation stage, a phase-field method is employed to cope with the no-flux boundary condition. For heart geometrical structure illustra-tion, a GPU-based ray-casting volume rendering algorithm is implemented and an improved context-preserving model with user interaction is integrated into the proposed frame-work. Finally, a fusion visualization method is proposed, which can provide 3D visualization results for both the simulation data and the anatomical data simultaneously.
Index Terms— visualization, heart modelling, electrophysio-logical simulation, CUDA, GPGPU
I. INTRODUCTION
C
Ardiac electrical activities are valuable for the in-vestigation of complex heart diseases, e.g., arrhyth-mias, ischemia, and ventricular fibrillation, and can be invasively measured by medical devices like electro-cardiogram (ECG). With the progress in programmed electrical modeling and stimulation, electrophysiological simulation has gradually been a promising direction for cardiac electrophysiology study. By simulating the cardiac electrical activities over a wide variety of scales from single ion channel proteins to whole organs, cardiac electrophysiological simulation can help in revealing the mechanisms of normal and abnormal cardiac electrical activities, interpreting of clinical data, and even designing drugs and therapeutic plans [1], [2] .Over the last decades, cardiac electrophysiological sim-ulation has received considerable research interests, and numerous models have been developed for simulating the
Corresponding author: Kuanquan Wang.
functions of protein, single cell, tissue, and whole heart [3]. Recently, benefited by the progress in electrophys-iological modeling and medical imaging, anatomically realistic and biophysically detailed multi-scale computer models of the heart are playing an increasingly impor-tant role in advancing our understanding of integrated cardiac function in health and disease [4]. For example, action potential propagation simulation of ischemia in 3D anatomically detailed ventricle is valuable in studying the mechanisms and dynamics of ischemia-induced re-entry and arrhythmia [5].
Cardiac electrophysiological model generally is a cou-pled system of partial differential equations for modeling the electrical wave propagation across tissue and ordinary differential equations for modeling cell dynamics. The solution to typical electrophysiological model, e.g., bido-main and monodobido-main model, usually involves millions of nodes, and suffers from the complex boundary and computational inefficiency problems. Moreover, the multi-CPU-based high-performance computing is also ineffi-cient for 3D data visualization. To address the complex boundary problem, a phase-field method was proposed in [6], and Lu et al. adopted it for studying the influence of ischemia on 3D human ventricle [7]. To alleviate the computational inefficiency, high-performance computing was developed to speedup electrophysiological simula-tion. However, the scalability of most bidomain based simulation is limited to hundreds of cores, and only few work circumvented this limitation by using appropriate grid partitioning and asynchronous IO parallel mechanism [8], [9].
Another promising advantage of GPU is that it makes the visualization of multi-modality volume cardiac data, i.e., the detailed 3D anatomical data and the electro-physiological simulation results, more convenient. By far, several systems have been developed for the visualization of electrophysiological data. Hurmusiadis developed a simulation system called Virtual Heart [16] for electro-physiological behavior demonstration. Lu et al. proposed an electrophysiology simulation method and assessed the simulation result by a ray-casting method [7].
However, these systems did not unify spatial informa-tion of tissues with electrophysiological behavior. With-out the context information from anatomical model, one can not understand the visualization results easily. Thus, electrophysiological behavior visualization must deal with multi-volume data, i.e., one anatomical reference and one or more electrophysiological measurements. In this sense, Wang et al. [17] designed multi-dimensional transfer func-tion to visualize cardiac electrophysiology simulafunc-tion. In their work, an improved LH histogram method was proposed and multi-dimensional transfer function design was discussed. With this method, boundary information was enhanced and cardiac electrophysiology behaviour was accurately presented. Unfortunately, their implemen-tation could not provide real-time rendering results, and results in poor user interaction performance. Moreover, their works could not provide the correspondence of the wave propagation and the time elapsing. To address this problem, Kharche et al. proposed a high-performance computing (HPC)+high-performance visualization (HPV) framework to study the 3D anatomically detailed model of clinical human atria electrophysiology [18]. Unfortunate-ly, the bottleneck of the communication of their method would drastically affect the visualization efficiency when the data transfer increases.
In this paper, we extend our previous work [19], [20] and present a framework named G-Heart to take advan-tage of GPU computation capability for both cardiac elec-trophysiology simulation and visualization. The G-Heart takes the parameters of the cardiac electrophysiological model as input, and generates the multi-volume rendering results with spatial and temporal information as output. The workflow of the G-Heart consists of two stages: the simulation stage and the visualization stage.
The remainder of the paper is organized as follows: Section II introduces the main ingredient of the G-heart framework. Section III evaluates the performance of our implementation. Finally, the paper is concluded in Section IV.
II. G-HEARTFRAMEWORK
Researches have been focused on GPU-based elec-trophysiological simulation, but few attention was paid to analysis for the simulation results. Workflow of the proposed G-heart framework can be described as follows. First, the electrophysiological simulation was performed by our GPU-based simulation method. Then the electro-physiological data sets were visualized on-line by
multi-modality visualization method. Meanwhile, simulation data sets were stored onto the disk and could be visualized by our simulation data sequence visualization method which could provide the animation of the electrophysi-ological simulation.
A. GPU-based electrophysiological simulation method
The Compute Unified Device Architecture (CUDA), a heterogeneous CPU+GPU architecture introduced by NVIDIA, has greatly improved the programmability of GPUs for general purpose applications [21], [22]. For cardiac electrophysiological simulation, the state of each cell in cardiac is independent of each other. So the simu-lation of the cells can be executed in parallel by the Single Instruction Multiple Thread (SIMT) model supported by CUDA. In this study, we use the TNNP model [23] of human ventricle to represent the excitable dynamics of cardiac tissue. The following equation defines the transmembrane voltage V:
Vm =
Iion+Istim
Cm
+▽ ·(D▽Vm) (1)
Iion = IN a+IKl+Ito+IKr
+IKs+ICaL+IN aCa+IN aK
+IpCa+IpK+IbCa+IbN a (2)
where▽denotes the gradient operator,Cmis the cellular capacitance, and D is the diffusion tensor. Iion and
Istim are sum of all transmembrane ionic currents and externally stimulus current, respectively. Eq. (1) subject to the zero flux boundary conditions:
▽ ·(D▽Vm) = 0 (3)
To automatically handle the boundary conditions of anatomical heart geometries, a phase-field method is employed [24]. An auxiliary fieldϕis introduced, which has a value of 1 inside the ventricle and 0 outside the ventricle but within the bounding box [25].
ϕ(ξ) =
{
1, if ξ∈Ωven 0, if ξ∈Ωbox−Ωven
(4)
The value of ϕis calculated by the following equation:
∂ϕ ∂t =ξ
2−∂G(ϕ)
∂ϕ (5)
where ξ is used to control the width of the interface between the ventricle and the bounding box, and G(ϕ) is a double-well function with minima at ξ∈ Ωven and
ξ∈(Ωbox−Ωven). We choose the function as follows:
G(ϕ) =−(2ϕ−1) 2
4 +
(2ϕ−1)
8 (6)
and Eq. (6) is modified as:
ϕ∂V ∂t =−ϕ
Iion+Isim
Cm
+ϕ▽(D▽V) (7)
We denote phase-field profile as phase-field information of the tissue.
Algorithm 1:GPU-based cardiac electrophysiological simulation method
Input: Anatomical information.
Output: Cardiac electrophysiological simulation results.
1 generate phase-field profile, initialize the voltage volume and the states variables;
2 set up spatial and temporal step size;
3 transfer the phase-field profile, the voltage volume and the states variables into device memory; 4 while not go through all the temporal stepsdo
5 if predefined condition satisfied then
6 transfer the voltage volume back into the host memory and write the voltage volume into the disk ;
7 end
8 update the voltage of each voxel in the voltage volume via Eq. (7) ;
9 go to next temporal step;
10 end
During the execution, all state variables associated with the equations of the TNNP model reside on the GPU memory in order to maximize performance. The solution of Eq. (7) is transferred back to the host memory only when the voltage data have to be saved into the disk.
In this study, Eq. (7) is integrated with the spatial step of 0.15mm and the temporal step of 0.02ms. The interface
ξbetween the ventricle and the bounding box is 0.33mm, and the forward Euler scheme is adopted.
B. GPU-based Visualization for 3D Electrophysiological Data
After the simulation of wave propagation on 3D cardiac tissue is completed, we study visualization methods that not only provide the visualization of the simulation result-s, but also provide the anatomical context and the tempo-ral information of the electrophysiological behaviour.
Volume rendering is an effective method to generate 2D images from volume data, which has been applied in electrophysiological simulation data sets [7]. However, visualizing the tissue with electrophysiological behaviour without spatial supporting information is not a good idea. Inspired by work presented in [26], we need to provide a anatomical context for the given tissue.
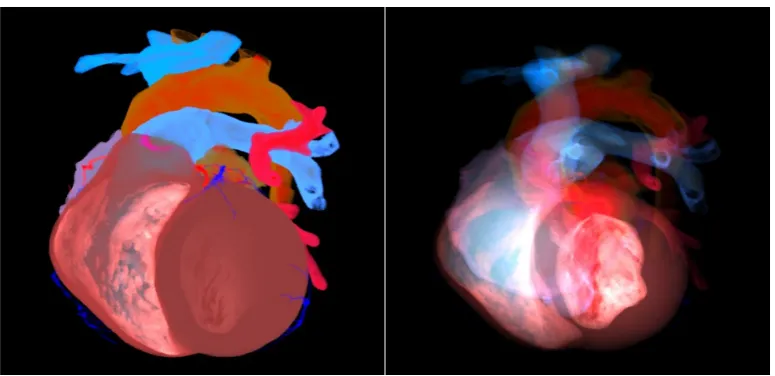
1) Visualization of electrophysiological data with anatomical context: Visualizing the whole heart as the anatomical context is a challenging problem. On the one hand, from Fig. 1a we can see if we enhance surface information interior objects will be occluded by other in the front. On the other hand, Fig. 1b shows that if we try to uncover the objects inside the rendering volume the silhouette of the whole will be lost.
To remedy this problem, Wang et al. proposed an improved Context-Preserving model for the heart anatom-ical structure visualization [19]. The rendering results are
shown in Fig. 2. Fig. 2a, and Fig. 2b are rendering results from different viewing positions.
Context-Preservingvolume rendering model was intro-duced by Bruckner et al. [27]. It is a function of shading intensity, gradient magnitude, distance to the eye and opacity of voxel. This model provides user another way to view the interior structure while keeping the context information other than conventional clipping technique. So one can visualize the interior structures of interest and the exterior structures simultaneously using the Context-Preserving model.
For the heart anatomical structure visualization, the interior structures and the boundary of different structures are shown simultaneously in Fig. 2. We further discuss the improved Context-Preserving model for the heart anatom-ical structure in details. Conventional volume rendering [28] method uses discrete approximation of integral along a viewing ray by the front to back formulation to compute opacity αi and colorci:
αi=αi−1+α(Pi)(1−αi−1) (8)
ci=ci−1+c(Pi)α(Pi)(1−αi−1) (9)
whereα(Pi)andc(Pi)are opacity and color contributions at positionPi,αi−1andci−1are previous sum of opacity and color. Lighting is another key ingredient of volume illustration [29]. In particular, lighting can enhance the material boundaries for classification and highlight the surface and silhouette of certain object. For the Context-Preserving model, lighting intensity serves as an input to a function for opacity variation. Opacity variation is then used for visual feature selection. In general, direct volume rendering with shading, α(Pi) and c(Pi) are defined as follows:
α(Pi) =αtf(fPi) (10)
c(Pi) =ctf(fPi)s(Pi) (11)
where αtf and ctf are the opacity and color transfer functions. They map each scalar value to opacity and color in volume illustration literature.s(Pi), which is the value of shading intensity at point Pi, is computed as follows:
s(Pi) =cd(n·l) +cs(n·h)ce+ca (12)
where cd, cs andca are the diffusion, specular and am-bient lighting coefficients, respectively.ceis the specular exponent,nis the normal,lis the normalized light vector, andhis the normalized half-way vector. For conventional direct volume rendering, the opacity at point Pi is only determined by the scalar valuefPiand the opacity transfer
function. For layered heart structure, boundaries informa-tion is of great importance to highlight the transformainforma-tion from one tissue to another. So gradient information should be taken into account for opacity-modulation [30]. The opacity-modulation additionally scales the opacity by the gradient magnitude, causing an enhancement of bound-aries information.
(a) Visualization of the silhouette information (b) Visualization of the interior structures
Figure 1: Rendering results of ray-casting method to show the contour information and the interior structures with different opacity set-ups. (a) is used to show the contour of the human heart but the interior information is nearly missing. (b) is used to reveal the interior tissues, while the exterior tissues becomes semitransparent and hard to exhibit the surface curvature.
(a) Contex-Preserving 1 (b) Contex-Preserving 2
Figure 2: Rendering results from two different view points.
effect of clipping-plane, the opacity α(Pi)is revised as Eq. 13.
α(Pi) =αtf(fP i)·m(Pi) (13)
wheremPi is described as follows:
mPi=|g|
(κt·s(P i)·(1−|p−e|)·(1−αi−1))κs (14)
where |g| is the gradient magnitude normalized to the range [0, 1] (zero corresponds to the lowest and one to the highest gradient magnitude in the data set), s(Pi) is the shading intensity at the current sample positionp,|p−e|
is the distance of the current sample positionpto the eye pointe.κtcontrols the basic slope, and the parameterκs is used to interactively tune the transfer function to view the curvature. For our implementation, κt is in the range
of [0,2]. The larger of the κt, the more tissues near the view point would be deemphasized. κs is in the range of [0,3]. The silhouette information of the heart can be enhanced by increasing theκs value.
Due to the layered and complex structure, the detailed information will be of great importance. In order to enhance the silhouette and boundary between different tissues we use the Blinn-Phong model [31] to rewrite the color formulation.
cw=c(p) +weight·(LBP Shading) (15)
where weight is in the range of [0,1] andLBP Shading
is the Blinn-Phong model. The modified formulation is described as follows:
The boundary information is highlighted via the local shading.
After the improved Context-Preserving model for car-diac anatomical structure is proposed, we adopt the volume visualization method [32] to visualize the multi-modality volume data which include both the synthetic data from aforementioned simulation and the anatomy data from Visible Human Project [33]. The two different modalities can enhance the in-depth analysis. The elec-trophysiological simulation data sets which are necessary might be visible in simulation data but not in the other one and vice versa. Therefore, it is possible to see the necessary part for a heart diagnosis in the combination of two different data sets. The rendering results of traditional ray-casting method and the fusion method were shown and discussed in [20], [32].
2) Visualization of the time-varying feature of electro-physiological data sets: After the multi-volume visualiza-tion method was adopted to generate anatomical context for the electrophysiological data visualization, the tissue with the electrophysiological behavior was better illustrat-ed. However, the time-varying feature is not explored yet. The ideal method is to visualize the electrophysiological data on-line, i.e., the simulation results are directly visu-alized via Graphics Interoperability without data transfer between host and device [20]. However, this would be not suitable for the 3D electrophysiological simulation, because the simulation is more time-consuming and the difference of the voltage distribution between two tempo-ral steps is minor. To remedy this problem, we provided an off-line visualization method for 3D electrophysiological data sequence with user interaction.
The proposed method can provide not only the spatial information but also the temporal information. The detail of the proposed method is presented as follows:
Algorithm 2: Visualization method for 3D cardiac electrophysiology simulation data sequence
Input:DataA,DataSi, i= 0,1, ..., N,T.
Output: Rendering results of simulation data sequence to reveal the time varying feature 1 Initialization:i= 0;
2 VA=Load(DataA);
3 while i < N do
4 VS =Load(DataSi);
5 M ultiV olumeV is(VA, VS); 6 i=i+T;
7 end
The method takes the anatomical dataDataA, the elec-trophysiological simulation data sequence DataSi, i = 0,1, ..., N as inputs first. The T is used to control the interval of two data sets. FunctionLoadis used for load-ing volume data into host memory then transferrload-ing the volume data into 3D texture on GPU.M ultiV olumeV is
denotes the multi-volume visualization method for both electrophysiological simulation data sets and the anatom-ical context [32]. During the visualization procedure, user
TABLE I.: Parameters of Multi-Volume visualization method [32]
Parameters Values
κt 0.1
κs 2
weight 0.06
β 0.4
interaction is provided for obtaining satisfied visualization results.
III. RESULTS ANDDISCUSSION
In order to evaluate the performance of the proposed simulation method, the female heart data of Visible Hu-man Project [33] are used for providing the anatomically detailed information for generating thephase-field profile. Our framework is ran on an Intel(R) Core (TM) 2 Duo CPU E7500 with NVidia Tesla C1060 GPU for the simulation of the wave propagation and NVidia GeForce 9600 GPU for visualization methods.
The wave propagation simulation of ischemia kernel code is written in CUDA 4.0. The C1060 GPU is used for evaluating the cardiac electrophysiology model of size 200×200×300. The cells were gathered into a volume stored in GPU global memory and then divided into a 2D memory stack. Each 2D memory stack is consisted of (19,13) grid with each block of size (16,16) and the x-axis iteration was performed [34] in the kernel. In order to perform efficient memory access, the constant parameters of TNNP model during simulation were stored in GPU constant memory and the phase-field profile was stored in a 3D texture, respectively. The experimental results show that the speed-up of our simulation method is more than 20 times faster compared to CPU simulation method.
The proposed multi-modality visualization method for electrophysiological simulation data has been coded in C++ with OpenGL and Cg 3.0. The rendering perfor-mance for the multi-modality rendering method is about 25 frames per second and meets the requirement of a real time system. When rendering the simulation sequence, since the I/O of a single simulation data is minor, the multi-modality method for simulation data sequence can also provide real-time rendering results.
The electrophysiological data sequence visualization with GPU-based ray-casting method is shown in Fig.3.
The electrophysiological data sequence visualization with Alg. 2 is shown in Fig.4. The parameters of Fig. 4 used in Alg. 2 are presented in Table I. The values κt andκsinsure that the layered structure of the anatomical context is properly illustrated. The value ofweightmakes the anatomical context an assistant volume by shading the anatomical structure with few effort. And β is used to control the fusion of the anatomical data and the simulation data [32]. The value ofβ is used to show that the electrophysiological simulation data are predominant in the rendering results.
anatom-(a) time 1 (b) time 2 (c) time 3
Figure 3: Electrophysiological simulation set sequence visualization results via ray-casting method.
(a) time 1 (b) time 2 (c) time 3
Figure 4: Data sequence visualization results. From left to right the pictures can provide the time-varying feature of the 3D electrophysiological simulation.
ical context, the tissue with electrophysiological behavior is more easily to recognize in the complex layered struc-ture.
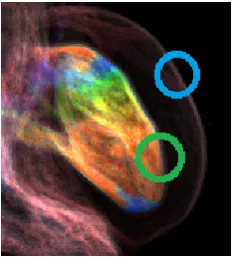
Fig. 5 shows the detailed information of Fig. 4a. The boundary information of the whole heart is clearly rendered, which is surrounded by the blue oval. The boundary between the tissue with electrophysiological simulation and the anatomical context is also clearly conveyed, which is surrounded by the green oval.
IV. CONCLUSIONS
In this paper, we introduced the G-Heart system, a framework which exploited advanced GPU computing for both simulation 3D electrical wave propagation on human heart tissue and visualization of the simulation results. Other than the studies that were either focused on electrophysiological simulation or the electrophysi-ological simulation data visualization, we presented a unified process for the electrophysiological simulation and the simulation results evaluation by visualization. The advent of the G-Heart has bridged the gap between the electrophysiological simulation and its visualization,
Figure 5: Detailed information of the rendering result.
fea-ture of the cardiac electrophysiology. Results show that the G-Heart framework, can greatly reduce the electro-physiological simulation time and provide high quality rendering results of the electrophysiological simulation data. The proposed methods in this paper, such as multi-modality electrophysiological data sequence visualization, can be easily adopted to other medical applications. In future work, we plan to refine our visualization method for improving both rendering quality and performance.
ACKNOWLEDGMENT
The authors are grateful to the anonymous referees for their valuable comments and suggestions to improve the presentation of this paper. The work is partially supported by the National Natural Science Foundation of China (NSFC) under Grants No. 61173086, Shandong province science and technology development planning (2012GSF12105) and Youth Foundation of Harbin Uni-versity under Grants No. HUYF2013-025. Parts of the paper were presented at the 2011 IEEE Conference on Computing in Cardiology, Hangzhou, China.
REFERENCES
[1] B. Rodriguez, N. Trayanova, and D. Noble, “Modeling cardiac ischemia,” Annals of the New York Academy of Sciences, vol. 1080, no. 1, pp. 395–414, 2006.
[2] F. B. Sachse, Computational cardiology: modeling of anatomy, electrophysiology, and mechanics. Berlin, Ger-many: Springer Verlag, 2004.
[3] A. J. Pullan, L. K. Cheng, and M. L. Buist,Mathematically Modeling the Electrical Activity of the Heart: From Cell to Body Surface and Back. Singapore: World Scientific Publishing Company, 2005.
[4] D. Noble, “From the hodgkin-huxley axon to the virtual heart,”The Journal of Physiology, vol. 580, no. 1, pp. 15– 22, 2007.
[5] O. Bernus, H. Verschelde, and A. Panfilov, “Reentry in ananatomical model of the human ventricles,” Internation-al JournInternation-al of Bifurcation and Chaos, vol. 13, no. 12, pp. 3693–3702, 2003.
[6] F. H. Fenton, E. M. Cherry, A. Karma, and W.-J. Rappel, “Modeling wave propagation in realistic heart geometries using the phase-field method,”Chaos: An Interdisciplinary Journal of Nonlinear Science, vol. 15, no. 1, pp. 013 502– 013 502, 2005.
[7] W. Lu, K. Wang, W. Zuo, T. Liu, and H. Zhang, “Sim-ulation of effects of ischemia in 3d human ventricle,” in Computing in Cardiology, 2009, pp. 477–480.
[8] S. Niederer, L. Mitchell, N. Smith, and G. Plank, “Sim-ulating human cardiac electrophysiology on clinical time-scales,” International Journal of Bifurcation and Chaos, vol. 2, no. 14, pp. 1–7, 2011.
[9] M. Reumann, B. G. Fitch, A. Rayshubskiy, D. Keller, G. Seemann, O. Dossel, M. C. Pitman, and J. J. Rice, “Strong scaling and speedup to 16,384 processors in cardiac electro–mechanical simulations,” inEngineering in Medicine and Biology Society, 2009. EMBC 2009. Annual International Conference of the IEEE. IEEE, 2009, pp. 2795–2798.
[10] E. Lindholm, J. Nickolls, S. Oberman, and J. Montrym, “Nvidia tesla: A unified graphics and computing,” IEEE Micro, vol. 28, no. 2, pp. 39–55, 2008.
[11] D. Luebke, “Cuda: Scalable parallel programming for high-performance scientific computing,” International Symposium on Biomedical Imaging, pp. 836–838, 2008.
[12] Z. Wang, S. Peng, and T. Liu, “Gpu accelerated 2-d staggered-grid finite difference seismic modelling,” Jour-nal of Software, vol. 6, no. 8, pp. 298–305, 2011. [13] E. Vigmond, P. Boyle, L. Leon, and G. Plank,
“Near-real-time simulations of biolelectric activity in small mam-malian hearts using graphical processing units,” Engineer-ing in Medicine and Biology Society, pp. 3290–3293, 2009. [14] D. Sato, Y. Xie, J. Weiss, Z. Qu, A. Garfinkel, and A. Sanderson, “Acceleration of cardiac tissue simulation with graphic processing units,” Medical and Biological Engineering and Computing, vol. 47, no. 9, pp. 1011– 1015, 2009.
[15] V. K. Nimmagadda, A. Akoglu, S. Hariri, and T. Mouk-abary, “Cardiac simulation on multi-gpu platform,” The Journal of Supercomputing, vol. 59, no. 3, pp. 1360–1378, 2012.
[16] V. Hurmusiadis, “Virtual heart: Simulation-based cardiac physiology for education,” in Computing in Cardiology, 2007, pp. 65–68.
[17] K. Wang, F. Yang, W. Zuo, N. Ding, and H. Zhang, “Ef-fective transfer function for interactive visualization and multivariate volume data,” in Proceedings of Biomedical Engineering and Informatics, 2011, pp. 272–276. [18] S. Kharche, G. S. L. Margetts, J. Leng, A. V. Holden,
and H. Zhang, “Simulation of clinical electrophysiology in 3d human atria: a performance computing and high-performance visualization application,” Concurrency and Computation: Practice & Experience, vol. 20, no. 11, pp. 1317–1328, 2008.
[19] K. Wang, L. Zhang, C. Gai, and W. Zuo, “Illustrative visu-alization of segmented human cardiac anatomy based on context-preserving model,” in Computing in Cardiology, 2011, pp. 485–488.
[20] L. Zhang, C. Gai, K. Wang, W.Lu, and W. Zuo, “Gpu-based high performance wave propagation simulation of ischemia in anatomically detailed ventricle,” inComputing in Cardiology, 2011, pp. 469–472.
[21] H. Wang and Q. Chen, “Power estimating model and analysis of general programming on gpu,” Journal of Software, vol. 7, no. 5, pp. 1164–1170, 2012.
[22] Y. Zhang and X. Chen, “Constructing and rendering of multiresolution representation for massive meshes with gpu and mesh layout,”Journal of Software, vol. 8, no. 8, pp. 1968–1975, 2013.
[23] K. Tusscher, D. Noble, P. Noble, and A. Panfilov, “A model for human ventricular tissue,”Heart and Circulatory Physiology, vol. 286, no. 4, pp. 1573–1589, 2004. [24] F. Fenton, E. Cherry, A. Karma, and W. Rappel, “Modeling
wave propagation in realistic heart geometries using the phase-field method,” Chaos, vol. 15, no. 1, p. 013502, 2005.
[25] A. Bueno-Orovio, V. P´erez-Garc´ıa, and F. Fenton, “Spec-tral methods for partial differential equations in irregular domains: the spectral smoothed boundary method,” Jour-nal of Scientific Computing, vol. 28, no. 3, pp. 886–900, 2006.
[26] R. Friedemann, T. Eduardo, F. Thomas, E. Thomas, and K. Markus, “Gpu-based multi-volume rendering for the visualization of functional brain images,” inProc. of Simu-lation und Visualisierung 2006 (SimVis 2006), Magdeburg, Germany, 2006, pp. 305–318.
[27] S. Bruckner, S. Grimm, A. Kanitsar, and M. Groller, “Illustrative context-preserving exploration of volume da-ta,” IEEE Transactions on Visualization and Computer Graphics, vol. 12, no. 6, pp. 1559–1569, 2006.
[28] N. Max, “Optical models for direct volume rendering,” IEEE Transactions on Visualization and Computer Graph-ics, vol. 1, no. 2, pp. 99–108, 1995.
gradient aligned sampling,” in IEEE Visualizaiton, 2004, pp. 289–296.
[30] D. Ebert, C. Morris, P. Rheingans, and T. Yoo, “Designing effective transfer functions for volume rendering from pho-tographic volumes,” IEEE Transactions on Visualization and Computer Graphics, vol. 8, no. 2, pp. 183–197, 2002. [31] J. Blinn, “Models of light reflection for computer syn-thesized pictures,” inProceedings of the 4th annual con-ference on Computer graphics and interactive techniques, vol. 11, no. 2, 1977, pp. 192–198.
[32] L. Zhang, K. Wang, W. Zuo, and M. Yang, “Real-time multi-volume rendering for 3d electrophysiological data visualization based on graphics processing unit,” ICIC Express Letters Part B: Applications, vol. 4, no. 6, pp. 1–6, 2013.
[33] “The visible human project.” [Online]. Available: http: //www.nlm.nih.gov/research/visible/
[34] P. Micikevicius, “3d finite difference computation on gpus using cuda,” inProceedings of 2nd Workshop on General Purpose Processing on Graphics Processing Units, 2009, pp. 79–84.
Lei Zhangwas born in Heilongjiang province, China, in 1980. He is currently a PhD student in the School of Computer Science and Technology at the Harbin Institute of Technology, China. He received his MS degree from the Harbin Institute of Technology in 2008. He is also a lecture in the Harbin University. His research interests include GPU-based visualization, GPGPU, and virtual reality.
Kuanquan Wangwas born in Chongqing, China, in 1965. He is a full professor and PhD supervisor with School of Computer Science and Technology at Harbin Institute of Technology. He is a senior member of IEEE, a senior member of China Computer Federation and a senior member of Chinese Society of Biomedical Engineering. His main research areas include image processing and pattern recognition, biometrics, biocomputing, virtual reality and visualization. So far, he has published over 200 papers and 6 books, got 10 patents, and won 1 second prize of National Teaching Achievement.
Wangmeng Zuowas born in Henan Province, China, in 1977. He received the Ph.D. degree in computer application technolo-gy from Harbin Institute of Technolotechnolo-gy, Harbin, China, in 2007. From July 2004 to December 2004, from November 2005 to August 2006, and from July 2007 to February 2008, he was a Research Assistant in the Department of Computing, Hong Kong Polytechnic University. From August 2009 to February 2010, he was a Visiting Professor in Microsoft Research Asia. He is currently an Associate Professor in the School of Computer Science and Technology, Harbin Institute of Technology. His current research interests include sparse representation, biomet-rics, pattern recognition, and computer vision. Dr. Zuo is CCF member and IEEE CS member.