International Journal of Pharmaceutical Research & Allied Sciences, 2016, 5(2): 335-341
Research Article
CODEN(USA) : IJPRPM
ISSN : 2277-3657
Separation and Quantification of Major Anti-Oxidant Compounds in Freeze
Dried Samples of
Punica granatum Juice by High Performance Liquid
Chromatography
Kamal Y. T.*, Hasan Soliman Yusufoglu, Prawez Alam and Ahmed Ibrahim Fouda
Department of Pharmacognosy, College of Pharmacy, Prince Sattam Bin Abdulaziz University, P.O. Box 173, Al-Kharj 11942, Kingdom of Saudi Arabia
*Correspondence E-mail: [email protected]
_____________________________________________________________________________________________
ABSTRACT
A new HPLC method has been developed for the chromatographic separation and simultaneous quantitative determination of anti-oxidant compounds (vitamin C, gallic acid, rutin and ellagic acid) in pomegranate freeze dried juice samples. Separation was accomplished on a C18 column (250 x 4.6mm, particle size 5 µm, Merck, Germany) with a gradient elution and recorded at 254 nm. The flow rate was kept as 1.0 mL-1. All calibration curves showed good linear regression (r2 ≥ 0.9925) within test ranges. Low LOD & LOQ values proved the sensitivity of the method. The proposed method was validated according to ICH guide lines for accuracy (97.2-102.5%), precision (0.12-1.87% RSD), and robustness (0.26-2.30% RSD). The results demonstrated that the proposed method is reproducible, accurate, economic and suitable for the quality control of different commercial products which contain pomegranate as an ingredient.
Key words: Quality control, polyherbal formulation, simultaneous determination
_____________________________________________________________________________________________
INTRODUCTION
The use of herbal products for the prevention and treatment of various health ailments has been in practice from time immemorial. Generally it is believed that the risk associated with herbal products is very less, but reports on serious reactions are indicating to the need for development of effective marker systems for isolation and identification of the individual components. Standardization, stability and quality control for herbal drugs are feasible, but difficult to accomplish (1). The present study attempts to develop a multi-component HPLC assay method which will help in the quality control of commercially available pomegranate juices.
Pomegranate is one of the largely consumed fruit all over the world due to its multiple beneficial effects on human health. Even though fruit has been known for its health benefits from decades, the recent scientific research on its anti-oxidant properties increased the demand of pomegranate as various food and cosmetic products. This scenario brought different forms of food and beverages stuffs in the market like juices, jelly, molasses, concentrate and aerated beverages, syrups, wine etc., as many consumers believe it to be a preferred food to be included in everyday nutrition. This fruit is rich in anthocyanins and ellagitannins, which exert a protective role towards degenerative diseases (2-3).
all verities of pomegranate. Presence of these phenolic compounds and vitamins makes the fruit a strong anti-oxidant in nature (4).
Literature survey reveals that up to now no methods have been reported on the quantitative analysis of freeze dried pomegranate juice on the anti-oxidant phenolic compounds. In most of the previous studies, phenolic and flavanoid constituents in various herbal samples had been analyzed by HPTLC (5), CAD (6), DAD (7), HPLC-DAD-ESIMS (8) and HPLC-PDA (9) methods with the emphasis on individual components. In addition most of the methods reported on the quality control of deals only with the quantification of one or two components. The HPLC methods reported on the simultaneous quantification of multi component products fails to suggest a proper extraction procedure in order to attain the maximum recovery of all the markers. The direct injection of such samples in HPLC will lead to interference of targeted marker components with other moieties present in the sample and the compounds in lower concentrations cannot be detected.
Bioactive concentration and composition of pomegranate juice are strongly influenced by cultivar, climatic conditions, maturity status and juice extraction methods of the fruits collected for the process (10-14). So it is very necessary to have a sophisticated quality control method through which the exact quantification of markers can be made. The aim of the study is to develop a simple, reliable and reproducible method on the simultaneous determination of multiple active components present in these commonly used commercial products for their quality control as well as to propose an optimised extraction procedure in order to improve the recovery of all four marker constituents.
MATERIALS AND METHODS
Samples, chemicals, solvents and standards
HPLC grade acetonitrile and methanol (E. Merck, Darmstadt, Germany) were used for the analysis. Deionized water was purified by Milli-Q system (Millipore, Bedford, MA, USA). Ortho-phosphoric acid (H3PO4) 88% was
purchased from Fisher Scientific Company (UK). All the standards (˂99% purity) were purchased from Sigma– Aldrich, St. Louis, MO, USA.
Chromatographic conditions and instrumentation
The analysis was carried out on a Waters Alliance e2695 separating module (Waters Co., MA, USA) using UV detector (Waters 2998) with autosampler and column oven. The instrument was controlled by use of ‘EMPOWER’ software installed with equipment for data collection and acquisition. Compounds were separated on a C18 reverse
phase column (250 x 4.6mm, particle size 5 µ m, Merck, Germany) maintained at room temperature. The mobile phase consisted of solvent A (0.05%, v/v solution of orthophosphoric acid) and solvent B (acetonitrile containing 0.5% mobile phase A) with the elution profile as follows: 0–20% B at 0–10 min, 20–22% B at 10–15 min, 22–30% B at 15–20 min, 30–40% B at 20–25 min, 40–50% B at 25–30 min, 50–60% B at 30–35 min, 60–80% B at 35–60 min and the re-equilibration time for each gradient elution was 15 mins. The flow rate was 1.0 mL/min; the column was maintained at room temperature.
Sample preparation
The extraction procedure was optimised prior to preparation of sample for the complete recovery of all desired components of analysis using different compositions of methanol: water varying time for extraction by sonication, which was monitored using proposed HPLC method. The juice was freeze-dried in a Millrock LD85 tray type freeze dryer (Millrock Technology, USA) at –40ºC for 24 hours, and stored in air tight container at -18 ºC until extraction, since it is highly hygroscopic in nature. Two g freeze dried samples (in triplicate) were taken separately from each batch in a 50 ml conical flask and 25 ml of solvent (70 % methanol) was added and mixed well. It was sonicated for 40 minutes at room temperature and filtered using Whatman filter paper no. 4 (the extraction solvent and time of sonication was optimised and selected after several trials for maximum recovery of all four components). The filtrate obtained was transferred to a separating funnel (100 ml volume) and extracted with 25 mL of hexane to remove undesired nonpolar compounds. Aqueous methanolic extract was dried using rotavapor below 40ºC and the residues obtained was reconstituted in 10 mL of solvent i.e. methanol: water (70:30, v/v), further transferred to 25 mL of volumetric flask and make up the volume. All the sample solutions were filtered through 0.22 µm syringe filter before injecting.
Method validation
Linearity
Accuracy
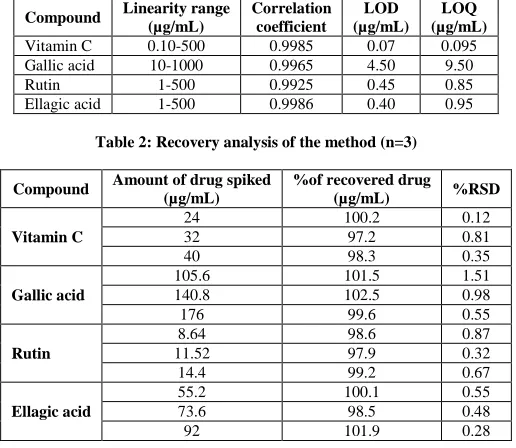
The accuracy of the method was determined as recovery by standard addition method. Pre-analyzed samples were spiked with standards at three different concentration levels i.e. 50,100 and150% and the mixtures were re-analyzed by the proposed method. Data obtained, was analyzed for % recovery.
Precision
The precision of the method was carried out by doing intermediate precision. In intermediate precision, intra-day and inter-day precisions were carried out. Intra-day and inter-day precisions were done by preparing and applying three different concentrations of standard in triplicate six times a day and similarly on six different days, respectively. Assay for each analysis was calculated and % RSD was determined.
Robustness
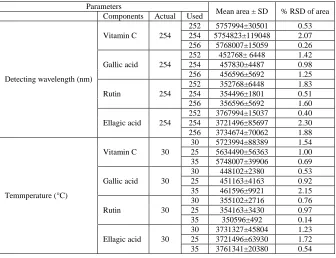
Robustness of the proposed method was determined at 100 µg mL-1 in two different ways, i.e. by changing the detecting wavelength and analyzing temperature. The % RSD of the experiment was calculated to assess the robustness of the method (Table 3).
LOD & LOQ
Limit of quantification (LOQ) is the lowest amount of an analyte in a sample that can be quantitatively determined with suitable precision (signal to noise ratio of 10). Limit of detection (LOD) is the minimum concentration of analyte that can be detected with acceptable certainty, though not quantifiable with acceptable precision (signal to noise ratio of 3).
RESULTS AND DISCUSSION
Optimization of chromatographic conditions
Since the polarity range of the components is very narrow, gradient elution was carried out to separate maximum components. The mobile phase was selected using different compositions of methanol–water and acetonitrile–water with some modifiers including orthophosphoric acid, formic acid, acetic acid, phosphate buffer, acetate buffer with different pH values adjusted using triethyl amine and ammonia, which were investigated under different gradient elution modes. After many trials, excellent separation of all components were achieved on solvent A (0.05%, v/v solution of orthophosphoric acid) and solvent B (acetonitrile containing 0.5% mobile phase A), in gradient elution upto 60 minutes, the representative HPLC chromatograms of all the four reference compounds and samples are shown in Figure 1 & 2. In order to detect all four components with good sensitivity, 254 nm wavelength was selected as the detecting wavelength for the analysis.
Table 1. Linearity of the method
Compound Linearity range (µg/mL)
Correlation coefficient
LOD (µg/mL)
LOQ (µg/mL)
Vitamin C 0.10-500 0.9985 0.07 0.095
Gallic acid 10-1000 0.9965 4.50 9.50
Rutin 1-500 0.9925 0.45 0.85
Ellagic acid 1-500 0.9986 0.40 0.95
Table 2: Recovery analysis of the method (n=3)
Compound Amount of drug spiked (µg/mL)
%of recovered drug
(µg/mL) %RSD
Vitamin C
24 100.2 0.12
32 97.2 0.81
40 98.3 0.35
Gallic acid
105.6 101.5 1.51
140.8 102.5 0.98
176 99.6 0.55
Rutin
8.64 98.6 0.87
11.52 97.9 0.32
14.4 99.2 0.67
Ellagic acid
55.2 100.1 0.55
73.6 98.5 0.48
Table 3. Precision of the method (n=3)
Analytes Retention time (RSD) % Peak area RSD (%)
Vitamin C
Intra-day Inter-day Intra-day Inter-day
0.22 1.85 0.55 0.48
1.24 1.35 0.68 0.64
0.25 0.89 1.24 0.63
Gallic acid
077 0.64 0.12 1.11
0.33 0.58 0.48 1.54
1.7 0.25 0.28 0.88
Rutin
0.92 0.34 1.62 0.27
1.10 0.49 0.45 1.58
0.56 0.84 0.36 0.91
Ellagic acid
0.87 1.27 1.44 0.87
0.54 1.87 1.28 0.88
0.67 0.62 0.87 0.48
Table 4.Robustness of the method by changing detection wavelength and column temperature
Parameters
Mean area ± SD % RSD of area Components Actual Used
Detecting wavelength (nm)
Vitamin C 254
252 5757994±30501 0.53 254 5754823±119048 2.07 256 5768007±15059 0.26
Gallic acid 254
252 452768± 6448 1.42
254 457830±4487 0.98
256 456596±5692 1.25
Rutin 254
252 352768±6448 1.83
254 354496±1801 0.51
256 356596±5692 1.60
Ellagic acid 254
252 3767994±15037 0.40 254 3721496±85697 2.30 256 3734674±70062 1.88
Temmperature (°C)
Vitamin C 30
30 5723994±88389 1.54
25 5634490±56363 1.00
35 5748007±39906 0.69
Gallic acid 30
30 448102±2380 0.53
25 451163±4163 0.92
35 461596±9921 2.15
Rutin 30
30 355102±2716 0.76
25 354163±3430 0.97
35 350596±492 0.14
Ellagic acid 30
30 3731327±45804 1.23
25 3721496±63930 1.72
35 3761341±20380 0.54
Optimization of extraction procedure for sample preparation
The optimization of extraction methodology needs to be investigated in order to obtain satisfactory extraction efficiency, which must enables complete extraction of the compounds of interest avoiding chemical modification (11). In attempt to find the optimum solvent composition and extraction time, different solvent ratios were tried for extraction and the recoveries all components at different time intervals were also monitored by the HPLC method. Aqueous methanol was supposed to be a suitable solvent for the extraction of phenolic and flavanoid compounds than 100% methanol (14, 15, 16). Moreover, as per the solubility studies aqueous methanol found to be suitable for the other compounds also hence the extracts obtained after extracting with 5 different compositions of solvents including, methanol-water (80:20, 70:30, 60:40 and 50:50 v/v) and methanol at different time intervals of 10, 20, 30, 40, 50 and 60 mins were washed with hexane. It was observed that the concentrations of all four components were remarkably affected by the variations in the composition of methanol: water. Optimization of extraction procedure was aimed to maximize the recovery of all the components, 70% methanol in water found to be optimum for the extraction of all the components. The content of all components were increased from the time of 0-40 mins and then there was not any considerable difference in the content from 40-60 min. So the optimum extraction time for the samples was set as 40 mins in 70% methanol.
Method validation
Linearity
Fig. 1. Representative HPLC chromatogram at 254 nm of four reference standards
Accuracy
The accuracy of the method was determined by recovery studies using standard addition method. Pre-analyzed samples were spiked with standards of vitamin C, gallic acid, rutin and elagic acid at three different concentration levels i.e. 50,100 and150% and the mixtures were reanalyzed by the proposed method. Data obtained, was analyzed for % recovery (Table 2).
Precision of the method
Intra-day and inter-days precision were studied by triplicate assay at three different quantities (50, 100, 200 µg mL
-1). Low RSD values indicated the method was precise (Table 3).
Fig. 2. HPLC chromatogram of freeze dried pomegranate juice at 254 nm
LOQ and LOD.
Robustness
Robustness of the method was carried by introducing very small changes in the analytical methodology at single concentration level. Robustness of the proposed method was determined in two different ways, i.e. by making deliberate change in the detection wavelength and column temperature. The % RSD of the experiment was calculated to assess the robustness of the method (Table 4).
Application in real samples
The freeze dried juice of pomegranate was analyzed by developed HPLC method. The content of vitamin C, gallic acid, rutin and ellagic acid was found 0.020±0.002%w/w, 0.088 ±0.011, 0.0072±0.0001 and 0.046±0.0016 % w/w, respectively.
CONCLUSION
The HPLC-PDA method was developed and successfully employed for the identification and quantification of four major marker components in freeze dried pomegranate juice samples. All the samples were analyzed according to the optimized extraction procedure described earlier in the section. Identification of the peaks in the sample chromatograms were carried out by comparing retention of each component. The content of each analyte was calculated from the corresponding calibration curve. There were no remarkable differences in the quantities of all these components in the three batches.
An increase in demand in the usage of pomegranate and its various products has been found worldwide in recent years mainly due to the high anti-oxidant properties. By considering this fact in mind a RP-HPLC method reported here represents; a simple, accurate and rapid technique for the simultaneous determination of four major marker constituent responsible for the anti-oxidant activity (vitamin C, gallic acid, ellagic acid and rutin). This was the first report on the simultaneous determination these 4 markers in freeze dried extract of pomegranate juice. The main advantage of the method includes the simplicity of extraction procedure, simultaneous detection and quantification of all the bioactive components in a single chromatographic run. The quantification limits were found to be low enough for the successful employment of the method in different products which contains these components even in very minute quantities The efficiency of the method was evaluated from conducting recovery experiments and the results found to be promising, which indicates that the method can be executed successively in various pomegranate products with high accuracy and precision. The linearity experiments conducted proved the method can be applied for the samples which contain these components in a wide range. In conclusion, the proposed method is useful as a reliable, fast and effective tool for the quality control as well as standardization of different value added products of pomegranate. This simple multi-component assay method can also be extended for the pharmacological, biopharmaceutical and pharmacokinetic studies.
Acknowledgements
This project was supported by Deanship of Scientific Research, Prince Sattam Bin Abdulaziz University, Al-Kharj, Saudi Arabia (Project No.2015/01/1906).
REFERENCES
[1] Anonymous, The Ayurvedic Pharmacopoeia of India, Ministry of Health and Family Welfare, Department of AYUSH, Govt. of India, New Delhi, 1999; pp.34-35
[2] Gil, M.I., Tomás Barberán, F.A., Hess-Pierce, B., Holcroft, D.M., Kader, A.A., Antioxidant activity of pomegranate juice and its relationship with phenolic composition and processing, J. Agric. Food Chem., 2000 48, 4581– 4589
[3] Madrigal-Carballo, S., Rodriguez, G., Krueger, C.G., Dreher, M., Reed, J. D., Pomegranate (Punica granatum)
supplements: Authenticity, antioxidant and polyphenol composition, J. Funct. Foods, 2009, 1, 324–329
[4] Sami I. A., Farouk K.B., Gehan A.E.E., Ekhlaque A.K.., Amal A.M., HPLC-Analysis of Polyphenolic
Compounds and Free Radical Scavenging Activity of Pomegranate Fruit (Punica granatum L.), Int. J. Pharm. Clin. Res., 2014; 6, 348-355
[5] Ragazzia, E., Veronesea, G., Quantitative analysis of phenolic compounds after thin-layer chromatographic separation, J Chrom. A, 1973, 77, 369-375
[6] Jandera, P., Skeríkova, V., Rehova, L., Hajek, T., Baldrianova, L., Skopova, G., Kellner, V., Horna, A., RP-HPLC analysis of phenolic compounds and flavonoids in beverages and plant extracts using a CoulArray detector, J.
Sep. Sci. 2005, 28, 1005-1022
[7] Markowski, J., Płocharski, W., Determination of phenolic compounds in apples and processed apple products,
[8] Fanga, Z., Zhang, M., Wanga, L., HPLC-DAD-ESIMS analysis of phenolic compounds in bayberries (Myrica
rubra Sieb. et Zucc.), Food chem., 2007, 100, 845-852
[9] Revilla, E., Ryan, J.M., Analysis of several phenolic compounds with potential antioxidant properties in grape extracts and wines by high-performance liquid chromatography–photodiode array detection without sample preparation, J. Chrom. A, 2000, 881, 461-469
[10]Turfan, Ö., Türkyılmaz, M., Yemis, O., Özkan, M., Anthocyanin and colour changes during processing of pomegranate (Punica granatum L., cv. Hicaznar) juice from sacs and whole fruit, Food Chem. 2011, 129,1644– 1651
[11]Caleb, O.J., Opara, U.L., Witthuhn, C.R., Modified atmosphere packaging of pomegranate fruit and arils: a review, Food Bioprocess Tech. 2012, 5, 15–30
[12]Rajasekar, D., Akoh, C.C., Martino, K.G., Maclean, D.D., Physico-chemical characteristics of juice extracted by blender and mechanical press from pomegranate cultivar grown Georgia, Food Chem., 2012, 133, 1383–1393 [13]Mphahlele, R.R., Fawole, O.A., Stander,M.A., Opara, U.L., Effect of fruitmaturity and growing location on the postharvest contents of flavonoids, phenolic acids, vitamin C and antioxidant activity of pomegranate juice (cv. Wonderful), Scientia Horticulturae, 2014, 179, 36–45
[14]Georg, M.W., Dietmar, R., Kammerer, Reinhold, C., Identification and quantification of phenolic compounds
from sunflower (Helianthus annuus L.) kernels and shells by HPLC-DAD/ESI-MS, Food Chem., 2009, 115, 758-765
[15]Ranjith, A., Sarin, K.K., Arumughan, C.; Simultaneous estimation of phenolic acids in sea buckthorn (Hippophae rhamnoides) using RP-HPLC with DAD, J. Pharm. Biomed. Anal., 2008, 47, 31-38
[16]Lillian, B., Montserrat, D., Isabel, C.F.R.F., Ana, M.C., Celestino, S.B.; Use of HPLC–DAD–ESI/MS to profile