s Z
R
eview
A
rticle
LUNG PARENCHYMA DETECTION USING SEGMENTATION TECHNIQUES
Sandeep Kota, J.,
*Madhuri, V. and Ravi Mahesh
Department of Electronics and Computers K.L. University Vaddeswaram, AP, India
ARTICLE INFO ABSTRACT
Segmentation is the one in which the digital image is partitioned into meaningful and understandable representation. Intensity inhomogeneity is the main problem in MRI scanned images which disables and makes it difficult for doctors in diagnosing the problems and is a time taking process. Discussing the pros and cons of different algorithms and finding the best algorithm for intensity inhomogeneity images which helps the doctors for easy analysis and diagnosis
INTRODUCTION
Intensity inhomogeneity occurs in images due to the imperfections present in imaging devices and which makes difficult for doctors in understanding the problem i.e. diagnosing the disease. This difficulty can be overcome by using different segmentation techniques.
Image Segmentation: Image segmentation is the method of partitioning the image in to multiple segments such as a set of pixels also called super pixels. The main aim of segmentation is to change the representation of an image into a meaningful and make easy for analysis. Image segmentation is typically used to track objects, boundaries, lines, curves, etc. in images. Image segmentation is the process of assigning a label to each and every pixel in an image such that a pixel having the same label share certain characteristics. The output of an image segmentation is a set of segments that collectively cover the whole image, or a set of surfaces (contours) extracted from the image. Pixels in a region are similar with respect to some properties like color, intensity, texture. Adjacent regions are different with respect to same characteristics. This process, image segmentation is very useful in medical imaging.
*Corresponding author: Madhuri, V.
Department of Electronics and Computers K.L. University Vaddeswaram, AP, India.
Applications of image segmentation are machine vision, medical imaging, object detectionrecognitiontasks, control systems, videopolicework. Many techniques (algorithms) aredeveloped for image segmentation, for his or her effective use we will mix those techniques to unravel a selected domain issues. Medical imaging is the technique used to take images of the human body to analyze the organ or to know the information about the organs etc. This technique is also used to locate and track the disease causing tissues in various organs present in the body. Different image segmentation techniques are discussed here for images having intensity inhomogeneities.
Different Segmentation Techniques
Thresholding
The most straightforward strategy and the least demanding technique for picture division is thresholding system. This strategy is in view of a limit quality to transform a dim scale picture into a paired picture. The key component of this strategy is to choose the edge worth and more values are chosen when numerous levels are chosen.
Implementation of threshold segmentation is as follows
Article History:
Received 25th April 2015
Received in revised form 16th May, 2015
Accepted 24th June, 2015
Published online 31st July, 2015
International Journal of Recent Advances in Multidisciplinary Research
Vol. 02, Issue 07, pp.0499-0505, July, 2015
First step: Set the starting threshold T= (the maximum value of the image brightness + the minimum value of the image Brightness)/2;
Second step: Via T segment the image to get two sets of pixels A
(All the pixel values are less than T) and M (all the pixel values are greater than T);
Third step: Calculate the average value of B and N separately, mean µa and µm.
Fourth step: Calculate the new threshold
T= ………. (1)
Fifth step: Repeat the second step to fourth step until the iterative conditions are met.
Results of Threshold Segmentation
Fig1.1.
Fig1.2.
In Fig. 1.1 first image is the original image (before segmenting) and the second image Fig 1.2 is threshold image (after segmenting). There is an information loss in the second image due to the overlapping of gray values i.e., values above the threshold value are considered as one and the values below the threshold value are considered as zero. Minute difference in gray values are not accurately defined due to this some information is lost.
Region Growing Segmentation
Region growing is a simple region based image segmentation method. It is a pixel based image segmentation technique because here we have to select the initial seed points. Here in this segmentation we are going to group all the pixels using 8- neighbor. Pixels having the same properties are grouped using 8-neighbour. Region can be directly determined using the region based segmentation. The basic formulae for region based segmentation are
Ri=R Means that the segmentation must be complete. That is every pixel must be in a region.
Riis a connected region, i=1, 2, 3… n
Requires that points in a region must be concerned in some predefined sense.
Ri ∩Rj = Ø for all i=1, 2, 3,…… n. Indicates that regions must
be disjoint
P(Ri)= True for i=1, 2, 3,….., n Deals with the properties
that must be satisfied by the pixels in a segmented region.
Indicates that region R and R are different in the sense of predicate P.
Basics of seed points
The first and important step is selection of seed points inregion growing segmentation.Radio target possibility depends around onthe owner. The important range begins as the nice speech of these seeds.Depending up on the region membership i.e., pixel intensity, gray level texture, color regions are grown from these seed points to adjacent points. Image information is very important because regions are grown on the basis of pixel properties. For example, if the criterion were the pixel intensity threshold value, as one could use histogram of the image to determine the apt threshold value for the region membership.
The important points regarding region growing are
The suitable determination of seed focuses is imperative.
Depending up on the users the seed points are selected. Using the histograms we can select the seed points.
More data of picture is better for investigation
Obviously, adjacent pixel values or information is very useful in determining the threshold value and seed points.
The value, “minimum area threshold”
The value, “Similarity threshold value“
If the difference of pixel value or the average gray level of the set of pixels is less than the similarity threshold value, the regions can be considered as the similar regions.
Advantages
Regions having the same properties can be exactly separated and can be easily analyzed.
Good segmentation results with clear edges of the original image can be obtained using region growing methods. The concept is simple, small number of seed points are
required to represent a region of property of what we want. It performs well with respect to noise.
Disadvantages
We have to select the seed point manually.
Region growing segmentation is applicable only to small images but not for large images.
Results of Region Growing Segmentation
Fig 1.1 is the reference image i.e. the original image. Fig 2.1 represents the initial selection of the seed point. Fig 2.2 represents the threshold image.
Fig2.1.
Fig2.2.
Fig2.3
Fig 2.4.
Fig 2.3 represents the region growing segmented image. Fig 2.4 represents the superimposed image of original image Fig 1.1 and segmented image Fig 2.3. In Fig 2.4, we can observe that only certain region is viewed properly and some of the information about the image is lost. This occurred because only small regions can be
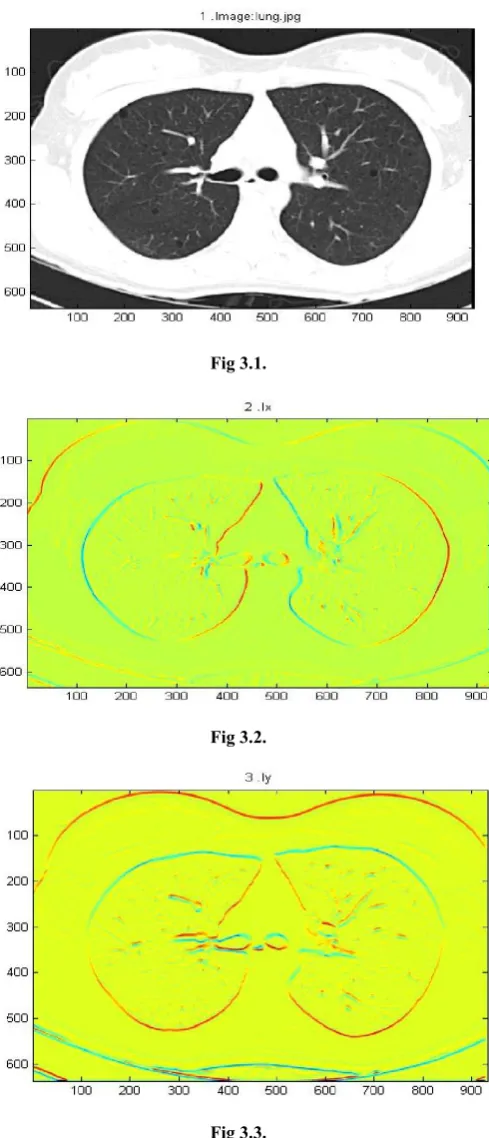
Edge Detection
direction Cy. The intensity gradient of the image is calculated
by using
= + ……… (2)
And direction is determined by
= 2( , ) ………... (3)
The direction angle of the edges is rounded to one of the 4 angles representing horizontal, vertical and the two diagonals.
Fig 3.1.
Fig 3.2.
Fig 3.3.
Fig 3.4.
Fig 3.5.
Fig 3.6.
From the above segmentation, it is clear that we are losing the information of the image since there is a gap between the edges. Hence, we can say that edge detection is not applicable for curved surface propagation.
Level Set algorithm
Intensity inhomogeneity is the main problem in image processing. Image segmentation may be considerably difficult for images with intensity inhomogeneities due to overlapping of the intensity ranges in the regions to segment. Due to intensity inhomogeneity the segmentation techniques like Thresholding, Region Growing algorithm, Edge Detection are not applicable to images. To overcome this we are going to use a segmentation technique called Level Set Segmentation.
Level set method is one of the partial differential equations based methods. Level set method is a numerical method and the main advantage is, it is the parameter free method. In this technique curve propagation is more popular. Initially level set method was used to track the moving interfaces and in various imaging domains. Later, it is efficiently used in the problems corresponding to curves/surfaces. The main idea is to indicate the evolving surface using a signed function, where its zero level resembles to the real surface. Depending upon the motion equation of the surface one can simply develop a related flow for the implied surface will reflect the propagation of the surface when applied to zero level. The present level set methods are categorized into two main classes region based models (
Chan and Vese, 2001;
Li et al., 2008; Ronfard, 1994; Samson et al., 2000; Tsai et al., 2001) and edge based models Caselles et al., 1997; Kichenassamy et al., 1995; Kimmel et al., 1995. The main aim of the region based models is to identify the region of interest by using region descriptor to guide the motion of an active surface. Defining of region descriptor is difficult in images with intensity inhomogeneity. Edge information is used for segmenting the image in edge based models. Homogeneity of image intensities are not assumed in this model and thus can be used for segmentation but this type of method quite sensitive to initial conditions and suffer from serious boundary leakage problems with weak object boundaries in images.As discussed earlier level set method is carried out by numerical implementation. Implementation: Our implementation is straight forward. The level set evolution (4) and (6) are provided in (Chunming, ?) can be implemented by using the same finite difference method as for the DRLSE (Distance regularized Level Set Evolution) provided in (Li et al., 2010). Narrow band implementation of DRLSE (Li et al., 2010). can be used as they reduce the computational complexity and makes the algorithm faster than complete domain operation.
Energy minimization with respect to level set function (∅)
… (4)
Where ∇ is the gradient operator and div (.) is the divergence operator and dp is given by
( ) ≜ ( ( )) ………. (5)
Energy minimization with respect to constants (c): Minimization of energy with respect to ∅ can be performed by solving the following gradient flow equations:
∅
= − ∑ (∅)
∅ + (∅ )
∇∅
|∇∅ | + ((|∇∅ |) ∇∅ ) …… (6)
In numerical execution, a smooth Heaviside function is defined as He and is given by
Hε= 1 + arctan ………. (7)
With ε=1 as . Accordingly the the dirac delta function δ, which is the derivative of Heaviside function H and is replaced by the derivative of Hε , which is solved by
δε = ………. (8)
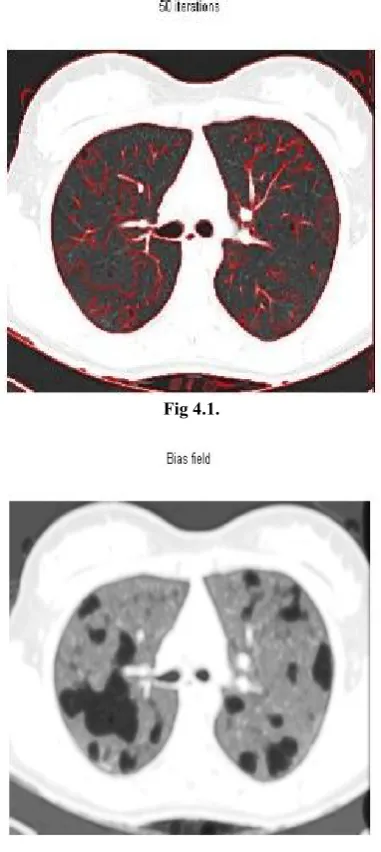
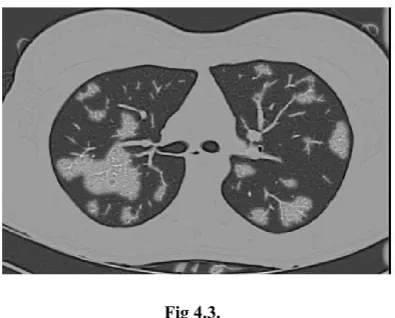
The Results of Level Set segmentation
Fig 4.1.
Fig 4.3.
Fig 4.1 represents the number of iterations taking in the image, Fig 4.2 represents the bias image before correction, and Fig 4.3 represents the bias image after correction. Fig 1.1 is the reference image and from that image we can clearly observe that inner areas in the image are not clearly visible, but after correcting the bias field we are able to see the inner areas which helps the doctor in the diagnosis of disease. This level set method can also be used for multiphase images like spinal cord.
Fig. a
Fig. b
Fig. c
Fig. d
Fig. a represents the original image which has to be enhanced, Fig. b represents the segmented regions of the image, Fig. c represents the bias corrected image which helps the doctor for
easy analysis. Fig. d represents the histograms of the original image and bias corrected image. From the histogram we can
clearly see the bias corrections in the image.
Calculation of Image Quality
PSNR calculates the peak signal to noise ratio in dB between two images. This ratio can be taken as the quality measure between the original image and the reconstructed image. Mean square error and PSNR are the two error metrics used to compare the image compression quality.
MSE is calculated by
=∑ , [ ( , ) ( , )]
∗ ……… (9)
Where M and N are the rows and columns of the images
PSNR is calculated as
Where R is the maximum fluctuation in the input image data type. If R is taken as the 8-bit unsigned integer data type then R=255.All the below PSNR values are regarding the lung image.
Segmentation Technique
PSNR value when compared with the original image
Region Growing 3.8900
Edge Detection 4.0271
Thresholding 5.6244
Level Set 7.3659
By performing all the above techniques we conclude that Level Set algorithm is best suitable for curve propagation surfaces and the images having intensity inhomogeneities. PSNR value gives us the image quality of the reconstructed image.
Acknowledgement
We thank the management of K L University for all the support and encouragement rendered in the project. We also extend our sincere thanks to Vice Chancellor, Registrar and Dean Student Affairs of K L University and Head of the Department, Electronics and Communication Engineering Department K L University for providing the required facilities for carrying out this work.
REFERENCES
Caselles, V., Kimmel, R. and Sapiro, G. Feb. 1997. “Geodesic active contours”, Int. J. Comput. Vis., vol.22, no. 1, pp.61-79.
Chan, T. and Vese, L. Feb.2001. ”Active Contours without Edges”, IEEE Trans. Image. Process., Vol.10 no.2, PP. 266-277.
Chunming Li, Rui Huang, Zhaohua Ding, J. Chris Gatenby, Dimitris N.Metaxas, John C.Gore, “A Level Set Method for
Image segmentation in the Presence of Intensity Inhomogeneties with Application to MRI”, IEEE Trans. Image. Process.
Diao Liming, Zhang Caiming, Gao Shanshan, “A New Algorithm of Automatic Lung parenchyma Segmentation Based on CT image”, IEEE Trans. Image. Process.
Kichenassamy, S., Kumar, A., Olver, P., Tannenbaum, A. and Yezzi, A. 1995. “Gradient flows and Geometric active Contour models”, in proc. 5th Int. Conf. Comput. Vis., PP.810-815.
Kimmel, R., Amir, A. and Bruckstein, A. Jun. 1995. “Finding shortest paths on surfaces using level set propagation”, IEEE Trans. Pattern Anal. Mach. Intell., vol. 17, no. 6, pp. 635-640.
Li, C., Kao, C., Gore, J.C. and Ding, Z. Oct 2008. “Minimization of regional scalable fitting energy for image segmentation”, IEEE Trans. Image Process., Vol. 17, no. 10, pp.1940-1949.
Li, C., Xu, C., Gui, C. and Fox, M. D. Dec. 2010. “Distance regularized level set evolution and its application to image segmentation”, IEEE Trans. Image Process., Vol.19, no. 12, pp. 3243-3254.
Ronfard, R. Oct. 1994. “Region based strategies for active contour models”, Int. J. Comput. Vis., Vol. 13, no. 2, pp. 229-251.
Samson, C., Blanc-Feraud, I., Aubert, G. and Zerubia, J. May 2000. “A varational model for image classification and restoration”, IEEE Trans. Pattern anal. Mach Intell., vol.22, no. 5, pp. 460-472.
Tsai, A., Yezzi, A. and Willsky, A.S. Aug. 2001. ”Curve Evolution Implementation of the Mumford-Shah functional for image segmentation denoising, interpolation and magnification”, IEEE Trans. Image Process., vol.10, no. 8, pp. 1169-1186.