Abstract_The determination of flood discharges that fits to the physical condition of the watershed requires an effort in developing flood discharges estimation model that meets the physical condition of the watershed. The research uses two models in estimating the flood in any watershed. The first model is the development of surface runoff
coefficient model (Cm). The second model is the
development of flood discharges models (Qm) that is
used further as plan flood prediction for each sub watershed.
The research aims to determine the parameter of physical characteristic of the watershed that affects the surface runoff coefficient, to develop the correlation between physical characteristics of the watershed with the surface runoff coefficient, and to determine the plan flood prediction for Bango watershed. The analysis applied in determining the parameter of physical characteristics of the watershed uses geographical information system (GIS), and the development of surface runoff coefficient model by using multiple linear correlation-regression.
The findings show that the mean slope of watershed (Ia), the main river length factor (Lb), topography factor (T), land use factor (Lu), and land type factor (S) influence the surface runoff coefficient. The parameter correlation toward the surface runoff coefficient is linear, while for flood discharges, it is non-linear. Plan flood model can be applied to predict the flood in Bango watershed.
Index Terms: watershed, runoff, physical characteristic, flood discharge
I. INTRODUCTION
The flood control is an effort to reduce the volume of surface runoff so the flood discharges is still kept in the river course and retained in rivers or flood holding areas in the watershed. Flood control can be accomplished with non-structural way by predicting flood and providing the instruction for land usage [4]. The analysis of rainfall-runoff for a watershed can be used to predict flood.
The connection between rainfall and the runoff in a watershed is influenced by the physical characteristics of the watershed [1]. The physical characteristic response of the watershed toward rainfall forming surface runoff is formulated as surface runoff coefficient. The parameter of physical characteristic of the watershed influencing the surface runoff coefficient can be analyzed through parameter of relief, land infiltration, vegetation cover, and surface retention. The analysis for influence and response of the physical characteristic of the watershed can be used to control flood in a watershed.
The shape of watershed is influences the formation of hydrograph characteristic. Long watershed will form lower surface runoff with higher concentration time. Fan shaped watershed produces lower concentration time, so the flow generated is higher [5]. The drainage density can be resulting from the comparison between total length of river in the watershed with the area of the watershed relatively provides indication of watershed response when rain occurs [7].
The scope of this research is illustrates how to implement a geographic information system in data acquisition of physical characteristics of the watershed
THE RAINFALL-RUNOFF MODEL USING OF
THE WATERSHED PHYSICAL
CHARACTERISTIC APPROACH
M. Ruslin Anwar
Civil Engineering Department of Brawijaya University
Malang, Indonesia
and to analysis a multiple linear correlation-regression in modeling of surface runoff coefficient and flood discharges in the watershed.
This study is concerned with the application of the Landsat ETM7 image interpretation and topographic map for data acquisition in Bango watershed. The field infiltration is using a Double Ring Infiltrometer.
The analysis research of rainfall-runoff has two model approaches. The first model is the development of surface runoff coefficient model (Cm). The second model is the development of flood discharges models (Qm) that is used further as plan flood prediction for a watershed.
Bango river is a tributary of Kali Brantas river in its upper course region that plays important role in supplying water to Kali Brantas river for irrigation, drinking water supply, domestic need, electricity generation, industry, water power, and etc in East Java Province. Over the years the provision of water potential in Kali Brantas River is getting worrying. The office of Water Resource Management of Bango River Region stated that some sub watershed in Brantas watershed has undergone withering drought during dry season and flood when the rainfall rate is high. For those reasons, Bango river is chosen as research site along with consideration of having the fact that the watershed is sub watershed of the watershed of upper Kali Brantas functioning as reliable water acquiring region for Brantas watershed. The research aims to determine the parameter of physical characteristic of the watershed that affects the surface runoff coefficient of Bango watershed, to develop the correlation between physical characteristics of the watershed with the surface runoff coefficient of Bango watershed, and to determine the plan flood prediction for Bango watershed
II. PHYSICAL CHARACTERISTIC OF WATERSHED
The hydrology process in a watershed relates to the physical characteristic of the watershed, like morphometry (area, slope, flow pattern density, elevation difference, river span, etc), vegetation cover, land usage and soil (Seyhan, 1977). The watershed shape influences the hydrograph characteristic and can be analyzed with Gravelius Index (KG) by using the following equation [5]:
With KG = Gravelius Index; A = the watershed area
(km2); P = the watershed perimeter (km).
The mean slope of the watershed directly influenced concentration time and the amount of surface runoff. The mean slope of watershed is determined with the following equation [5]:
with ia = the mean slope of watershed (m/km or %); D = the distance between two contour lines (m); L = the total contour line length (km); A = The watershed area (km2)
The drainage density will show the length of surface runoff that can be determined by using the following equation [11]:
D = ∑Ln/A
with D = the value of drainage density (km/km2); Ln = the river length with nth order (km); A = the area of watershed (km2).
The river length of land surface will influence the amount of concentration time in the watershed. The length of overland flow can be determined with the following equation [11]:
Lg = 1/2D = A/2Lb
with Lg = the length of overland flow (km); D = the drainage density (km/km2); A = the area of watershed (km2); Lb= the main river length (km).
The topography factor relate to the time and velocity of streaming in the watershed. The topography factor can be calculated by using the following equation [11]:
T = Lb/(Su)0,5
with T = the value of topography factor;
Lb = the length of main river (km); Su = the mean slope of main river (km/km).
III. RESEARCH METHOD
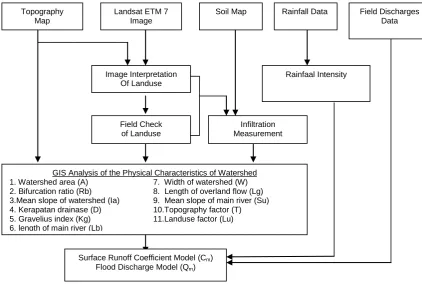
The data used in the research are: 1) Landsat ETM7 image, 2) rainfall data, 3) Topography Map, 4) Land Type Map, and 5) Field Discharges Data. The instruments used are: 1) Double Ring Infiltrometer, 2) Global Positioning System (GPS), 3) AutoCad, ArcInfo, ArcView, and ER Mapper.
IV. RESULT AND DISCUSSION
The Physical Characteristics of Bango Watershed
The parameter of watershed area (A) influences the flood discharge. The bigger the A value is, the bigger the flood discharges will be. Gravelius Index (Kg) provides the indication of flood peak discharges. The smaller the Kg provides the indication of the higher discharges. The sub watersheds of Wendit, Sari, Lahor and Mati have Kg value of < 1.6 indicating that those sub watersheds have lower concentration time, so they produce the higher flood discharges. The mean slope of watershed (Ia) influences the amount of concentration time.
The higher the Ia value is, the faster the concentration time will be. The ration of river tributary (Rb) indicates the level of drainage drying rate of watershed. The low drainage density (D) indicates the longer span of surface runoff. The average rate is relatively low, so it indicates the lower flood peak discharges. The main slope of the main river (Su), the length of the main river (Lb), and the watershed width (W) influence the size of length overland flow (Lg) and topography factor (T). The topography factor influences the watershed surface runoff time and rate.
The smaller the topography factor value is, the faster the flowing in river body will be, so the flood discharges becomes bigger.
The impermeable trait of the land use indicates that the flood discharges is bigger that of the non-impermeable. The Bango watershed is dominated by the farming land use with non-impermeable trait comprising of 9324.302 km2 dry farm field (39.945%), 4659.225 km2 irrigated farm (39.945%), and 104.599 km2 rain-irrigated farm (0.448%). Land type affects the infiltration rate. The map data for land type in Bango watershed shows the dominating land types of Inceptisols (51.108%), Inceptisols and Entisols (26.987%).
Rainfall-Runoff Model Based On The Physical
Characteristic of Bango Watershed
Rainfall-runoff model is stated by using surface runoff coefficient model (Cm) and flood discharges model (Qm). The chosen Cm model based on multiple linear regression-correlation analysis is model with the highest Adjusted R2 and the smallest standard error (0.0261). The most influencing parameter for Cm is the mean slope of watershed (Ia), the main river length (Lb), the topography factor (T), the land type factor (S), and the land use factor (Lu). The Cm and Qm models Figure 1. Flowchart of the research steps
Rainfall Data Field Discharges
Data Soil Map
Landsat ETM 7 Image Topography
Map
Rainfaal Intensity Image Interpretation
Of Landuse
Infiltration Measurement Field Check
of Landuse
GIS Analysis of the Physical Characteristics of Watershed
1. Watershed area (A) 7. Width of watershed (W)
2. Bifurcation ratio (Rb) 8. Length of overland flow (Lg)
3.Mean slope of watershed (Ia) 9. Mean slope of main river (Su)
4. Kerapatan drainase (D) 10.Topography factor (T)
5. Gravelius index (Kg) 11.Landuse factor (Lu)
6. length of main river (Lb)
Surface Runoff Coefficient Model (Cm)
based on the verification test use sample variance test with t test and the result is t = 0.049 at confidence degree of 5% that is smaller than critical t value of 2.119. The following is the detail estimation:
Cm = 0.739 + 0.017 Ia - 3.981 Lb - 1.143 T + 0.009 Lu +
0.014 S
Qm= 2.381 + (0.222 x (0.739 + 0.017 Ia - 3.981 Lb -
1.143 T + 0.009 Lu + 0.014 S) x I x A) with
Cm = model of surface runoff coefficient Ia = mean slope of watershed (%) Lb = main river length (km) T = topography factor (km) S = land type factor (mm/hour) Lu = land use factor (mm/minute) I = rainfall intensity (mm/hour)
A = watershed area (km2)
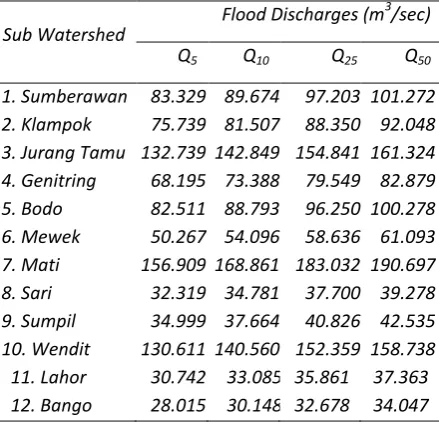
Flood Prediction of Bango Watershed
The plan flood prediction uses Qm model with repeating period of 5, 10, 25, and 50 years and the result shows that sub watersheds of Mati, Jurang Tamu, and Wendit have the bigger flood discharges compared to other sub watersheds (Table 1). Based on the value of watershed physical characteristic, the result shows that Jurang Tamu sub watershed has surface runoff coefficient that is relatively high (0.681), so it produces the highest flood discharges compared to other sub watersheds. Bango sub watershed has the lowest flood discharges compared to other sub watersheds because of watershed physical characteristic factor that gives the smallest surface
runoff coefficient value (0.368).
V. CONCLUSION
The study provides conclusion as follows:
1. The physical characteristics of Bango watershed that influences the surface runoff coefficient are the mean slope watershed, the main river length factor, the topography factor, the land use factor, and the land type factor. It can be seen from the accuracy size value of Adjusted R2 model of 0.929 and Standard Error of 0.03859.
2. The correlation between the mean slope watershed (Ia), the main river length factor (Lb), the topography factor (T), the land use factor (Lu), and the land type factor (S) and surface runoff coefficient (Cm) for Bango watershed is linear with the following equation:
Cm = 0.739+0.017 Ia-3.981 Lb-1.143 T+0.009 Lu+0.014 S
3. The flood prediction for each sub watershed in Bango watershed based on the watershed physical characteristics provides the relatively good result as shown by t value = 0.049 with confidence degree of 5%, meaning that it is smaller that critical t value of 2.119. The result means that two variables, model discharges (Qm) and field discharges (Q1) don’t show real difference, so it can be used as rainfall-runoff analysis method.
The study suggests the following:
1. The researchers who are interested in estimating the flood discharges by the use the physical characteristics of watershed need to consider data completion of rainfall-runoff series at least for 10 years in order to get high accuracy.
2. The researchers who are interested in developing the rainfall-runoff modeling need to try the use of the alternative of acquisition of the remote sensing data with large scale.
3. The researchers who are interested in developing the rainfall-runoff modeling can be done with more complete data in the same area.
VI. REFERENCES
[1] Anwar, M.R., 2002, Estimasi Koefisien Limpasan Berdasarkan Citra Foto Udara Pankromatik Hitam Putih Melalui Pendekatan Karakteristik
Table 1. Flood Discharges of Bango Watershed
Sub Watershed Flood Discharges (m 3
/sec)
Q5 Q10 Q25 Q50
1. Sumberawan 83.329 89.674 97.203 101.272 2. Klampok 75.739 81.507 88.350 92.048 3. Jurang Tamu 132.739 142.849 154.841 161.324 4. Genitring 68.195 73.388 79.549 82.879
5. Bodo 82.511 88.793 96.250 100.278
6. Mewek 50.267 54.096 58.636 61.093
7. Mati 156.909 168.861 183.032 190.697
8. Sari 32.319 34.781 37.700 39.278
9. Sumpil 34.999 37.664 40.826 42.535
Fisik Permukaan Lahan (Studi Kasus di Kotamadya Yogyakarta), Jurnal Teknik, IX (2): 91-89.
[2] Aronoff, S., 1989, Geographic Information System, A Management Perspective, WDL, Publication Ottawa, Canada.
[3] Lin, H.S. et. al., 1999, Effect of Soil Morphology on Hydraulic Properties: I. Quantification of Soil Morphology, Soil Sci. Soc. Am. J., 63:948-954. [4] Mays, L.W. dan Tung, Y.K. , 1992, Hydrosystems
Engineering And Management, McGraw-Hill Inc, New York.
[5] Musy, A., 2001, Watershed Characteristic,
www.civil.pdn.ac.lk/ academic%.. 05/10/2005. [6] Nandakumar, N. dan Mein, R.G., 1997, Uncertainty
in Rainfall-Runoff Model Simulations and the Implications for Predicting the Hydrologic Effects of Land-Use Change, J. Hydrology, 192: 211-232.
[7] Ratnayake, U., 2005, Watershed Characteristics, Engineering hydrology, http//66.102.7.104/
search?q=cache; EuwQ1hgW7f8J;
www.civil.pdn.ac.lk /academic%..20/05/20054. [8] Sample, D.J., Heaney, J. P., Wright, L. T., dan
Koustas, R., 2001, Geographic Information Systems, Decision Support Systems, and Urban Storm-Water Management, J. Water Resources Planning and Management, 127 (3):155-161. [9] Sapirin, I., 2003, Identifiksi Penggunaan lahan
dengan menggunakan Citra Landsat Thematic Mapper, Bulletin Teknik Pertanian, Vol. 8 Nomor 2.
[10] Savenije, H.H.G., 1996, The Ronoff Coeffisient as the Key to Moisture Recycling, J. Hydrology, 176:219-225.