ISSN (e): 2250-3021, ISSN (p): 2278-8719
Vol. 07, Issue 09 (September. 2017), ||V1|| PP 23-31
Application of Multivariate Statistical Methods in Provenance
Analysis in Mabei Area of Junggar Basin
*
Mingrui Chai
1,
Dan Cheng
1,
Yaqi Zuo
2,Yunjun Xue
31 College of Earth Science, Yangtze University, Wuhan, Hubei, China; 2.Eleventh oil production plant, Changqing Oilfield Company, Shaanxi, Xi'an, China
3.China University of Petroleum, Beijing ,China Corresponding Author: Mingrui Chai
Abstract
: In the fully consider into the diagenesis,the authors analyzed the provenance of baikouquan formation in Mabei area of Junggar basin by using the methods of heavy minerals. Heavy minerals Q cluster analysis and factor analysis can judge sedimentary period,divide the scope of the different sedimentary system, determine the type of primary and secondary parent rock.ZTR index and contour map can clearly indicate source direction.The results showed that:there are 3 sedimentary systems in the study area, which are the eastern part, the western part and the north central sedimentary area.Eastern sedimentary area is close to the source,and the source is from the north east of the old mountain. The main source rocks are intermediate acid magmatic rocks and volcanic clastic rock, the second is the sedimentary rock;The Western sedimentary area is far away from the source, and the source is from the north west of the old mountain.The main types of the source rocks are acidic magmatic rocks and volcanic clastic rocks,the second is the sedimentary rock;The north central sedimentary area is close to the source, and the source is from the old mountain area in the north.The main source rocks are the neutral magmatic and volcanic clastic rocks, and the second is the sedimentary rock.Kaywords
: Mabei area; Baikouquan formation; provenance; mineral; multivariate statistics--- Date of Submission: 08-08-2017 Date of acceptance: 08-09-2017 ---
I.
INTRODUCE
The Junggar Basin is one of the large oil and gas basins in the northwest of China. The Mahu depression is an important oil and gas producing area of Xinjiang Oilfield Company.The study area is the northwestern margin of the north slope of Mahu depression area, referred to as Mabei area, research horizon for Triassic Baikouquan formation. The lithologic reservoirs are distributed in a group and controlled by facies belts.It is concluded that the Baikouquan Formation belongs to fan delta sedimentary facies, but the study is not deep enough, and the distribution range of sedimentary facies is not clear. The source analysis is the basis for the study of sedimentary facies and sand body distribution. In order to effectively predict the location of lithologic oil and gas reservoirs in this area, provenance analysis has become a top priority.There are many methods for provenance analysis. Because heavy minerals are very sensitive indicators of source change, heavy mineral assemblages can be used to reveal the nature and source of parent rocks[1-3]. Therefore, they are widely used in provenance analysis;the methods of cluster analysis, factor analysis and other statistical methods can reveal the correlation between samples or variables, identify mixed source characteristics, and have been widely used in the analysis of heavy minerals[4-8]. A large number of previous studies have been made on the use of the heavy mineral data in this area.It is mainly used to determine the composition type of heavy mineral components with high content and to divide the sedimentary system, stability coefficient is used to determine the content source direction, the study of sedimentary system in this area has played a certain guiding significance[9-11].But did not take into account the impact of multiple sources of material supply, diagenesis on the distribution of heavy minerals, the deposition system is relatively rough, mixed source characteristics are not identified.Therefore, using the rich heavy mineral data, the author makes a systematic analysis and discussion on the distribution of the source and the distribution system in the area by means of cluster analysis and factor analysis, and taking full account of the influence of diagenesis, so as to provide guidance for oil and gas exploration in the area.
II.
REGIONAL GEOLOGICAL BACKGROUND
divided into:Baikouquan formation (T1b) and Karamay group (T2k), Baijiantan group (T3b), the Baikouquan
formation purpose layer (TIb) from the first paragraph can be divided into T1b1, T1b2 andTIb3, T1b2 period as the
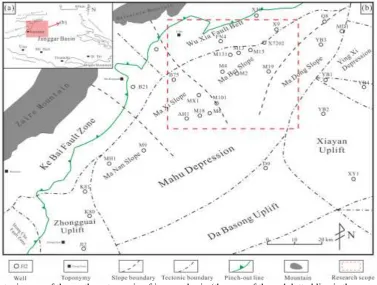
main oil layer.The reservoirs of the Baikouquan Formation are mainly composed of sand and gravel, and the sedimentary background is shallow fan delta deposition in the background of gentle slope. The fan delta plain subfacies and fan delta front subfacies are developed. The front part of each fan is prone to intersecting, Fan range and boundary is not easy to identify.And the north slope of area mainly developed Xiazijie fan delta system, Marcy slope area mainly developed Huangyangquan fan delta system, in order to explore the Xiazijie fan delta distribution and two fan intersection boundary, the study area including Mabei slope area and adjacent parts of Marcy slope.And because the second paragraph is the main oil-bearing section, heavy mineral information is rich, selected as the study horizon.
Fig. 1 Tectonic map of the northwest margin of junggar basin (the area of the red dotted line is the research area)
III.
PRINCIPLES AND METHODS
Clustering analysis is an effective way to study the problem of "Like attracts like", which can automatically classify samples or variables according to their intimacy in nature without prior knowledge. According to the purpose of the study and the object, the cluster analysis is divided into Q type and R type. Q-type clustering analysis is to study the relationship between the samples, R-type cluster analysis is to study the relationship between variables。Factor analysis can integrate variables with complicated relations into a few independent factors, thus using a few factors instead of the original variables to simplify the analysis[13]。
In the analysis of heavy minerals,the predecessors have done a lot of research on these methods[4-6, 8,
14-18], and the specific ideas are as follows: The sediments formed during geological history are often mixed by
distinction between primary and secondary parent rock.Therefore, cluster analysis and factor analysis have some advantages in studying the sedimentary system with complex parent rocks and mixed source characteristics.
The idea of this study is as follows.Firstly, Q-type cluster analysis of heavy mineral data at different depths of single well was carried out, and the sample groups with the same or similar vertical characteristics were separated as the sediment from the same period. Each sample group represented the same period of sediment supply.Q type clustering analysis takes the square of Euclidean distance, that is, the sum of the squares of the difference of each variable of each sample. The formula is:
EUCLID= 2 k 1 ) (
i i i y x(1)
Of these, K means that there are k variables in each sample; Xi represents the value of the first sample on the i-th variable; Yi represents the value of the second sample on the i-th variable;The clustering method uses an intergroup connection, that is, the distance between two small classes is the average distance between all the samples in two small classes. On this basis, the heavy mineral data of each well in the whole area are analyzed by Q cluster method, and the development range of each sedimentary system is delineated.Generally, the stability factor or ZTR index is used to determine the source direction, but heavy minerals in the study area are greatly affected by diagenesis, zircon, tourmaline and rutile are the most stable in heavy minerals, which are least affected by diagenesis and are almost common in all crystal rocks. Therefore, the ZTR index is used to determine the source direction.Finally, the factor analysis of the heavy mineral data of each depositional system was carried out, and the type of rock was determined by combining the rock type of each source area .In the factor analysis, the principal factor extraction method selects the principal component analysis method and carries out the maximum variance rotation.
IV.
HEAVY MINERAL CHARACTERISTICS
The data of 30 Wells and 142 samples were collected in the second section of the study area. The rich data provided the basis for the multivariate statistical analysis. There were 24 kinds of heavy minerals found in the study area, among which the main heavy minerals were epidote (47.13%), titaniumite (11.09%), ilmenite (10.95%) and limonite (10.29%) with an average content of more than 10%. Secondary heavy minerals are magnetite (7.09%), zircon (3.92%), pyrite (3.82%), barite (1.45%), garnet (1.41%), tourmaline (1.04%), with an average content of 1% to 10%. A small amount of heavy mineral is spinel (0.91%), brookite (0.30%), anhydrite (0.21%), augite (0.19%), zoisite (0.17%). Its average content is less than 1%.
V.
SOURCE ANALYSIS
4.1 Cluster analysis
4.1.1 Analysis of multi - period source supply
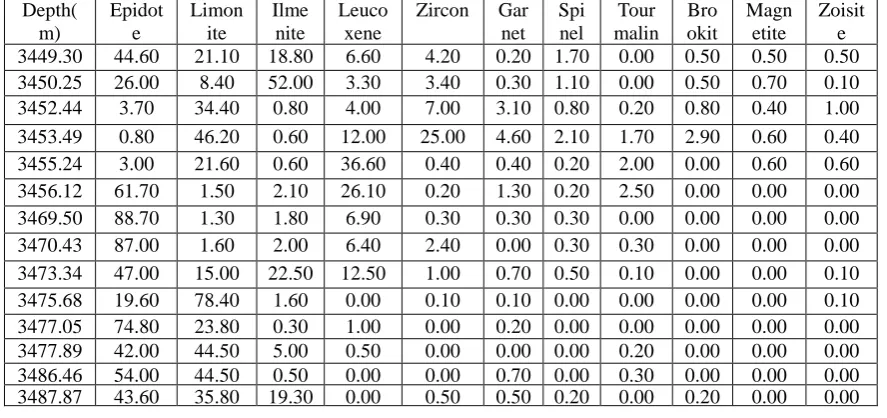
First, the Q-type cluster analysis method is used to separate the sample groups with different characteristics in the vertical direction from the sediments from different periods. Each sample group represents the supply of sediments in a certain period or a certain parent rock type. This method is used to analyze the data of different depth and heavy minerals in single well, and the M001 well is used as an example. There are 15 heavy mineral analysis samples in the second section of the M001 Wells. The heavy minerals mainly include: vermiculite, Limonite, ilmenite, white titanium, Zircon, garnet, Spinel, Tourmaline, titanium Ore, Magnetite, zoisite (Table 1).
Table 1 M001 well heavy mineral content table(%). Depth( m) Epidot e Limon ite Ilme nite Leuco xene
The Q-cluster analysis of these 15 samples was carried out, and the Q-type cluster analysis spectrum of M001 wells was obtained (Fig. 2). When the class spacing is 11, all the samples are vertically clustered into one category, that is, these samples have the same or similar heavy mineral combination characteristics, indicating that M001 wells have experienced a period of deposition process. The above methods were used to analyze the well bits of M003, M006, M9 and other heavy minerals with more than 10 samples were analyzed. The results showed that the second stage of the study area experienced a sedimentary supply process.
Fig. 2 Q-type clustering spectra of heavy minerals in M001 well.
4.1.2 Depositional system division
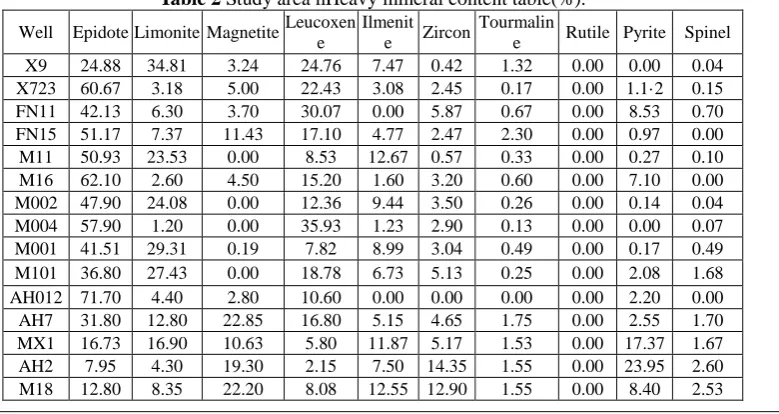
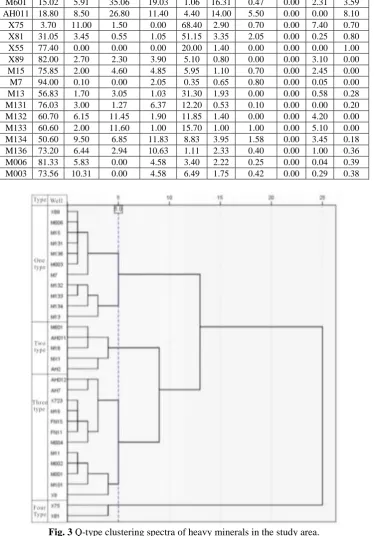
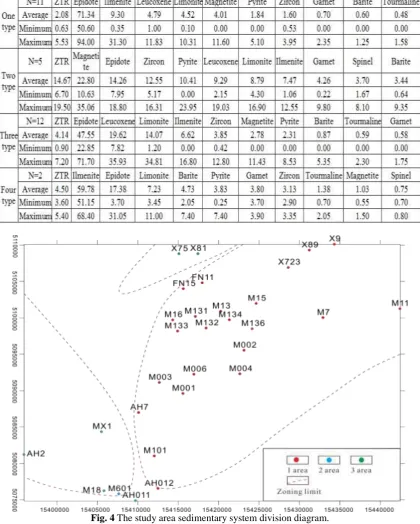
Different sedimentary systems show different combinations of heavy minerals because of different parent rock types, so that the development range of each sedimentary system can be delineated according to the results of Q-type cluster analysis. Since the Baihua Quaternary section is mainly subjected to a process of sediment supply, the heavy mineral data for each well is averaged (Table 2), which makes it more accurate to reflect the heavy mineral content of single well. And then Q-type clustering analysis of all well heavy mineral data, Q-type clustering analysis spectrum (Fig. 3).
Table 2 Study area hHeavy mineral content table(%).
Well Epidote Limonite Magnetite Leucoxen e
Ilmenit
e Zircon
Tourmalin
e Rutile Pyrite Spinel X9 24.88 34.81 3.24 24.76 7.47 0.42 1.32 0.00 0.00 0.04 X723 60.67 3.18 5.00 22.43 3.08 2.45 0.17 0.00 1.1·2 0.15 FN11 42.13 6.30 3.70 30.07 0.00 5.87 0.67 0.00 8.53 0.70 FN15 51.17 7.37 11.43 17.10 4.77 2.47 2.30 0.00 0.97 0.00 M11 50.93 23.53 0.00 8.53 12.67 0.57 0.33 0.00 0.27 0.10 M16 62.10 2.60 4.50 15.20 1.60 3.20 0.60 0.00 7.10 0.00 M002 47.90 24.08 0.00 12.36 9.44 3.50 0.26 0.00 0.14 0.04 M004 57.90 1.20 0.00 35.93 1.23 2.90 0.13 0.00 0.00 0.07 M001 41.51 29.31 0.19 7.82 8.99 3.04 0.49 0.00 0.17 0.49 M101 36.80 27.43 0.00 18.78 6.73 5.13 0.25 0.00 2.08 1.68 AH012 71.70 4.40 2.80 10.60 0.00 0.00 0.00 0.00 2.20 0.00 AH7 31.80 12.80 22.85 16.80 5.15 4.65 1.75 0.00 2.55 1.70 MX1 16.73 16.90 10.63 5.80 11.87 5.17 1.53 0.00 17.37 1.67 AH2 7.95 4.30 19.30 2.15 7.50 14.35 1.55 0.00 23.95 2.60 M18 12.80 8.35 22.20 8.08 12.55 12.90 1.55 0.00 8.40 2.53
M601 15.02 5.91 35.06 19.03 1.06 16.31 0.47 0.00 2.31 3.59 AH011 18.80 8.50 26.80 11.40 4.40 14.00 5.50 0.00 0.00 8.10 X75 3.70 11.00 1.50 0.00 68.40 2.90 0.70 0.00 7.40 0.70 X81 31.05 3.45 0.55 1.05 51.15 3.35 2.05 0.00 0.25 0.80 X55 77.40 0.00 0.00 0.00 20.00 1.40 0.00 0.00 0.00 1.00 X89 82.00 2.70 2.30 3.90 5.10 0.80 0.00 0.00 3.10 0.00 M15 75.85 2.00 4.60 4.85 5.95 1.10 0.70 0.00 2.45 0.00 M7 94.00 0.10 0.00 2.05 0.35 0.65 0.80 0.00 0.05 0.00 M13 56.83 1.70 3.05 1.03 31.30 1.93 0.00 0.00 0.58 0.28 M131 76.03 3.00 1.27 6.37 12.20 0.53 0.10 0.00 0.00 0.20 M132 60.70 6.15 11.45 1.90 11.85 1.40 0.00 0.00 4.20 0.00 M133 60.60 2.00 11.60 1.00 15.70 1.00 1.00 0.00 5.10 0.00 M134 50.60 9.50 6.85 11.83 8.83 3.95 1.58 0.00 3.45 0.18 M136 73.20 6.44 2.94 10.63 1.11 2.33 0.40 0.00 1.00 0.36 M006 81.33 5.83 0.00 4.58 3.40 2.22 0.25 0.00 0.04 0.39 M003 73.56 10.31 0.00 4.58 6.49 1.75 0.42 0.00 0.29 0.38
Fig. 3 Q-type clustering spectra of heavy minerals in the study area.
Table 3 Content of heavy minerals in each category(%).
Fig. 4 The study area sedimentary system division diagram.
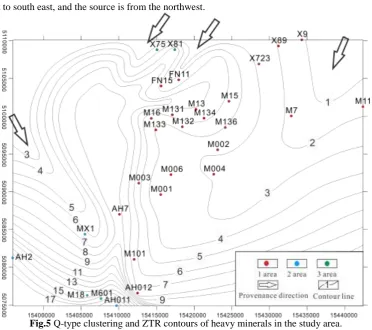
4.2 The source direction judgment
northwest to south east, and the source is from the northwest.
Fig.5 Q-type clustering and ZTR contours of heavy minerals in the study area.
4.3 Factor analysis - defining the parent rock type
The heavy mineral samples in 3 sedimentary areas were analyzed by factor analysis to determine the combined characteristics of heavy minerals, and then to determine the types of parent rocks and their primary and secondary sources. The sample wells in the first district are mainly distributed in the eastern part of the study area. In the factor analysis, three common factors, F1, F2 and F3, are extracted according to the principle of eigenvalue greater than 1, and their cumulative contribution rate is 84.147% (Table 4), which can reflect the basic information of the original data. As can be seen from the table, factor F1 and F3 provide a contribution rate of 60.134% of the total contribution rate, indicating that factor F1 and F3 control are the major sources. The heavy mineral assemblage characteristics of ilmenite + magnetite + pyrite + leucoxene, tourmaline + epidote + limonite, manifested as magmatite rock types,combined with the rock type of the source area, magmatic rocks include mid-acid magmatic rocks and volcanic clastic rocks; The factor F2 provides a smaller contribution rate of 24.013%, indicating that the factor F2 controls the secondary source. From the higher factor load values it can be seen that the heavy mineral assemblage represented by the factor F2 is characterized by limonite + zircon + garnet, expressed as sedimentary rocks of the parent rock type.
Table 4 Total variance and factor loading matrix explained by one area sample. Total variance explained Rotational component matrix
Element Initial
eigenvalue Variance/%
Accumulate/
% variable
10 -4.65E-16 -4.65E-15 100 Limonite -0.556 0.301 0.713
The sample wells in the second area are mainly distributed in the western part of the study area. According to the above method, four common factors, F1, F2, F3 and F4, are extracted in the spatial factor analysis, and their cumulative contribution rate is 99.1% (Table 5), which represents most of the original data. The contribution rate of factor F2, F3 and F4 accounted for 61.91% of the total contribution rate,indicating that the factors F2, F3 and F4 control the main source. The heavy mineral assemblage is characterized by limonite + borage + magnetite, zircon + garnet, barite + ilmenite, which is characterized by the type of rock of magmatic rocks, combined with the rock type of the source region, it is believed that magmatic rocks include acid magmatic rocks and volcanic clastic rocks. The heavy mineral assemblage characteristic of F1 is characterized by white titanium + pyrite + tourmaline, belonging to the parent rock type of sedimentary rock, the contribution rate is 38.09%, which means that factor F1 controls the secondary source.
Table 5 Total variance and factor loading matrix explained by two area sample. Total variance explained Rotational component matrix
Element Initial eigenvalue
Variance /%
Accumulate/
% Variable
Element
1 2 3 4 1 3.809 38.09 38.09 Leucoxene 0.969 0.214 0.114 0.045 2 3.5 35.002 73.092 Pyrite -0.954 0.099 0.278 0.057 3 1.443 14.433 87.525 Tourmaline 0.775 0.227 -0.107 -0.579 4 1.248 12.475 100 Limonite -0.091 -0.99 0.029 -0.106 5 1.72E-15 1.72E-14 100 Epidote 0.136 -0.881 -0.333 -0.309 6 5.69E-16 5.69E-15 100 Magnetite 0.561 0.821 -0.093 0.045 7 3.73E-16 3.73E-15 100 Zircon -0.067 0.081 -0.967 -0.232 8 2.50E-16 2.50E-15 100 Garnet -0.504 0.307 0.805 -0.068 9 1.40E-16 1.40E-15 100 Barite -0.018 0.453 -0.075 0.888 10 -3.88E-16 -3.88E-15 100 Ilmenite -0.074 0.087 0.528 0.842
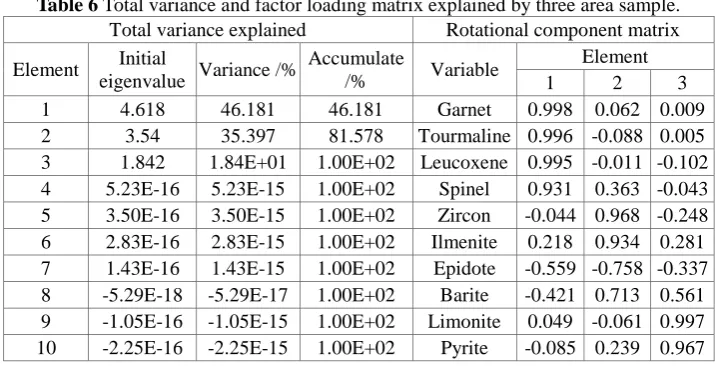
The third sample wells are mainly distributed in the north of the study area. According to the above principle, three common factors, F1, F2 and F3, are extracted in the spatial factor analysis, and their cumulative contribution rate is 100% (Table 6), which can represent all the original information. The contribution rate of factor F1 and F2 accounted for 81.58% of the total contribution rate, indicating that factor F1 and F2 control are the main sources. The heavy mineral assemblage is characterized by garnet + tourmaline + titaniumite + spinel, zircon + ilmenite + boulder + barite, which is represented by the parent rock type of magmatic rock. Combined with the rock type of the source region, the magmatic rocks are considered to include neutral magmatic rocks and volcanic clastic rocks. The factor F3 provides a small contribution rate of 18.42%, indicating that the factor F3 controls the secondary source. From the higher factor load value it can be seen that the heavy mineral assemblage represented by the factor F3 is characterized by limonite + pyrite, belonging to the type of parent rock of sedimentary rocks.
Table 6 Total variance and factor loading matrix explained by three area sample. Total variance explained Rotational component matrix
Element Initial
eigenvalue Variance /%
Accumulate
/% Variable
VI.
CONCLUSION
1) There are 3 major depositional systems in the study area, they are the eastern sedimentary area, the Western sedimentary area and the north central sedimentary area.
2) The eastern sedimentary area is the product of near source deposits, and the provenance comes from the old mountain area in the east of the north. The mother rock types are mainly magmatic rocks, including intermediate acid magmatic rocks and pyroclastic rocks, and then sedimentary rocks; The Western sedimentary area is the product of distant source deposits, and the provenance comes from the old mountain area in the west of the north. The mother rock types are mainly magmatic rocks, including acid magmatic rocks and pyroclastic rocks, and then sedimentary rocks; the northern sedimentary area is the product of near source deposits, and the provenance is from the old mountain areas in the north. The mother rock types are mainly magmatic rocks, including neutral magmatic rocks and pyroclastic rocks, and then sedimentary rocks.
3)The study found that two sedimentary system mainly exists in Mabei area,namely, the first area which the combination of heavy mineral assemblages are the erglass - ilmenite - titanite - limonite and the third area which heavy mineral assemblages are ilmenite - iron ore - barite .The M101 wells in the field are the boundaries of the Xia Zijia fan delta and the Huangyangquan fan delta, and this study found that the Xia Zijia fan delta crossed the M101 well and extended to the AH012 well, possibly extending further and hoping to arouse future attention.
REFERENCE
[1]. Morton A C, Hallsworth C R. Processes controlling the composition of heavy mineral assemblages in sandstones[J]. Sedimentary Geology, 1999,124(1–4):3-29.
[2]. Morton A C, Hallsworth C. Identifying provenance-specific features of detrital heavy mineral assemblages in sandstones[J]. Sedimentary Geology, 1994,90(3-4):241-256.
[3]. Pettijohn F J, Potter P E, Siever R. Sand and Sandstone[M]. Springer New York, 1987.
[4]. Cao Yingchang, Song Ling, Wang Jian, Li Junliang, Liu Mingquan, Wan Yong. .Application of Heavy Mineral Data in the Analysis of Sediment Source:A case study in the Paleogene lower submember of the third member of the Liushagang Formation, Weixinan Depression[J]. Acta Sedimentologica Stntca, 2011(05):835-841.
[5]. Xu Tianwu, Song Haiqiang, Kuang Wu, Wang Yingmin, Chen Liqiong, Qi Lixin. Synthetic Application of the Provenance Analysis Technique:A Case study of Member 1 of Taizhou Formation in Gaovou Sag, Subei Basin[J]. Acta Geoscientica Sinica, 2009(01):111-118.
[6]. Wang Kunshan, Shi Xuefa, Lin Zhenhong. Assemblages, Provinces and Provenances of Heavy Minerals on the Shelf of the Southern Yellow Sea and Northern East China Sea[J]. Advances in Marine Science, 2003(01):31-40.
[7]. Wu Fadong, Lu Yongchao, Ruan Xiaoyan,. Application of Heavy Minerals Cluster Analysis to Study of Clastic Sources and Stratigraphic correlation[J]. Geoscience, 1996(03):106-112.
[8]. Yu Ye, Zhang Changmin, Li Shaohua. Application of multivariate statistic analysis in geology: A case of provenance analysis in the M Strata,Huizhou Depression[J]. Chinese Journal of Geology(Scientia Geologica Sinica), 2014,49(1):191-201.
[9]. Zhou Zhiwen, Li Hui, Xu Yang. Sedimentary Characteristics of the Baikouquan Formation Lower Triassic in the Mahu Depression,Junggar Basin[J]. Geological Science and Technology Information, 2015(02):20-26.
[10].Tang Yong, Xu Yang, Qu Jianhua. Fan-Delta Group Characteristics and Its Distribution of the Triassic Baikouquan Reservoirs in Mahu Sag of Junggar Basin[J]. Xinjiang Petroleum Geology, 2014(06):628-635.
[11].Meng Xiangchao, Chen Nenggui, Wang Haiming. Sedimentary Characteristics Facies:A case study of Glutenite and Its Favourable Accumulation from T1b, Mabei Slope, Junggar Basin[J]. Acta Sedimentologica Sinica, 2015(06):1235-1246.
[12].Wang Xueren. Multivariate Statistical Analysis of Geological Data[M]. Science Press, 1982.
[13].Lin Hong, Li Fengjie, Li Lei. Characteristics of Paleogene Heavy Mineral and Its Source in Northern Margin of Qaidam Basin[J]. Natural Gas Geoscience, 2014(04):532-541.
[14].Liu Zhongcheng. Detrital mineralogy and its environmental indicative significance of the sediments of Coastal zone in Liaodong Bay[D]. Ludong University , 2014.
[15].Ma Feng, Liu Li, Yan Hua. Application of the Statistical Analysis in Researching the Type of Motherrock in the West Strata of Songliao Basin[J]. Geoscience, 2003,22(4):331-338.
[16].Liu Qunming, Chen Kaiyuan, Wang Jian. The Provenance Analysis of the Quaternary Heavy Minerals in Sanhu Depression, Qaidam Basin[J]. Geoscience, 2011(02):315-321.
[17].He Miao. Dissertation Submitted to Chinese Academy of Geological Sciences For Doctoral Degree[D]. Chinese Academy of Geologecal Sciences, 2015.
[18].Isaac M J. Mesozoic geology of the Matawai district, Raukumara Peninsula[J]. Researchspace, 1977.
[19].Li Yun, Hu Zuowei, He Jing, Yuan Xiaoqi, Deng Xiuqin. Diagenesis of heavy minerals in the Upper Triassic Yanchang Formation of Ordos Basin[J]. Journal of Palaeogeography(Chinese Edition), 2015(01):119-128.