Abstract-- Static and dynamic effects to power transmission towers structures can be evaluated by methodologies available in codes, which suggest the use of linear static analysis. By using numerical simulations, it is possible to observe the strong influence of the geometric nonlinear behavior of transmission cables. The dynamic effects also have strong influence, with the possibility of resonance between the cables and the structure, but up to the moment, the existent analysis procedures have not been completely validated on experimental basis. In order to validate a complete methodology of analysis, experimental procedures are proposed for a suspension tower of a 138kV transmission line in use. A tridimensional anemometer was installed on this structure in order to measure the values and directions of wind speeds. Simultaneous strain values will be collected on the main elements of the tower through optical extensometers. Optical sensor technology with Fiber Bragg Gratings will be used, due to the characteristic of immunity to the electromagnetic field occasioned by high electric currents. The strings swing angle will be evaluated through a high-resolution camera and a tridimensional accelerometer. With this instrumentation, it is possible to create a complete database that correlates wind speeds with the responses of the structural set.
Index Term-- Monitoring of Transmission Lines, Optical Sensors, Fiber Bragg Grating.
I. INTRODUCTION
CONCERNS relating to loadings resulting from the wind actions on overhead transmission lines components have been growing in Brazil in recent years, as in other countries, since the breakdown of these structures may result in losses of greater importance in a power supply system [1]. The newspaper "The State of São Paulo" reported that on November 4, 1997, winds up to 36 m/s caused the collapse of 10 transmission towers in the Itaipu plant. This case is just one example, since from the beginning of the construction of lattice metal towers, there have been several similar records due to strong winds. This suggests that in the absence of another phenomenon, the wind loading can be severe enough to cause the collapse of overhead lines towers [2,3].
Current calculation methodologies suggested by the transmission towers standards indicate the use of linear analysis with static loadings equivalent to wind effects [4]. Effects of non-geometric linearity obtained by nonlinear analysis of the entire structural set (tower, insulators and cables), were considered relevant for long span cables structural systems [5]. Dynamic analysis indicated efforts up to three times higher than those obtained by means of
equivalent static analysis, indicating that the occurrence of accidents caused by the wind may be intensified if the towers analysis are conducted using inappropriate models [6]. Many theoretical studies have been developed, but only a few experimental validations have been performed [7,8,9].
With this motivation, this article aims to present an experimental project developed by CEMIG (Companhia Energética de Minas Gerais), in partnership with the Federal University of Minas Gerais (UFMG) in a 28 meters height suspension transmission tower, component of 138 kV air phase line / phase. With the monitoring system in operation, it becomes possible to obtain simultaneous recordings of the insulators strings balance, wind speed and deflections on the support structure in real situations. These data will allow the validation of analytical methods, since they contain information relating to the actions and their structural responses.
For obtaining experimental information it has been used the real-time monitoring technology, adapted for measuring the balance of insulators strings and other quantities [10]. The monitoring system is composed of the following subsystems:
- Power set (solar panels and batteries);
- Electrical sensing elements (humidity, temperature, solar radiation, wind speed, swing angle);
- Electrical data logger;
- Optical sensor elements (structure temperature and strain);
- Optical data logger (OSA - OPTICAL SPECTRUM ANALYZER);
- Digital camera;
- Communication system;
- Fasteners.
II. EXPERIMENTAL METHODOLOGY
A. Monitoring System Structure
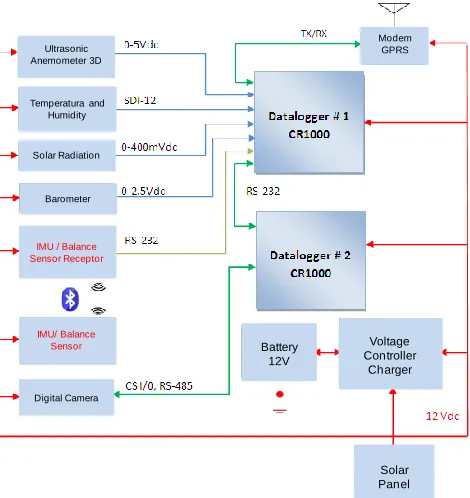
The structure under study will be monitored, as well as all the information relating to wind actions and their structural responses. There is a wind gauge and a measurement system for obtaining the actions and the swing angle of the insulators strings, which consists of an acquisition system and data communication, an inertial platform, climatological sensors, image and document camera feeding system. The simplified diagram in Figure 1 shows the integrated balance sensor with the other components of the system.
Experimental Program to Evaluate the Behavior
of Power Transmission Lines Systems Subject
to Wind
Fig. 1.Balance Monitoring System Structure.
The camera data system, the inertial platform and transmission components of the angle measuring system are in a metal housing. The inertial platform is attached to the insulators strings. For setting the camera, an auxiliary structure has been built in order to move it away from the tower structure along the transmission cables, enabling the capturing of the insulators strings transverse movement. A set of batteries, solar panels and a charge controller have been used for feeding the system.
Figure 2 shows the lab setup and Figure 3 shows the sensors clamping arrangement and other equipment in the tower metal structure.
The strings displacement is captured by the camera from a given wind speed value or a stipulated swing angle value. A logical pulse data logger triggers the camera, initiating a sequence of photos. The remote acquisition of information from the measuring system and the recording of the swing angle, installed in the field, are performed by means of a modern GPRS. A remote access may be done through a computer equipped with a modem.
The structural responses are captured through strain sensors installed in the main structural elements in the tower at a frequency of 1 Hz. As the electrical strain sensor is very sensitive to the influence of external electromagnetic fields, caused by the high current of the electrical cables, it was used optical strain gages, with Bragg Grating, immune to electrical interference [11].
Fig. 2.Experimental setup in the lab: (a) digital camera; (b) temperature and humidity sensor; (c) solar radiation sensor; (d) wind speed sensor; (e) swing angle sensor along the insulators strings; (f) electrical data logger.
Fig. 3. Setting of the monitoring system in the tower: (A) swing angle sensor; (B) digital camera; (C) solar panel; (D) box with data logger, battery
and modem; (E) Solar radiation sensor, temperature sensor, 3D wind speed sensor and atmospheric pressure sensor.
As the tower structure was built with equal-sided angles, two strain sensors have been used on each structural element object of analysis. Local effects on the equal-sided angles were evaluated in the lab and are negligible. Figure 4 shows the tower instrumented elements as well as their respective arrangements in the structure as a whole.
Fig. 4. Location of the sensors within the tower elements.
The influence of bending in the equal-sided angles structure will be eliminated with the use of two strain sensors on each part, with a sensor on each tab, on the neutral axis.
Due to the high sensitivity of optical strain gages to the temperature variation, an optical temperature sensor will be
Ultrasonic Anemometer 3D
Temperatura and Humidity
Solar Radiation
Barometer
IMU / Balance Sensor Receptor
IMU/ Balance Sensor
Digital Camera
Voltage Controller
Charger Battery
12V
Solar Panel
Modem GPRS
(f)
0.00m +0.50m
0.00m
-0.50m
SECTION "A-A" optical strain gages
installed next to each pair of strain gages. The measured strain values, in this case, total deflections, may be broken down into two parts, one corresponding to the steel and optical fiber cables temperature range and the other deflections due to the load as set forth in (1) [12].
(1)
Where:
= strain variation measured in the structural element;
= strain variation due to load variation in the structural element;
= strain variation due to temperature variation on the structural element;
= wavelength variation reflected on the optical fiber; = Bragg grating sensitivity to strain, equal to -0.22; = Bragg grating wavelength reflected on the optical fiber; TCS = Bragg grating sensitivity crossed to the temperature equal to 8.59 με / ° C;
∆T = temperature variation.
B. Balance Sensor Development
The angle measurement system is composed of an inertial platform called IMU (Inertial Measurement Unit). Through the combination of three-dimensional sensors (accelerometers, magnetometers and gyroscopes), the inertial IMU allows determining the state of any system to which it is attached. Inertial platforms are commonly used in aircraft navigation systems, satellites, cars, etc [10].
On the balance sensor prototype, it was used the IMU Spark Fun Electronics, model IMU 6-DOFv3, which uses three integrated circuits CI-IDG-300, containing two independent vibrating gyroscopes. The IMU consists of two electronic circuits that communicate via RF signal (Bluetooth). The first, shown in Figure 5a, contains sensors (accelerometer, magnetometer and gyroscope) and an RF transmitter. The second unit, shown in Figure 5b, is the receiver circuit, which connects to a data logger via serial interface to collect information. The inertial platform data are values from a 10 bit AD converter and eight data channels for measurements of acceleration data (x, y, z), turning rate (x, y, z) and magnetometer data (x , y). The IMU sampling frequency was 10 Hz, enough to avoid aliasing (inaccurate results due to low data acquisition rate) for measuring the balance of an insulators string.
Fig. 5. Inertial Platform Spark Fun Electronics: (a) transmitter circuit with sensors and (b) receiver circuit.
Figure 6 shows the angles , θ and ψ in relation to the inertial platform coordinate axes, which are attached to the insulators strings referred to, respectively, Pitch, Roll and Yaw. To obtain the insulators strings tilt angles, to which it is assumed a rigid body behavior, you must only know the and θ angles, as they are the strings degrees of freedom. The swing angle θ is orthogonal to the driver position; the angle has value different from zero when there is a longitudinal displacement of the insulators strings, situation corresponding to the breakdown of the driver cable or unbalanced horizontal stresses of adjacent cables.
Fig. 6. Inertial Platform and measured quantities.
C. Field Installing
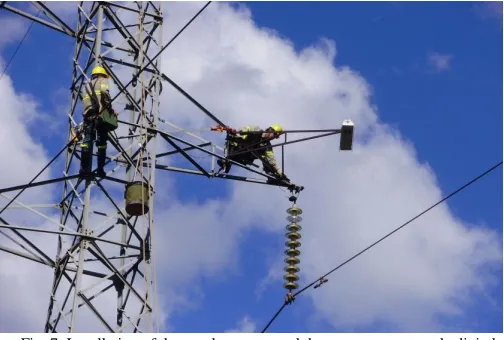
A suspension structure of a 138 kV transmission line has been chosen for the installation of the measuring and monitoring system for the structural behavior of the system consisting of a tower and cables subjected to the wind action. On the same tower, a meteorological station has been installed at 10m height, allowing us to monitor both the wind direction and speed, solar radiation and other weather data. Figure 7 show the installation of the angle measurement sensor, the digital recording system (camera) and the climatological station.
Fig. 7. Installation of the accelerometer and the measurement angle digital recording system.
Fig. 8. Optical sensor installed in the structural element and the system power set.
III. OUTCOME
For 2 months, wind speed values were collected in the structure under study. With average values at 3 seconds (gust values) and hourly average. Figure 9 shows the values obtained.
Fig. 9. Wind speeds averaging 3 seconds and hourly average.
Figure 10 and 11 shows the histogram of the collected speeds during 2 month measuring.
Fig. 10.Wind speeds averaging 3 seconds.
Fig. 11. Wind speeds hourly average.
Figure 9 shows that considerable wind speeds were registered, with values between 12 and 18????m/s. The
maximum design speed for the region where the experimental schedule is allocated, considering a 50 year recurrence time, is 32 m/s. For a 2 year recurrence time, the design speed decreases to 16 m/s, which is fully consistent with the data, since the period in which they occurred were months of high wind incidences.
Figure 12 shows the strain and temperature values collected by optical sensors, with temperature influence only on the strain. The strain variation observed in sensors 2 and 3 are related to the temperature variation in sensor 1 and strain in sensors 5 and 6 to the temperature sensor 4.
Fig. 12. Strain and temperature values collected at each second, with temperature influence on the strain.
Figure 12 shows high levels of axial strain due to temperature variations between day and night. Therefore, it is essential to control the deformations due to the temperature, in order to get correct values of stress due to wind loading.
Figure 13 shows strain and temperature values listed by optical sensors with temperature influence and wind loads during strain. The variation observed in the strain sensors 2 and 3 are relative to the temperature variation in sensor 1 and the strain in sensors 5 and 6 to the temperature sensor 4.
Fig. 13. Strain and temperature values collected at each second, with temperature and wind loads influence on the strain.
IV. OUTCOME
This work presented a measuring and monitoring system for the structural behavior of the system consisting of a tower and cables subjected to the wind action, based on real-time monitoring system of transmission lines. It has been presented wind speed, strain and temperature values obtained by sensors installed on the structure. The proposed development of this system is very important for the improvement and validation of a complete methodology (static and dynamic theoretical and experimental) for the analysis of overhead power lines towers. It is expected, therefore, to evaluate and refine the line projects criteria. 0 2 4 6 8 10 12 14 16 18
31/05/2013 10/06/2013 20/06/2013 30/06/2013 10/07/2013 20/07/2013 30/07/2013
Wi n d S p ee d ( m /s ) Date
Average speed in 1 hour Wind gust speed in 3s
0.0% 10.0% 20.0% 30.0% 40.0% 50.0% 60.0% 70.0% 80.0% 90.0% 100.0%
1 6 11 16
Hourly average wind speed [m/s]
frequency for speed ra nge
cumula tive frequency
0.0% 10.0% 20.0% 30.0% 40.0% 50.0% 60.0% 70.0% 80.0% 90.0% 100.0%
1 6 11 16
Wind speed averaging 3 seconds (gust) [m/s]
frequency for speed ra nge
cumula tive frequency
-300 -250 -200 -150 -100 -50 0
8/11/14 17:02 8/11/14 19:26 8/11/14 21:50 9/11/14 0:14
S tr a in [ με ] / Te m p e r a tu r e [º C ]
Date / Hour
Sensor 1 - Temperature Sensor 2 - Strain Sensor 3 - Strain Sensor 4 - Temperature Sensor 5 - Strain Sensor 6 - Strain
-400 -350 -300 -250 -200 -150 -100 -50 0 50
10/11/14 4:48 10/11/14 6:00 10/11/14 7:12 10/11/14 8:24 10/11/14 9:36 10/11/14 10:48
S tr a in [ με ] / Te m p e r a tu r e [º C ]
Date / Hour
It was possible to evaluate and validate, through lab tests, the use of commercial optical sensors on the analysis of strain in structural steel elements, which had adopted its use.
By the moment, the instrumentation is in the final testing phase and synchronization. After this step, real-time measurements will be performed, using all the instruments installed on the structure.
REFERENCES AND FOOTNOTES
A. References
[1] J. Blessmann, “O Vento na Engenharia Estrutura,” 2005, 1st ed, Porto Alegre: Ed. Universidade/ UFRGS. 282p.
[2] F. Yang; J. Yang; H. Niu, H. Zhang. Design wind loads for tubular-angle steel cross-arms of transmission towers under skewed wind loading. Journal of Wind Engineering and Industrial
Aerodynamics, v. 140, p. 10-18, 2015.
[3] D. Wang; K. Li; S. Liang. Wind tunnel tests on aeroelastic dynamic tension effects of overhead transmission. International Conference on
Wind Engineering, Porto Alegre, 2015.
[4] J. D, Holmes. “Wind loading of structures,” 2015, 3rd ed., Florida: CRC Press. 384p.
[5] H. Carvalho. Efeitos do vento em linhas de transmissão. Belo Horizonte: Universidade Federal de Minas Gerais, 2015. 146f. (Ph.D. Thesis in Structural Engineering).
[6] R.C. Battista, M.S. Pfeil., R.S. Rodrigues. Dynamic behavior and stability of transmission line towers under wind forces. Journal of Wind
Engineering and Industrial Aerodynamics, v. 91, p. 1051-1067, 2003.
[7] L. Bjerkan. Application of fiber-optic Bragg grating sensors in monitoring environmental loads of overhead power transmission lines. Aplied Optics, v. 39, Issue 4, p. 554-560, 2000.
[8] J. Henriques; F. Paiva; R. Barros. Wind action in the tower testing station. International Conference on Wind Engineering, Porto Alegre, 2015.
[9] A.D. John; A. Gairola, E. Ganju; A. Gupta. Design wind loads on reinforced concrete chimney – An experimental case study. Procedia
Engineering, v. 14, p. 1252-1257, 2011.
[10] R. Molina; M.F. Guimarães; C.A.M. Nascimento; G.A.C. França; G.A.A. Moreira. Cálculo e medição do ângulo de balanço de cadeias de isoladores de linhas de transmissão. Revista Iberoamericana de
Ingenieria Mecanica, n. 1, v.18, p.145-159, 2014.
[11] K.O. Hill.; G. Meltz. Fiber Bragg Grating technology fundamentals and overview. Journal of Lightwave Technology, v. 15, n. 8, 1997. [12] F. Pavel; F. Koji; K. Friedrich; R. Jan. Tower top geometry and mid
span clearances. Paris: CigreWorking Group B2, 2007. 187p.
[13] D.C.A. Pereira. Sensores de fibra óptica baseados em redes de Bragg para monitorização ambiental e estrutural. Porto: Universidade do Porto, 2003. 210f. (Ph.D. Thesis in Electrical Engineering).
[14] K. Schroeder; W. Ecke; J. Apitz; E. Lembke; G. Lenschow. A fiber Bragg grating sensor system monitors operational load in a wind turbine rotor blade. Measurement Science and Technology, v.17, n.15, 2006. [15] K. Tian; Y. Lui.; Q. Wang. Temperature-independent fiber Bragg
grating strain sensor using bimetal cantilever. Optical Fiber Technology, v. 11, Issue 4, p. 370–377, 2005.
Hermes Carvalho was born in Belo Horizonte, Brazil, in 1984. He received the B.S. degree in mechanical engineering from Federal University of Minas Gerais, Brazil, in 2007, the M.S. degree in mechanical engineering from the same university, in 2010. Ph.D. degree in structural engineering at Federal University of Minas Gerais, in 2015. Consultant Engineer in Structural Engineering, currently serving as engineering manager at RMG Engenharia.
Gilson Queiroz is mechanical enginner – Federal University of Minas Gerais (1967); Master Degree in Structural Engineering - Federal University of Minas Gerais (1992); Doctorate in Metallurgical Engineering - Federal University of Minas Gerais (1995). Associated Professor of the Structural Engineering Department - Federal University of Minas Gerais (retired in march 2015). Consultant Engineer in Structural Engineering, mainly in the fields of Steel Structures, Composite Structures and Structural Mechanics. 40 years of experience in design and execution of several types of civil and mechanical structures; 35 years of experience in teaching and research related to Structural Engineering.