International Journal of Pharmaceutical Sciences and Drug Research 2013; 5(1): 18-22
18
Research Article
ISSN 0975-248X
Determination of Morphine in Human Urine by A Simple Reverse Phase
High-Performance Liquid Chromatography Method with UV Detection
A. B. Ruzilawati
*, W. N. Wan Yusuf, N. Ramli, Z. Hussain, A. H. G. Rasool
Department of Pharmacology, School of Medical Sciences, Universiti Sains Malaysia, Kelantan, Malaysia
ABSTRACT
A simple reverse-phase high-performance liquid chromatographic method has been developed for the determination of morphine in human urine using codeine as internal standard. After solid-phase extraction (SPE), the compounds were separated on a reversed-phase Acentis Express C18 column (150mm × 4.6mm, 2.7µm) equipped with a guard column (2.7 µm, 5 mm × 4.6 mm). The channel on the UV detector was configured to acquire data at 285 nm. The mobile phase was composed of acetonitrile-sodium acetate (pH 4; 0.01M) (10:90, v/v). The flow rate was 0.6 ml/min. Injection volume was 30 ml. The run time was set at 10 min. The retention time for morphine and codeine were approximately 3.4 min and 7.2 min, respectively. The calibration curve was linear over the concentration range of 150-2000 ng/ml with good linearity. Limit of detection (LOD) and quantification (LOQ) in urine were 50 and 150 ng/ml, respectively. Recovery was greater than 85%. The inter-day precision was from 9.27% to 12.53% and the intra-day precision ranged from 1.63% to 4.58%. The inter-day accuracy ranged 81.45% to 109.88% and intra-day accuracy ranged from 81.56% to 106.69%. The stability studies showed that morphine was stable up to one month in urine. This method was applied to determine morphine concentration in human urine for toxicology analysis.
Keywords:Morphine, HPLC, urine, method development, validation.
INTRODUCTION
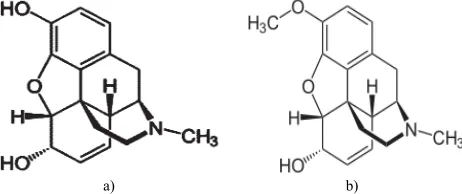
Morphine is a potent opiate analgesic psychoactive drug (Fig. 1). It is a potent opiod analgesic. In clinical medicine, morphine is regarded as the gold standard of analgesics.[1]It
is used for the short-term treatment of post-surgery pain and in the long term for the pain relief of cancer patient. [2] Morphine is also a potentially highly addictive substance. It can cause psychological dependence and physical dependence as well as tolerance.[3]
Therefore, the extensive use of morphine as analgesics as well as the widespread abuse of this drug required the development of simple, fast and reliable methods for the detection of these drugs in biological samples.
Many methods have been developed for determination of morphine in biological fluid. These include methods based on high-performance liquid chromatography mass spectrometry (HPLC-MS) [4], high-performance liquid
chromatography tandem mass spectrometry (HPLC-MS/MS)
[5-6], ultra-high-pressure liquid chromatography-tandem mass
spectrometry (UPLC-MS-MS) [7]and gas chromatography
*Corresponding author: Dr. Ruzilawati Abu Bakar,
Department of Pharmacology, School of Medical Sciences, Universiti Sains Malaysia, Kelantan, Malaysia 16150, Kubang Kerian, Kota Bharu, Kelantan, Malaysia;Tel.: 609-7676128;Fax:609-7653370;E-mail: [email protected]
mass spectrometry (GCMS). [8-9] However, reversed-phase
high-performance liquid chromatography (RP-HPLC) with a UV detector is frequently used for the analysis of morphine since gas chromatography mass spectrometry (GCMS) remains the “gold standard” for drug of abuse confirmation screening in biological fluids. [10]We choose HPLC with a UV detector for our study since this type of detector is cheaper compared to other chromatography and available in our laboratory.
a) b)
Fig. 1: Chemical structures of a) morphine and b) codeine (internal standard)
In a study by Szkutnik-Fiedler et al. [11], HPLC-UV was used
to identify morphine. However, the authors determined morphine in plasma instead of urine. In another method developed by Ferrara et al. [12], HPLC separation of morphine
end-capped C18 was chosen as the stationary phase’s column. The stability of bonded-phase packings is especially important in running an HPLC.[13] Furthermore, long chain
alkyl-bonded-phase packing like C18 is generally more stable compared to other stationary phase’s column.[14]
The objective of this study was to develop, optimize and validate a simple, fast and reliable HPLC method with ultra-violet detection for determination and quantification of morphine in human urine using codeine as internal standard (Fig. 1).
MATERIALS AND METHODS Chemicals and reagents
Morphine sulfate and the internal standard, codeine were purchased from Cerilliant Corporation, USA. All chemicals used in this experiment were of analytical purity grade and were purchased from Merck (Darmstadt, Germany). The solid-phase extraction apparatus consisted of a solid phase cartridge Bond-Eluent Certify (130 mg) (Xcel-CSXCE) attached to a vacuum system Welch Vacuum (IL, USA).
Spectrophotometry analysis
The UV absorbance for morphine and internal standard, codeine were measured using a Waters 2996 PDA Detector (Waters, Milford, MA, USA) (Fig. 2).
Chromatographic conditions
The HPLC system was Waters 2695 Separation Module (Waters, Milford, MA, USA consisting of a pump, degasser, autosampler, thermostat operating at 37C. Waters Empower software was used for data acquisition and processing, running on a Samsung PC. A reversed-phase Acentis Express C18column (150mm × 4.6mm, 2.7µm) equipped with a guard
column (2.7 µm, 5 mm × 4.6 mm) was used. The channel on the UV detector was configured to acquire data at 285 nm. The mobile phase was composed of acetonitrile-sodium acetate (pH 4; 0.01M) (10:90, v/v). The flow rate was 0.6 ml/min. Injection volume was 30l. Experiments were performed at ambient temperature. The run time was set at 10 min.
Extraction procedure Urine Hydrolysis
A 2.0 ml urine sample was centrifuged for 5 min at 2000 rpm. Urine sample was added with 500 ng/ml codeine, as internal standard and 400µl concentrated HCl.
After mixing, 200µl of 10% hydroxylamine solution in water was added to the samples. The samples were then mixed on a vortex mixer for 2 min and then the tubes were heated to 90oC for 40 min in a heating block. The samples were
allowed to cool to the room temperature. Five hundred microliters of 50% ammonium hydroxide was added. The pH was verified at 5.5-6.5. The sample was extracted by solid phase extraction method.
Solid Phase Extraction
The manual solid phase extraction technique was similar to the method recommended by the manufacturer. Solid phase extraction was performed with Bond-Eluent Certify (50 mg) cartridges. Each column was conditioned by washing with 2.0 ml of methanol, 2 ml of deionized water and 2 ml of the 0.1 M potassium phosphate buffer (pH 6.0) at flow rate of 3 ml/min. After application of the samples at 1 ml/min, the columns were then washed with 2 ml of 0.1 M potassium acetate buffer (pH 4.5) and 2 ml of methanol. The columns were dried thoroughly under vacuum for a minimum of 3 minutes. Morphine was eluted with 2 ml of freshly prepared
elution solution consist of ethyl acetate, isopropyl alcohol, dichloromethane (18:12:4 v/v/v). The combined eluent was evaporated to dryness under a stream of nitrogen at 40oC and
the residue was dissolved in mobile phase. Twenty µl samples were injected onto the HPLC column.
Validation procedures
Urine calibration curves were prepared and assayed in duplicate on three different days to observe linearity, precision, accuracy, recovery, limit of quantitation (LOQ), limit of detection (LOD), selectivity and stability. The area ratio of chromatographic peaks of morphine to codeine was used in the quantification.
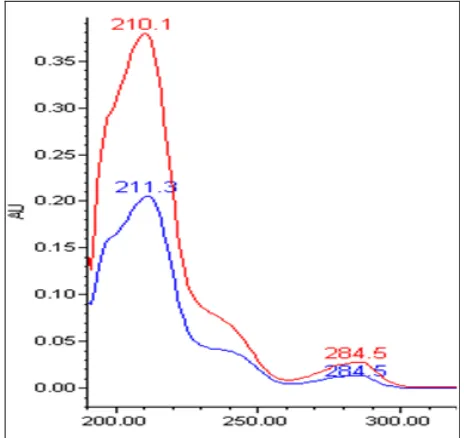
Fig. 2: UV spectra of morphine (210.1 and 284.5 nm) and the internal standard, codeine (211.3 and 284.5 nm) obtained using a photodiode array (PDA) detector.
RESULTS AND DISCUSSION
The quantitative HPLC coupled with a UV detector method was validated based on the guideline provided by the FDA.
[15]Our approach was to perform the analysis accurately, but
in a short time, using freshly collected urine.
Analysis of the spectrophotometry of morphine showed that the maximum absorption of morphine in mobile phase was seen at two peaks 210.1 nm and 284.5 nm. For codeine, maximum absorptions were seen at 211.3 nm and 284.5 nm. Therefore, the UV absorbance of 284.5 nm was used throughout the study.
Extractions of drugs from biological fluids are usually the most difficult step in any analysis due to the presence of interferences which need to be removed without causing significant analyte loss.[16] For the extraction of morphine,
solid phase extraction method (SPE) [17] , were most popular
methods. Chee & Wan [18] used capillary zone electrophoresis method for morphine extraction. Mixed-phase extraction columns can also be used for extraction of the morphine from biological fluid. [19]
In this study, we used SPE technique since this technique has many benefits such as quick sample processing and reduced analyst exposure to organic solvents as well as avoidance of emulsion creation and the production of cleaner extracts.[20]
a)
b)
c)
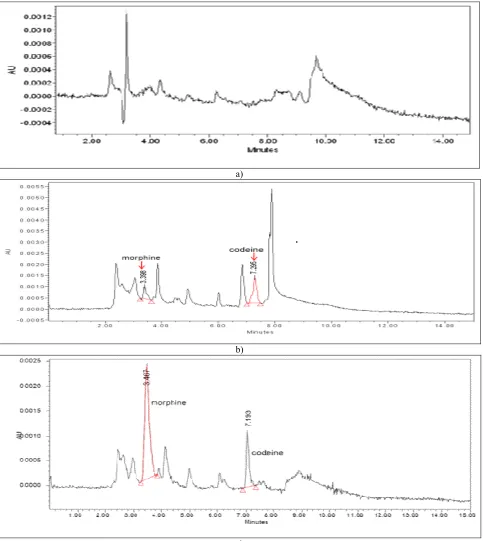
Fig. 3: Chromatograms showing (a) drug-free urine (b)urine spiked with morphine (2000 ng/ml) and codein (500 ng/ml) and (c) patient’s urine sample with positive morphine
Prior to extraction, urine hydrolysis is required to obtain unconjugated morphine, as morphine is excreted in urine as its 3- and 6-glucuronides. In this study we used concentratred HCl in acid hydrolysis procedure. A study done by Wang et al. [22]have shown that, acid hydrolysis liberated > 90% of
morphine from their glucuronide standards. However, Jennison et al. [23]found both beta-glucuronidase enzyme and
acid hydrolysis techniques to be efficient and producible which gave 90.4% and 92.8% conversion of M-3G to morphine, respectively.
Fig. 3 shows the typical chromatograms obtained from drug-free urine, urine spiked with morphine and codeine and patient’s urine sample with positive morphine, respectively. Morphine peaks were clearly separated from the internal standard, codeine with the retention times of 3.4 min and 7.2 min, respectively. There were no interference peaks seen in the chromatogram of blank urine.
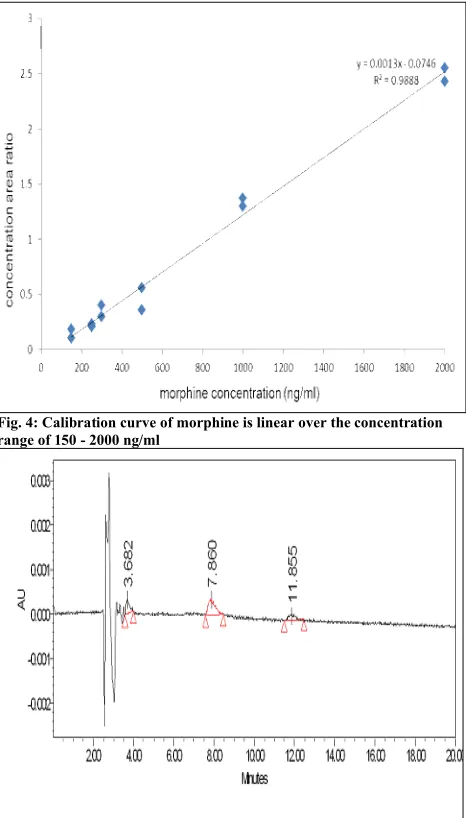
ng/ml in human urine. Fig. 4 shows a typical calibration curve of concentration area ratio of morphine to codeine versus morphine concentration. The linear regression method was used in order to calculate slope, intercept and correlation coefficient of the calibration curve. The equation was y = 0.0013x – 0.0746 with a high correlation coefficient (r2 =
0.9888). The result showed the acceptable level of sensitivity and quantification of morphine that was higher than the cut off value of 300 ng/ml.
Fig. 4: Calibration curve of morphine is linear over the concentration range of 150 - 2000 ng/ml
Fig. 5: Chromatograms of morphine (2000 ng/ml) (3.682 min), codeine (500 ng/ml) (7.860 min) and amphetamine (200 ng/ml) (11.855 min)
The inter-day precision and accuracy was determined for morphine by analysis the samples at each level of calibration in duplicates and was analyzed on three different days. The intra-day precision and accuracy was determined for each the samples at each level of calibration in duplicates on one day. The results of the precision and accuracy determined of the method intra- and inter-days are shown in Table 1.
The intra- and inter-day precision in this study was expressed as % of coefficient of variation (CV). Precision is the measure of how close the data are to each other for a number of measurements under the same conditions. According to Center for Drug Evaluation Research [15], the precision
determined at each concentration should not exceed 15% of CV except for LOQ. LOQ, however should not exceed 20% of the CV. At all of the concentrations tested, the intra- and interday CV’s were less than 15% as recommended by CDER [15]. There was a tendency for the CV to become larger
as the concentration decreases. This could be due to higher error rate when pipetting smaller concentrations. Errors could also occur during the extraction process.
Accuracy of an analytical method is the measure of how close the mean test results obtained by the method to the true value (concentration) of the analyte. [16] Accuracy was
calculated as percentage difference between the concentration of drug measured with calibration curve and the concentration of drug added to the blank urine. Overall the accuracy for the assay was more than 81% for morphine. Thus, based on the established criteria, the method is both precise and accurate (as per the FDA guideline) in measuring morphine’s concentrations at the concentration range of interest.
Table 1: Precision and accuracy of the method for the determination of morphine in human urine
Morphine Intraday (Within batch) (n=3) Concentration
(ng/ml) (ng/ml)Mean SD Precision (CV) Accuracy (%)
200 219.84 10.06 4.58 109.92
400 326.26 14.92 4.57 81.56
1500 1600.37 26.11 1.63 106.69
Morphine Interday (Between batch) (n=9) Concentration
(ng/ml) (ng/ml)Mean SD Precision (CV) Accuracy (%)
200 162.90 20.42 12.53 81.45
400 337.15 31.27 9.27 84.28
1500 1648.34 183.92 11.15 109.88
Table 2: Recoveries of samples injected in duplicate
Morphine concentration (ng/ml) % Recovery (mean ± SD)
150 85.79
250 109.52
300 103.02
500 96.34
1000 99.38
20000 89.77
Table 3: Stability study of morphine Quality control
sample Morphine 200 ng/ml(low concentration) Morphine 2000 ng/ml(high concentration) a) Five hour thaw
Replicate 1 171.00 1515.11
Replicate 2 152.70 1543.23
Mean 161.85 1529.17
SD 12.94 19.89
CV 7.99 19.89
b) One week stability
Replicate 1 157.84 1398.56
Replicate 2 140.95 1424.52
Mean 149.39 1411.54
SD 11.94 1.31
CV 7.99
c) One month stability
Replicate 1 192.87 798.87
Replicate 2 164.70 824.96
Mean 178.78 811.92
SD 19.91 18.45
CV 11.14 2.27
but the extent of recovery of an analyte and of the internal standard should be consistent, precise and reproducible. [15]
According to Meyer [24], both the area and height of a peak
are proportional to the amount of a compound injected. In this experiment, the recoveries of morphine were quantified using area ratio method. The result was satisfactory as it found to be above 85%.
Limit of detection (LOD) is the lowest concentration of the analyte in a sample that can be detected but not necessarily quantitated, under the stated experimental condition. [15]
Limit of quantification (LOQ) is defined as the lowest plasma concentration in the calibration curve that can be measured routinely with good precision (RSD<20%) and accuracy (80-120%). In this study, the LOD in this method was 50 ng/ml while the LOQ was 150 ng/ml.
No interference peaks were observed from drugs commonly used by the subjects. Fig. 5 shows the chromatogram of amphetamine and the peaks of interest. There were also no interfering peaks observed in the blank plasma or the peaks corresponding to the retention times of 6.2 min and 5.4 min (retention times of morphine and codeine) respectively. It is therefore concluded that this method is selective for the drugs used.
Short and long term stability studies were carried out according to CDER’s guideline. [15] Two concentrations of
morphine in urine were prepared in duplicates at low (200 ng/ml) and high concentrations (2000 ng/ml). Each one ml of urine was spiked with methanol and placed in 10 ml plastic tubes and kept frozen at –20°C until analysis. For short-term stability tests, five hours thaw was studied. For long-term stability tests, one week and one month storage were studied. According to CDER [15], stability procedures should evaluate
the stability of the analytes during sample collection and handling, after long term (frozen at the intended storage temperature) and short term used during actual sample handling and analysis. Our stability results confirmed that morphine was stable in urine under the storage conditions.
A simple, fast and reliable reversed-phase HPLC method with ultra-violet detection for the determination of morphine in human urine has been optimized and validated. This method is proven to be a useful method for analyzing the urine of suspected abusers of morphine.
ACKNOWLEDGEMENT
This study was financially supported by Universiti Sains Malaysia short term grant (304/PPSP/61310053).
REFERENCES
1. Wiffen PJ, Edwards JE, Barden J, McQuay HJ. Oral morphine for cancer pain. Cochrane Database of Systematic Rev. 2003; (4):CD003868.
2. World Health Organization. Cancer Pain Relief Program. Geneva: 1986.
3. Moeller MR, Mueller C. The detection of 6-monoacetylmorphine in urine, serum and hair by GUMS and RIA. Forensic Sc Int 1995; 70: 125-33.
4. Galloway JH, Ashford M, Marsh ID, Holden M, Forrest ARW. A method for the confirmation and identification of drugs of misuse in urine using solid phase extraction and gas-liquid chromatography with mass spectrometry. J Clin Pathol 1998; 51:326-29
5. Manfio JL, Santos VJ, Lanchote VL, Santos LM, Carmona MJ, Auler JO, Brum LJ, Donaduzzi CM, Santos SR. Development and validation of an HPLC/MS/MS method for the determination of sufentanil and morphine in human plasma. J AOAC Int 2011; 94(1):136-42.
6. Hofmann U, Seefried S, Schweizer E, Ebner T, Mikus G, Eichelbaum M. Highly sensitive gas chromatographic-tandem mass spectrometric method for the determination of morphine and codeine in serum and urine in the femtomolar range. J Chromatogr B Biomed Sci Appl 1999; 727(1-2):81-88.
7. Ruiz-Colón K, Martínez MA, Silva-Torres LA, Chavez-Arias C, Meléndez-Negrón M, Conte-Miller MS, Bloom-Oquendo J. Simultaneous determination of xylazine, free morphine, codeine, 6-acetylmorphine, cocaine and benzoylecgonine in postmortem blood by UPLC-MS-MS. J Anal Toxicol 2012; 36(5):319-26.
8. van der Slooten EP, van der Helm HJ. Comparison of the EMIT (enzyme multiplied immunoassay technique) opiate assay and a gas-chromatographic--mass-spectrometric determination of morphine and codeine in urine. Clin Chem 1976; 22(7):1110-11. 9. Wasels R, Belleville F. Gas chromatographic-mass spectrometric
procedures used for the identification and determination of morphine, codeine and 6-monoacetylmorphine. J Chromatogr A 1994; 674(1-2): 225-34.
10. Schönberg L, Grobosch T, Lampe D, Kloft C. New screening method for basic compounds in urine by on-line extraction–high-performance liquid chromatography with photodiode-array detection. J Chrom A 2006; 1134 (1–2): 177–85.
11. Szkutnik-Fiedler D, Grześkowiak E, Gaca M, Borowicz M. HPLC-UV determination of morphine in human plasma and its application to the clinical study. Acta Pol Pharm 2011; 68(4):473-79.
12. Ferrara SD, Tedeschi L, Frison G, Castagna F. Solid-Phase Extraction and HPLC-UV Confirmation of Drugs of Abuse in Urine. J Anal Toxicol 1992; 16 (4): 217-22.
13. Colin H, Guiochon G. Introduction to reversed-phase high-performance liquid chromatography. J Chrom 1977; 141: 289-312. 14. Snyder LR, Glajch JL, Kirkland JJ. Practical HPLC method
development. New York: John Wiley & Sons; 1988.
15. CDER. Guidance for industry: bioanalytical method validation, Centre for Drug Evaluation and Research, Food and Drug Administration; 2001. p 1-11.
16. Ruzilawati AB, Suhaimi AW, Imran A, Ismail Z, Gan SH. Method development and validation of repaglinide in human plasma by HPLC and its application to pharmacokinetics study. J Pharm Biomed Anal 2007; 43(5): 1831-35.
17. Larry AB, Lance CP, Mike T, Cecelia Q. Improved Gas Chromatography–Mass Spectrometry Method for Simultaneous Identification and Quantification of Opiates in Urine as Propionyl and Oxime Derivatives. Clin Chem 2001; 47 (1): 127 – 29. 18. Chee GL, Wan TS. Reproducible and high-speed separation of
basic drugs by capillary zone electrophoresis. J Chromatogr 1993; 612(1):172-77.
19. Bogusz MJ, Maier RD, Schiwy-Bochat KH, Kohls U. Applicability of various brands of mixed-phase extraction columns for opiate extraction from blood and serum. J Chromatogr B Biomed Appl 1996; 683(2):177-88.
20. de Zeeuw RA. Drug screening in biological fluids: the need for a systemic approach. J Chrom B 1997; 689: 71-79.
21. Bakkali A, Corta E, Ciria JI, Berrueta LA, Gallo B, Vicente F. Solid-phase extraction with liquid chromatography and ultraviolet detection for the assay of antidepressant drugs in human plasma. Talanta 1999; 49(4):773-783.
22. Wang P, Stone JA, Chen KH, Gross SF, Haller CA, Wu AH. Incomplete recovery of prescription opioids in urine using enzymatic hydrolysis of glucuronide metabolites. J Anal Toxicol 2006; 30(8):570-75.
23. Jennison TA, Wozniak E, Nelson G, Urry FM. The quantitative conversion of morphine 3-beta-D glucuronide to morphine using beta-glucuronidase obtained from Patella vulgataas compared to acid hydrolysis. J Anal Toxicol 1993; 17(4):208-10.