www.atmos-meas-tech.net/9/5441/2016/ doi:10.5194/amt-9-5441-2016
© Author(s) 2016. CC Attribution 3.0 License.
The new Passive microwave Neural network Precipitation Retrieval
(PNPR) algorithm for the cross-track scanning ATMS radiometer:
description and verification study over Europe and Africa
using GPM and TRMM spaceborne radars
Paolo Sanò1, Giulia Panegrossi1, Daniele Casella1, Anna C. Marra1, Francesco Di Paola2, and Stefano Dietrich1
1Institute of Atmospheric Sciences and Climate (ISAC), National Research Council of Italy (CNR), 00133 Rome, Italy 2Institute of Methodologies for Environmental Analysis (IMAA), Italian National Research Council of Italy (CNR),
C.da S.Loja, Tito Scalo, 85050 Potenza, Italy
Correspondence to:Paolo Sanò ([email protected])
Received: 9 June 2016 – Published in Atmos. Meas. Tech. Discuss.: 13 June 2016
Revised: 22 September 2016 – Accepted: 3 October 2016 – Published: 14 November 2016
Abstract.The objective of this paper is to describe the devel-opment and evaluate the performance of a completely new version of the Passive microwave Neural network Precipi-tation Retrieval (PNPR v2), an algorithm based on a neural network approach, designed to retrieve the instantaneous sur-face precipitation rate using the cross-track Advanced Tech-nology Microwave Sounder (ATMS) radiometer measure-ments. This algorithm, developed within the EUMETSAT H-SAF program, represents an evolution of the previous ver-sion (PNPR v1), developed for AMSU/MHS radiometers (and used and distributed operationally within H-SAF), with improvements aimed at exploiting the new precipitation-sensing capabilities of ATMS with respect to AMSU/MHS. In the design of the neural network the new ATMS channels compared to AMSU/MHS, and their combinations, includ-ing the brightness temperature differences in the water vapor absorption band, around 183 GHz, are considered. The algo-rithm is based on a single neural network, for all types of surface background, trained using a large database based on 94 cloud-resolving model simulations over the European and the African areas.
The performance of PNPR v2 has been evaluated through an intercomparison of the instantaneous precipitation esti-mates with co-located estiesti-mates from the TRMM Precipita-tion Radar (TRMM-PR) and from the GPM Core Observa-tory Ku-band Precipitation Radar (GPM-KuPR). In the com-parison with TRMM-PR, over the African area the statisti-cal analysis was carried out for a 2-year (2013–2014) dataset
of coincident observations over a regular grid at 0.5◦×0.5◦ resolution. The results have shown a good agreement be-tween PNPR v2 and TRMM-PR for the different surface types. The correlation coefficient (CC) was equal to 0.69 over ocean and 0.71 over vegetated land (lower values were ob-tained over arid land and coast), and the root mean squared error (RMSE) was equal to 1.30 mm h−1 over ocean and 1.11 mm h−1over vegetated land. The results showed a slight
1 Introduction
The availability of data from the Advanced Technology Mi-crowave Sounder (ATMS), a cross-track scanning radiome-ter currently onboard the Suomi National Polar-orbiting Part-nership (Suomi-NPP) satellite (and on the Joint Polar Satel-lite System (JPSS) series starting in 2017), represents an important step in short- and long-term weather forecasting and environmental monitoring. Combining the capabilities of its predecessor sounders such as the Advanced Microwave Sounding Unit-A (AMSU-A) and the Microwave Humid-ity Sounder (MHS) aboard NOAA-18 and NOAA-19 and the ESA MetOp-A and MetOp-B satellites, ATMS provides sounding observations with improved resolution, sampling, and coverage for retrieving atmospheric vertical temperature and humidity profiles. Moreover, this new-generation instru-ment provides more information about surface, vertical dis-tribution of hydrometeors, precipitation, and other key en-vironmental variables (Chen et al., 2007; Boukabara et al., 2013; Zou et al., 2013; Kongoli et al., 2015).
With regard to precipitation it should be mentioned that, although the reliable knowledge of its intensity and accumu-lation is essential for understanding the global hydrological and energy cycles, precipitation estimate (from satellite and from the surface) is complicated by several factors: the large variability of the precipitation in time and space, the con-version of satellite measurements into quantitative precipita-tion estimates, uncertainties associated to rain gauges (and to their spatial distribution) and radar measurements (i.e., at-tenuation, beam-blocking), and their unavailability in several regions in the world and over ocean (Mugnai et al., 1993; Iturbide-Sanchez et al., 2011; Bennartz and Petty, 2001; Tian et al., 2009; Kirstetter et al., 2012).
An important step forward towards the improvement of global precipitation monitoring is represented by the Global Precipitation Measurement (GPM) mission launched on 27 February 2014. GPM is expected to provide accu-rate precipitation estimates thanks to the availability of the NASA/JAXA GPM Core Observatory (GPM-CO) (equipped with the GPM Microwave Imager (GMI) and the Dual-frequency Precipitation Radar (DPR)), a common, global ob-servatory of 3-D precipitation structure at 5 km resolution, and to the exploitation of a constellation of international Low Earth Orbit (LEO) satellites equipped with microwave ra-diometers for precipitation observation, providing frequent measurements over most of the globe (3-hourly coverage be-tween 65◦S and 65◦N) (Hou et al., 2014; Draper et al., 2015; Newell et al., 2014; Petkovi´c and Kummerow, 2015). A con-tribution of ATMS as part of the GPM constellation is fore-seen in this direction, also in relation to the technological improvements over its predecessor sounders.
In Europe, the EUMETSAT “Satellite Application Facil-ity on Support to Operational Hydrology and Water Man-agement” (H-SAF; Mugnai et al., 2013a) has been called upon to participate in and to contribute towards the GPM
by providing its own precipitation products and simultane-ously be a user of GPM data and a direct collaborator of GPM on two main aspects: development and refinement of retrieval techniques through the exploitation of all available radiometers in the GPM constellation, and validation activ-ity. In this context, operational passive microwave (PMW) precipitation products for the different radiometers are being released within H-SAF as new radiometers become available, and they are based on two approaches (Mugnai et al., 2013b): the physically based Bayesian Cloud Dynamics and Radia-tion Database (CDRD) algorithm (Casella et al., 2013, Sanò et al., 2013) for conically scanning radiometers and the Pas-sive microwave Neural network Precipitation Retrieval al-gorithm (PNPR) for cross-track scanning radiometers, origi-nally developed for AMSU/MHS and fully described in Sanò et al. (2015) (PNPR-AMSU/MHS, hereafter PNPR v1).
The objective of this paper is to describe the develop-ment and evaluate the performance of a newly developed version of PNPR designed to retrieve the instantaneous sur-face precipitation using the ATMS radiometer data. This al-gorithm (PNPR-ATMS, hereafter PNPR v2) represents an evolution of PNPR v1 (used operationally within the EU-METSAT H-SAF) with improvements aimed at exploiting the new precipitation-sensing capabilities of ATMS with re-spect to AMSU/MHS.
Neural networks (NNs) represent a highly flexible tool al-ternative to regression and classification techniques, widely applied in an increasing field of meteorological research for their capability to approximate complex nonlinear and imper-fectly known functions (e.g., Liou et al., 1999; Del Frate and Schiavon, 1999; Shi, 2001; Marzban, 2003; Blackwell and Chen, 2005; Chen et al., 2006; Krasnopolsky et al., 2008; Shank et al., 2008; Haupt et al., 2009; Aires et al., 2012).
NNs have been used in precipitation retrieval – precipita-tion being one of the most difficult of all atmospheric vari-ables to retrieve – because of the opportunities offered by their ability to learn and generalize (Hsu et al., 1997; Hall et al., 1999; Staelin et al., 1999; Sorooshian et al., 2000; Chen and Staelin, 2003; Hong et al., 2004; Surussavadee and Staelin, 2007, 2008a, b, 2009, 2010; Bellerby, 2007; Krasnopolsky et al., 2008; Leslie et al., 2008; Mahesh et al., 2011). However, it should be mentioned that the use of NNs involves the training phase with a large representative database, often obtained from cloud-resolving model sim-ulations. Consequently, the performance of the network is largely dependent on the completeness and the representa-tiveness of the database and on its consistency with the ob-servations.
cloud-resolving model), and in the training process. With re-gard to the input variables, when MW radiometers are used their choice is normally based on physical considerations on the radiometric signatures (or brightness temperatures, TBs) of different microwave channels and on the direct or indi-rect relationship of these signatures with environmental, me-teorological, and microphysical variables (e.g., atmospheric temperature and humidity, surface conditions, hydrometeor types, sizes, and shapes) involved in the precipitation re-trieval process. The TBs at the MW channels so identified are selected as part of the input variables. However, some techniques such as principal component analysis (PCA) are applied to the selected channels in order to reduce the num-ber of inputs, reduce the complexity of the NN, and to reduce the noise (e.g., to filter out the signal due to the background surface) (Chen and Staelin, 2003; Surussavadee and Staelin, 2008a, 2010; Blackwell and Chen, 2005). Special functions of TBs already proposed for rainfall retrieval (Kidd, 1998; Ferraro and Marks, 1995; Grody, 1991), such as the polariza-tion corrected temperature (PCT85)and the scattering index,
have also been considered as the NN inputs (Sarma et al., 2008; Mahesh et al., 2011). Some geographical and meteo-rological parameters (e.g., surface type, surface height, sea-son, latitude) are often considered as auxiliary input data in order to reduce the ambiguity intrinsic to the PMW precipita-tion retrievals based only on observed TBs (e.g., Panegrossi et al., 1998; Kummerow et al., 2011; You and Liou, 2012; You et al., 2015).
In the VIS/IR-based NN algorithms the input selection is based on different considerations due to the indirect relation-ship between cloud-top radiances and surface rainfall and the lack of information on the precipitation structure within the cloud. Additional inputs are then considered in addition to TBs, i.e., cloud texture information (TB mean and variance for 3×3 and 5×5 pixel rectangles around each measure-ment), the rate of change of cloud-top temperatures, and the number of pixels with TB less than a given threshold (Hsu et al., 1997; Bellerby et al., 2000; Tapiador et al., 2004). This approach normally involves the use of more complex net-works.
The number of NNs used in the precipitation retrieval al-gorithms is defined so as to optimize the network perfor-mance under different operating conditions. In PMW precip-itation retrieval separate NN algorithms are usually proposed depending on the type of surface (i.e., land or sea) to dis-criminate between the different precipitation emission signa-tures relative to background (e.g., Surussavadee and Staelin, 2008a). Separate NN algorithms are also proposed to deal separately with stratiform and convective precipitation (e.g Sarma et al., 2008).
In the design of PNPR v2 important aspects in relation to the topics mentioned above, concerning the choice of the inputs, the number of networks used by the algorithm, and the database used in the training phase, have been thoroughly analyzed and will be presented in this paper.
Another important issue to consider is that PNPR v2 has been designed in the perspective of the full exploitation of the MW radiometers in the GPM constellation of satellites, and of the achievement of consistency (besides accuracy) of the retrievals from the different sensors. These goals are considered priorities in the international GPM mission com-munity because their achievement leads to a significant re-duction of the errors, also associated with the inadequate sampling of precipitation, with positive impact on precipi-tation monitoring (see also Panegrossi et al., 2015, 2016), hydrological applications, and climate studies. This is also true when higher spatial/temporal-resolution products based on MW/IR combined techniques are used, such as IMERG (GPM) and TMPA (Tropical Rainfall Measuring Mission – TRMM; see Huffman et al., 2007, 2015); within the EU-METSAT H-SAF program these aspects have also become a priority. Therefore, PNPR v2 for ATMS, as well as PNPR v1 for AMSU/MHS, and all other H-SAF products for conically scanning radiometers represent an important contribution to-wards the exploitation of the current and future constellation of PMW radiometers for global precipitation monitoring.
In this paper the PNPR v2 algorithm is described in detail, and the methodology and the results of an intercomparison of the PNPR v2 instantaneous precipitation estimates with co-located spaceborne radar estimates from the TRMM Precip-itation Radar (TRMM-PR) and from the GPM-CO Ku-band Precipitation Radar (GPM-KuPR) are presented.
Section 2 presents a brief description of the characteristics of ATMS. In Sect. 3 a description of the PNPR v2 algorithm is presented, with reference to the design of the neural net-work, the main characteristics of the algorithm, and the rele-vant features of the ATMS training database. The verification study is presented in Sect. 4, which includes a brief descrip-tion of the characteristics of PR and DPR, of the methodol-ogy used to create the co-located observation dataset used in the study, the analysis of the performance of PNPR v2 com-pared to TRMM-PR and to GPM-KuPR, and a comparison with PNPR v1 using TRMM-PR rainfall estimates as refer-ence. Section 5 contains the conclusive remarks about the performance of PNPR v2 and future perspectives.
2 The ATMS radiometer
Partic-ularly, ATMS channels 1–16 provide measurements at mi-crowave frequencies below 60 GHz and in an oxygen ab-sorption band, and channels 17–22 are located at higher mi-crowave frequencies above 89 GHz and in a water vapor ab-sorption band. The beamwidth changes with frequency and is 5.2◦for channels 1–2 (23.8–31.4 GHz), 2.2◦for channels 3– 16 (50.3–57.29 and 88.2 GHz), and 1.1◦for channels 17–22 (165.5–183.3 GHz). The corresponding nadir resolutions are 74.78, 31.64, and 15.82 km, respectively. The outmost FOV sizes are 323.1 km×141.8 km (cross-track ×along-track), 136.7 km×60.0 km, 68.4 km×30.0 km, respectively.
Compared with its predecessors AMSU and MHS, ATMS has improved resolution (31.6 km at nadir in the 54 GHz band, vs. 48.6 km for AMSU) and angular sampling (1.11◦ in the 54 GHz band, vs. 3.33◦for AMSU), and has the great advantages of a wider swath that practically eliminates the orbital gaps. There are slight differences in the frequencies of ATMS channels 88.2, 165.5, and 183.31±7.0 GHz with respect to the corresponding MHS channels (89.0, 157.0, and 190.31 GHz). Three new channels are added compared to AMSU/MHS: channel 4 (51.76 GHz) for lower tropo-spheric temperature sounding and the two channels 19 and 21 (183.31±4.5 and 183.31±1.8 GHz) to enhance the mois-ture profiling performance, improving the vertical resolu-tion, and potentially very useful also for precipitation (Su-russavadee et al., 2012; Weng et al., 2012; Zou et al., 2013).
3 The new PNPR algorithm 3.1 Algorithm description
PNPR v2 represents an evolution for ATMS applications, of the previous PNPR v1 algorithm based on a NN approach, developed at ISAC-CNR for precipitation rate estimation us-ing AMSU/MHS observations. The full description of PNPR v1 is provided in Sanò et al. (2015), while some important aspects are reviewed in this paper for completeness.
Both versions of PNPR are designed to work over the full Meteosat Second Generation (MSG) disk area (60◦S– 75◦N, 60◦W–60◦E). In PNPR v1 the training of the NN was carried out using two distinct NNs, one for the Euro-pean/Mediterranean area (Sanò et al., 2015) and one for the African area (Panegrossi et al., 2014). Each network was de-signed to work with all types of surface backgrounds (i.e., land, sea, coast) in order to reduce the discontinuity of pre-cipitation estimates often found in correspondence with tran-sitions between surfaces with different radiometric proper-ties. In PNPR v2 one unique NN has been designed, capable of operating on the whole MSG disk area regardless of the type of surface and of the geographical area.
Another significant aspect in the design of PNPR v1 was the use of the TB differences in the water vapor absorption band channels at 183 GHz as input to the neural network. Opaque channels around 183 GHz were originally designed
to retrieve water vapor profiles due to their different sensitiv-ity to specific layers of the atmosphere (Wang et al., 1997; Staelin and Chen, 2000; Blackwell and Chen, 2005). How-ever, these channels have shown great potential for precip-itating cloud characterization and for precipitation retrieval. The different penetration ability of these channels in the at-mosphere can be exploited to analyze the vertical distribu-tion of hydrometeors (Wang et al., 1989, 1997; Burns et al., 1997; Staelin and Chen, 2000; Ferraro et al., 2005; Hong et al., 2005, 2008; Funatsu et al., 2007, 2009; Laviola and Levizzani, 2011) and to obtain some criteria for the char-acterization of precipitation as weak, moderate, strong con-vective, or stratiform using the TB differences 117, 113,
and137 (corresponding, respectively, to the differences
be-tween the 183.31±1 and 183.31±7 GHz, 183.31±1 and 183.31±3 GHz, 183.31±3 and 183.31±7 GHz channels) (e.g., Ferraro, 2004; Qiu et al., 2005). In the design of PNPR v2 we have focused on the exploitation of the improved tech-nical characteristics of ATMS with respect to AMSU/MHS, with the analysis of the information carried by two new channels in the 183 GHz water vapor absorption band (at 183.31±4.5 and 183.31±1.8 GHz) (see Sect. 3.4 dedicated to the input selection). As in PNPR v1, a canonical correla-tion analysis has been carried out to find the linear combina-tion of TBs of selected channels best correlated with surface precipitation rate.
The flow diagram of the PNPR v2 algorithm is basically the same as that of PNPR v1, described in detail in Sanò et al. (2015), except for the use of one unique network trained on a database representative of MSG full disk area (see Sect. 3.2) and changes in the input selection in the design of the network (described in Sect. 3.4). Furthermore, in the preprocessing of the brightness temperatures, in addition to the decoding of the file format and the quality control of the input data, the removal of the three outmost pixels along the scan is carried out. Other processing steps of the algo-rithm, such as the screening procedure of no-rain pixels and the quality index map providing indications on areas or con-ditions where the retrieval is more or less reliable, are un-changed with respect to those used for the algorithm PNPR v1 (Sanò et al., 2015). In a similar way, the new algorithm also provides at its output, in addition to the precipitation rate (mm h−1), the phase of the precipitation (solid, liquid, mixed, or unknown), and the quality index. The PNPR v2 output is provided on a grid corresponding to the ATMS nominal reso-lution varying from 15.82 km×15.82 km/circular at nadir to 68.4 km×30.0 km/elliptical at scan edge.
3.2 The training database
Figure 1.Geographical location of the inner domain of the 94 NMS simulations over European and African areas.
34 simulations over Africa and Southern Atlantic (Pane-grossi et al, 2014). The simulations were carried out using the University of Wisconsin Nonhydrostatic Modeling Sys-tem (UW-NMS) (Tripoli, 1992; Tripoli and Smith, 2014a, b) coupled to a radiative transfer model (RTM) relating CRM environments to expected top-of-atmosphere PMW TBs of the ATMS radiometer (see Smith et al., 2013, and Casella et al., 2013, for the details about the cloud model configuration setup and Sanò et al., 2015, for AMSU/MHS RTM simula-tions). Figure 1 shows the geographical location of the inner domain of the 94 simulations. Simulated events were selected in order to cover the different seasons and different meteo-rological situations and precipitation regimes. The selection of the simulations in terms of season, typology of event, and geographical location was performed in order to optimize the completeness and representativeness of the database for the area of interest (see Casella et al., 2013). In detail, over the European/Mediterranean area we have considered 15 differ-ent meteorological evdiffer-ents for each season over differdiffer-ent ge-ographical areas. Simulations over African and Southern At-lantic area were chosen also on the basis of the TRMM-PR observations (in particular the rain type flag and the freezing level height) and different climatic regions in order to cover as much as possible the climatic variability in the area of in-terest with a limited number of simulations.
The simulated TBs were calculated considering the differ-ent ATMS viewing angles and channel frequencies using the same approach used for AMSU/MHS and described in Sanò et al. (2015). For the European/African regions, the database contains more than 70 million entries. Each entry is a vec-tor composed of the simulated ATMS TBs, surface precip-itation rate, and the corresponding ancillary parameters, as-sociated with one cloud-resolving model microphysical re-alization and one ATMS viewing angle (and corresponding IFOV). It is worth noting that 45 different ATMS viewing angles (discarding the three outmost pixels due to the low resolution) are considered to build the database.
3.3 The neural network
A detailed description of the NN is provided in Sanò et al. (2015), but some basic aspects are presented for complete-ness.
The neural network scheme, shown in Fig. 2 in Sanò et al. (2015), is characterized byniinputs, one input layer, two hidden layers, and a number of nodes for each layer (e.g., n1 for the first layer). Each node has its own transfer func-tion and receives, as input, a weighted sum of the outputs of the previous layer. The output of the transfer function corre-sponds to the output of each node. For example, the output of a node (kth), yk, of the first hidden layer takes the form: yk(ω, x)=f2
hXn1
j=1ωkj·f1·
Xni
t=1ωj t·xt+b1
+b2
i
, (1) wherext is the input signals (nivalues),ωj t is the weights connecting the inputs to the nodes of the input layer, andωkj the weights connecting the nodes of the input layer to the nodes of the first hidden layer.f1andf2are the transfer
func-tions of the input layer and the first hidden layer, andb1 and b2 are the bias of nodes of the two layers. During the training phase (back propagation network and Levenberg–Marquardt algorithm) a training database is used that provides the net-work with synthetic input and output data. The input signal propagates forward from the input layer of nodes to the out-put layer. The node in the outout-put layer produces an outout-put (yi), which is compared to theith target output (ti)defined in the training set. An error value is calculated as
E= 1 n
Xn
i=1(yi−ti)
2, (2)
wheren is the number of elements of the training set. The network corrects its weights to lessen the errors. The iteration continues in order to minimize the error. At the end of the training phase the performance of the NN is measured by the mean squared error and the correlation coefficient (CC). 3.4 Input selection
Figure 2.Relative sensitivity (Si)of the NN evaluated for five in-puts (113,137, 117,124, LCT), for three different background
surfaces.
performance of the NN or on their sensitivity to precipita-tion. Consistently with PNPR v1 and on the basis of the re-sults obtained for AMSU/MHS (Sanò et al., 2015), for the new NN we have initially imposed the use of the three inputs 117,113, and137 (Hong et al., 2005; Funatsu et al., 2007,
2009). These TB differences have been proven to be very effective in detecting precipitation, differentiating between different precipitation structures, and retrieving rainfall rate. For PNPR v2, a detailed analysis to evaluate the effect of additional inputs on the performance of the NN has been carried out. All possible TB differences with the two new ATMS 183 GHz (183.31±1.8 and 183.31±4.5 GHz) chan-nels were considered, and the analysis was based on a cross-validation method (Anders and Korn, 1999; Marzban, 2009) already used for PNPR v1 (Sanò et al., 2015). This method consists, essentially, in comparing the quality of two NNs by evaluating their mean squared prediction error (MSPE) when they are applied to an equal number (M) of valida-tion datasets. Therefore, the cross-validavalida-tion index (CV) is defined as
CV= 1 M
XM
m=1MSPEm. (3)
In a first test, only the three differences 114, 124,
and 127 (corresponding, respectively, to the
differ-ences between the 183.31±1 and 183.31±4.5 GHz, 183.31±1.8 and 183.31±4.5 GHz, and 183.31±1.8 GHz and 183.31±7 GHz channels) showed a real improvement in the NN performance. The use of the differences between con-tiguous channels resulted in fact irrelevant. The subsequent tests with these three new inputs proved that124, added to 117,113, and 137 already selected in PNPR v1, was the
input with most significant impact on the NN performance. Table 1 shows some results obtained during the test.
In the table the various possible differences considered as input to the NN in this analysis are shown in the first col-umn;1F=113,137,117denotes the three difference
com-binations used in the PNPR v1 algorithm. In the second and
Table 1.Results of the tests for the selection of the inputs to the NN. Input combinations are listed in the first column (1F=113, 137,117);Rindicates the correlation coefficient, MSE the mean
squared error, and CV the cross-validation index (subscripts L and CV indicate the learning and cross-validation phases).
INPUT RL MSEL RCV CV
1F 0.85 0.39 0.76 0.42
1Fand114,124,127 0.78 0.64 0.70 0.68
1Fand114,124 0.89 0.37 0.80 0.42
1Fand114,127 0.83 0.49 0.78 0.53
1Fand124,127 0.81 0.50 0.70 0.54
1Fand114 0.87 0.37 0.79 0.41
1Fand124 0.92 0.32 0.87 0.35
1Fand127 0.83 0.48 0.68 0.52
fourth columns the values of the CCs between output and tar-get during the learning phase (RL)and the mean values
dur-ing the cross-validation phase (RCV)are shown. In the third
and the fifth columns the values of the mean squared error during the learning phase (MSEL)and the cross-validation
index CV (the mean MSPE values during the cross-validation phase) are provided. From the results shown in the table it is evident that the NN performance improves when the input 124 is added. It is worth noting that to achieve the results
shown in Table 1 the training protocol described in Sanò et al. (2015) has been applied, and for each input configuration (each row in the table) more than 100 NNs (with different levels and nodes) were compared to select the optimal net-work configuration, where “optimal” refers to the one with best performance, i.e., minimum CV over the full dynamic range of the inputs, absence of overfitting, and absence of anomalous inhomogeneities in the retrievals (Staelin and Su-russavadee, 2007).
The contribution of 124 as new input can be seen as a
compensation of117when, under certain conditions, this is
affected by the “noise” of the background surface. In fact, the 183±7 GHz channel, the most penetrating among the 183 GHz channels, has a weighting function peaking at the lowest levels (Bennartz and Bauer, 2003), and the TB can be significantly affected by the signal from the underlying surface (for example in cold and dry conditions). In con-trast, in the same conditions, the 183±4.5 GHz channel has a weighting function peaking at higher levels. Some tests have been carried out on different cloud model profiles extracted from the CRM simulations and based on RTM computations to analyze the behavior of the117 and124, and they have
confirmed these effects (not shown). We have also verified that, by replacing117with124, a lower performance of the
network is achieved, whereas the combined use of the two differences guarantees the optimal performance. The use of 124 as added input to117,113, and137 in PNPR v2
in-puts of the NN in order to reduce its complexity, key aspects in any NN design.
Another difference between PNPR v2 and PNPR v1 al-gorithms is the result of the canonical correlation analysis (CCA) applied to the training database to find the linear com-bination of TBs (LCT) of selected channels best correlated with surface precipitation rate, to be used as additional input to the network (see Sanò et al., 2015). The resulting linear combination for ATMS is composed of the window channels 31.4, 88.2, and 165.5 GHz, showing the highest CCs in the CCA analysis (with respect to the surface rain rate) for all types of background surfaces (in PNPR v1 for AMSU/MHS the 50.3, 89, and 150 GHz were selected for LCT).
With regard to other inputs to the network, in PNPR v2 the same ancillary data used in PNPR v1 were maintained (surface height, background surface type, month, and se-cant of the zenith angle along the ATMS cross-track scan). An additional auxiliary input was added to drive NN in the transition between the European and African area, i.e., the monthly mean total precipitable water (TPW) obtained from ECMWF Era Interim reanalysis in the 2011–2014 period. It should be mentioned that geographical and environmen-tal/meteorological parameters (including TPW) in PMW pre-cipitation retrieval are utilized to reduce the ambiguity intrin-sic to the PMW precipitation retrieval process (for example in the NASA GPM Bayesian algorithms – see Kummerow et al., 2011, 2015; Kidd et al., 2016).
During the phase of network design and the training pro-cess, more than 400 architectures have been tested and an “optimal” NN has been obtained.
In summary, 10 input variables (five TBs derived and five ancillary inputs) are used in the NN for ATMS:
1. an LCT at 31.4, 88.2, and 165.5 GHz;
2. 117difference between the TBs of channels 183.31±1
and 183.31±7 GHz;
3. 137difference between the TBs of channels 183.31±3
and 183.31±7 GHz;
4. 113difference between the TBs of channels 183.31±1
and 183.31±3 GHz;
5. 124 difference between the TBs of channels
183.31±1.8 and 183.31±4.5 GHz; 6. surface type (land, sea, coast); 7. monthly mean TPW;
8. month;
9. surface height (altitude); 10. secant of the zenith angle.
The network architecture is similar to that of PNPR v1, with one input layer (with number of nodes equal to the num-ber of inputs) and two hidden layers with 23 and 10 nodes in the first and in the second layer, respectively (the number of nodes differs from PNPR v1). The tan-sigmoid transfer func-tion is used for the input and the hidden layers, while a linear transfer function is used for the output node.
3.5 Sensitivity analysis
During the training procedure, an assessment of the sensitiv-ity of the NN output to variations of the inputs was carried out. Sensitivity analysis provides an estimation of the relative importance of the inputs (Coulibaly et al., 2005). The knowl-edge of the NN behavior, in relation to input perturbation, helps to assess the relevance of the individual contributions to the output and to verify the correct training of the NN (i.e., the weights remain stable) that is achieved when there is no significant changes of the sensitivity during the last training iterations (epochs).
The sensitivity analysis, limited to the TBs derived vari-ables that are more related to the rain rate estimate and not to the ancillary variables, was applied to the “optimal” NN (i.e., defined by the listed inputs and the architecture described in the previous section) and was carried out during the final phase of the training (see Sanò et al., 2015). The final phase was reached when the two parameters indicating the quality of the learning process, i.e., the CC (R) and the gradient of performance (mean squared error) were, respectively, larger than 0.89 and less than 0.05, with the number of epochs in the 700–900 range (see Sanò et al., 2015, for more details on this procedure). The assessment of the sensitivity was carried out several times, in correspondence with successive epochs (to ensure the representativeness of the data used for the anal-ysis), and for three different surface types (land, coast, and ocean), using NN input data randomly extracted from the training and test databases. Five inputs (113,137,117,124,
LCT) were slightly perturbed by percentages of their value within three times their standard deviation (calculated in the database).
The relative sensitivity (S) of the NN to each input (i.e., for a number of input perturbations) is calculated as the ratio between the mean standard deviation of the output (i.e., the surface rainfall rate) and the mean standard deviation of the input.
Si=
σ (RRi)
σ (Vi) , (4)
whereSi is the relative sensitivity corresponding to the in-putVi andσ (RRi)andσ (Vi)are the standard deviations of the rainfall rate and the input variable. Figure 2 shows the results obtained for the three different background surface types considered.
evi-Figure 3.Number of co-located pixels from TRMM-PR and the Suomi-NPP ATMS coincident overpasses over the African area in the 24-month period 2013–2014 (left panel) and from GPM-Ku-NS and Suomi-NPP ATMS coincident overpasses over European and African areas in the 15-month period (March 2014–May 2015) (right panel).
dent the higher sensitivity of NN with respect to the LCT in comparison with the other inputs; this is due to the contri-bution of window channels used in LCT, selected by max-imizing the correlation with the surface precipitation rate. Another important aspect is the relative contribution of the other inputs (TBs difference in the 183 GHz band channels) quite similar among the three types of surface, with a slightly higher contribution of the input117for land and coast and a
good contribution of the new ATMS input124for all surface
types.
4 Verification study 4.1 Dataset description
This section presents the verification study carried out for the PNPR v2 algorithm, using as reference the data provided by the TRMM and GPM spaceborne radars. The TRMM-PR is a 13.8 GHz radar with a swath width of 247 km (after the satellite was boosted to higher orbit in 2001). Its coverage al-lows regional intercomparison of convective–stratiform con-tributions to precipitation across the tropics, with data avail-able since the launch of the satellite in November 1997 un-til October 2014. It is considered the precursor to GPM DPR and has represented, during this time interval, the best
beamwidth, equal to 0.71◦, and cross-track swath widths of 245 and 120 km, respectively. In this study we have consid-ered only the GPM-KuPR products because of the similar-ities with the TRMM-PR and because its larger swath size compared to the GPM-KaPR offers better chances to find co-incident observations with ATMS.
It is worth considering also that in spite of the similarities between the two radars, the GPM-KuPR has higher sensi-tivity (with minimum detectable reflecsensi-tivity between 12 and 14 dBZ, outperforming the original instrumental design of 18 dBZ) (Toyoshima et al., 2015; Hamada and Takayabu, 2016) than the TRMM-PR radar (18 dBZ minimum detectable re-flectivity).
Two datasets have been created, one composed of 2 years (2013–2014) of coincident Suomi-NPP ATMS and TRMM-PR overpasses over the African area (36◦S–36◦N and 60◦E–30◦W), and one made of 15 months (1 March 2014– 31 May 2015) of ATMS and GPM-KuPR coincident over-passes over the European and African areas (36◦S–65◦N and 60◦E–30◦W). In the study the comparison is carried out be-tween the PNPR v2 precipitation rate and the NASA/JAXA precipitation products from the two spaceborne radars, in particular the TRMM-PR standard product 2A25 (V7) and GPM 2ADPR Ku normal scan (Ku-NS) (V03). Coincident observations in the area of interest within a 15 min time win-dow (maximum delay between the observations to be consid-ered coincident) have been considconsid-ered between ATMS and TRMM-PR (hereafter ATMS-PR) and between ATMS and GPM-Ku-NS (hereafter ATMS-DPR-Ku).
It should be pointed out that the results obtained from the ATMS-DPR-Ku coincidence dataset are not as robust as the results obtained from the ATMS-PR dataset because of the limited size of the dataset and because of some uncertainties in the less consolidated day-1 V03 DPR products, linked to factors such as the DSD parameterization (Liao et al., 2014), the evaluation of the path-integrated attenuation, the surface reference technique, and the non-uniform beam-filling effect (Shimozuma and Seto, 2015).
Figure 3 (left panel) shows the geographical distribution (on the ATMS grid) of about 1.8 milions coincident pixels ATMS-PR found over the African area in the 2-year time frame 2013–2014. The figure shows a rather good coverage of the entire area, with a number of coincident pixels between 30 and 150 on Central Africa, increasing moving to the north and to the south.
In the right panel of the figure, the distribution of the coin-cident pixels ATMS-DPR-Ku over the European and African areas, between March 2014 and May 2015, is shown. In con-trast to the left panel, the coverage is not as good with a lower number of coincident pixels, and with some uncovered ar-eas. The number on coincident pixels increases over north-ern Europe at the high latitudes, reaching a maximum value around 200. In the southern part of Europe and Africa, the number of coincidences is significantly reduced (maximum values around 50).
To obtain co-located vectors of rainfall estimates of ATMS and TRMM-PR, and of ATMS and GPM-KuPR, the radar precipitation rate at the surface was downscaled to the PNPR v2 product nominal resolution (variable along the scan line, see Sect. 3.1), by averaging the rainfall rate of all radar pix-els falling within each PNPR v2 pixel. In order to reduce the geolocation and synchronization errors, due to the different viewing geometry of ATMS and the spaceborne radar, and to the time lag between the observations, statistical analysis was carried out over a regular grid at 0.5◦×0.5◦resolution. For some of the analysis the coincidence datasets were cat-egorized on the basis of the background surface – vegetated land, arid land (for Africa only), ocean, and coast – using a digital land/sea map at 2 s of arc resolution (see Casella et al., 2015).
4.2 Comparison with TRMM-PR
Figure 4 shows the geographical distribution of the values of three statistical indexes (hit bias, CC, and root mean squared error (RMSE); see Tian et al., 2016, for the definition of these scores), obtained for the ATMS-PR dataset. The scores are computed considering all coincident ATMS-PR pixels within each 0.5◦×0.5◦grid box (regardless of the time of the over-passes) with precipitation rate greater than 0 mm h−1 both from the radiometer and the radar (hits only).
The top panel shows a rather uniform distribution of low bias (between −0.2 and 0.1 mm h−1, negative in most re-gions), with areas with larger positive bias (0.8 mm h−1) over the equatorial region, mostly over the Atlantic and In-dian Ocean, and a few scattered areas of larger negative bias (−0.8 mm h−1). Moreover, the algorithm shows an
over-all good correlation (middle panel) (CC > 0.8 in most areas) and an RMSE (bottom panel) with a pattern quite similar to the hit bias, with most values between 0.2 and 0.5 mm h−1, and a limited number of grid points with values around 1.3 mm h−1. Overall, the panels point out a good agree-ment between PNPR v2 and TRMM-PR, evidenced by the widespread low values of bias and RMSE and the high val-ues of CC.
agree-Figure 4.Hit bias (top panel), correlation coefficient (CC, middle panel), and root mean squared error (RMSE, bottom panel) resulting from the comparison between PNPR v2 and TRMM-PR retrievals over the African area (using a 0.5◦×0.5◦regular grid, for the pe-riod 2013–2014).
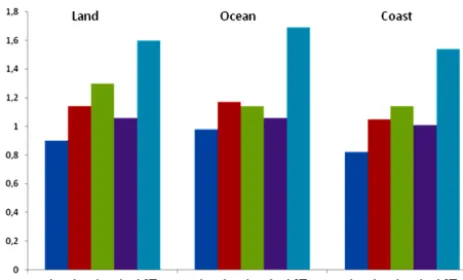
ment between PNPR v2 and TRMM-PR for the different sur-face types (results for coast and arid land are affected by the low number of coincident pixels found for these areas). The (small) bias is negative for vegetated land (−0.08 mm h−1) and arid land (−0.05 mm h−1) and positive for ocean and coast (0.05 mm h−1). Low RMSE is also found for all sur-face types, higher for ocean (1.30 mm h−1)than for vegetated land (1.11 mm h−1), and equal to 0.80 and 1.37 mm h−1for arid surfaces and coastal area, respectively. CC is higher for vegetated land (0.71) compared to ocean (0.69), coast (0.65), and arid land (0.64).
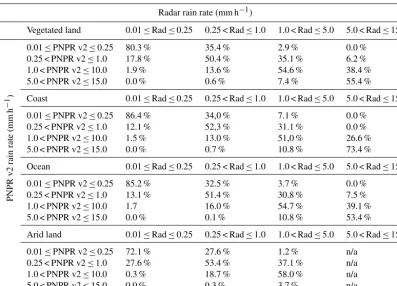
Table 2 presents the contingency table for the ATMS-PR dataset, based on the mean rainfall rate from ATMS and TRMM-PR within each 0.5◦×0.5◦grid box. The percent-ages shown in a given column, provided for the four sur-face backgrounds, represent how the PNPR v2 product clas-sifies the precipitation assigned to each TRMM-PR class. Four rainfall rate intervals were selected in this compar-ison, 0.01–0.25, 0.25–1, 1–5, and 5–15 mm h−1. There is an appreciable general consistency between PNPR v2 and
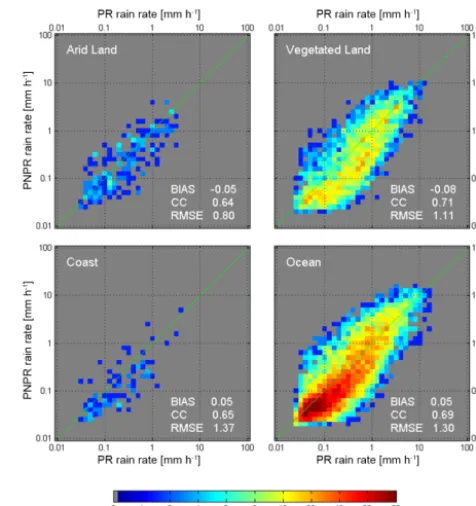
Figure 5.Density scatter plots of the PNPR v2 and TRMM-PR mean rainfall rates (over a 0.5◦×0.5◦regular grid, for the period 2013–2014) for the African area for different surface types. A log-arithmic scale is used for the precipitation rates in mm h−1.
TRMM-PR estimates, as shown by the largest percentages found on the main diagonal for each type of surface back-ground. The percentages exceed 70 % for low precipita-tion rates (≤0.25 mm h−1) and 50 % for higher
precipita-tion rates. Looking at the distribuprecipita-tion of the percentages for each radar range (in each column), the underestimation of PNPR v2 compared to TRMM-PR (higher percentages in the cells above the diagonal) is noticeable, which confirms what shown in Fig. 5 for vegetated land and ocean.
Table 3 shows the performance index calculated for the different background surfaces, defined as
Perf.Index=100· P4
i=1 nij (i=j )
1i
P4 i=1
P4
j=1nij
1i
, (5)
Table 2.Contingency table of PNPR v2 retrievals relative to TRMM-PR measurements (at 0.5◦×0.5◦resolution). n/a indicates not available.
Radar rain rate (mm h−1)
Vegetated land 0.01≤Rad≤0.25 0.25 < Rad≤1.0 1.0 < Rad≤5.0 5.0 < Rad≤15.0
PNPR
v2
rain
rate
(mm
h
−
1)
0.01≤PNPR v2≤0.25 80.3 % 35.4 % 2.9 % 0.0 % 0.25 < PNPR v2≤1.0 17.8 % 50.4 % 35.1 % 6.2 % 1.0 < PNPR v2≤10.0 1.9 % 13.6 % 54.6 % 38.4 % 5.0 < PNPR v2≤15.0 0.0 % 0.6 % 7.4 % 55.4 %
Coast 0.01≤Rad≤0.25 0.25 < Rad≤1.0 1.0 < Rad≤5.0 5.0 < Rad≤15.0
0.01≤PNPR v2≤0.25 86.4 % 34,0 % 7.1 % 0.0 % 0.25 < PNPR v2≤1.0 12.1 % 52,3 % 31.1 % 0.0 % 1.0 < PNPR v2≤10.0 1.5 % 13.0 % 51,0 % 26.6 % 5.0 < PNPR v2≤15.0 0.0 % 0.7 % 10.8 % 73.4 %
Ocean 0.01≤Rad≤0.25 0.25 < Rad≤1.0 1.0 < Rad≤5.0 5.0 < Rad≤15.0
0.01≤PNPR v2≤0.25 85.2 % 32.5 % 3.7 % 0.0 % 0.25 < PNPR v2≤1.0 13.1 % 51.4 % 30.8 % 7.5 % 1.0 < PNPR v2≤10.0 1.7 16.0 % 54.7 % 39.1 % 5.0 < PNPR v2≤15.0 0.0 % 0.1 % 10.8 % 53.4 %
Arid land 0.01≤Rad≤0.25 0.25 < Rad≤1.0 1.0 < Rad≤5.0 5.0 < Rad≤15.0
0.01≤PNPR v2≤0.25 72.1 % 27.6 % 1.2 % n/a 0.25 < PNPR v2≤1.0 27.6 % 53.4 % 37.1 % n/a 1.0 < PNPR v2≤10.0 0.3 % 18.7 % 58.0 % n/a 5.0 < PNPR v2≤15.0 0.0 % 0.3 % 3.7 % n/a
Table 3.Performance indexes for the different background surfaces.
Vegetated Ocean Coast Arid
land land
Perf. index 69.0 % 76.0 % 75.7 % 66.7 %
4.3 Comparison with GPM-KuPR
As mentioned previously, a verification of PNPR v2 algo-rithm has been made also using precipitation rate estimates from the GPM-KuPR, available at mid-high latitudes. This was initially intended for the European area only, where a larger number of coincident overpasses are available dur-ing the time frame considered (March 2014–May 2015) (see Fig. 3). However, results are shown also for the African area, despite the lower number of coincidences available, in order to assess the degree of consistency of the results obtained over the same area with the two Ku-band spaceborne radars. As for the comparison with the TRMM-PR, all co-located ATMS and GPM-KuPR retrievals were regridded at a 0.5◦×0.5◦ resolution, and only grid boxes with precipi-tation rates greater than 0 mm h−1 (hits) are considered. In Fig. 6 the density scatter plots over the African area and the European area are shown, for vegetated land and ocean (the number of coincidences for the other surface types is too low in the ATMS-DPR-Ku dataset). The corresponding values of
Table 4.Statistical indexes obtained in the comparisons of PNPR v2 retrievals with GPM-KuPR and TRMM-PR products.
Vegetated land Ocean GPM-KuPR/ GPM-KuPR/ TRMM-PR TRMM-PR
BIAS (mm h−1) 0.15/−0.08 −0.04/0.05 CC 0.70/0.71 0.70/0.69 RMSE (mm h−1) 1.08/1.11 1.21/1.30
bias, CC, and RMSE computed over the whole dataset are also provided in each panel. Over Africa, both panels show patterns quite similar to those found in the comparison with TRMM-PR (Fig. 5). Also in this case there is a slight under-estimation for low precipitation (< 1 mm h−1)more evident over the ocean. Table 4 shows the comparison between sta-tistical indexes obtained for the ATMS-DPR-Ku dataset and those obtained for the ATMS-PR dataset, shown in Fig. 5.
The table shows a good agreement between the scores ob-tained with two datasets, with very low bias (slightly posi-tive/negative over land/ocean for the ATMS-DPR-Ku dataset, while the reverse is valid for the ATMS-PR dataset), low RMSE (lower for the ATMS-DPR-Ku dataset), and good cor-relation.
Figure 6.Density scatter plots of the PNPR v2 and GPM-KuPR mean rainfall rates (over a 0.5◦×0.5◦regular grid, for the period 1 March 2014–31 May 2015) for the African area (left panels) and the European area (right panels), for vegetated land and ocean. A logarithmic scale is used for the precipitation rates in mm h−1.
European area. Pixels with likely presence of ice or snow on the ground have been eliminated from the dataset in or-der to exclude from the verification study cases of snowfall (or precipitation over frozen background) whose precipita-tion rate estimate is affected by larger uncertainty (both in the GPM-DPR-Ku V03 product and in PNPR v2). For the identification of these pixels the “Snow Depth” and “Sea Ice Cover” products from the ECMWF Era Interim re-analysis (at 0.5◦×0.5◦resolution) available every 6 h have been used. A dataset corresponding to the ATMS-DPR-Ku coincidence rainfall pixels has been created, considering the ECMWF re-analysis closest in time to each overpass and using the nearest-neighbor approach to match the ATMS-DPR-Ku pix-els with the ECMWF grid.
The scatter plots in Fig. 6 show a similar behavior for veg-etated land for the two areas, while over ocean in the Euro-pean area there is a general tendency of PNPR v2 to over-estimate the precipitation with respect to the GPM-KuPR. The total bias has very low values, negative for vegetated land (−0.12 mm h−1)and positive for ocean (0.12 mm h−1). The CC show lower values than for the African region for the two background surfaces (0.59 for vegetated land, 0.57 for ocean), while the RMSE is lower than over the African region, equal to 0.82 mm h−1for vegetated land, and 0.71 mm h−1for ocean.
Figure 7.Hit bias (top panel), CC (middle panel), and RMSE (bot-tom panel) resulting from the comparison between PNPR v2 re-trievals and GPM-KuPR measurements over the European area (us-ing a 0.5◦×0.5◦regular grid, for the period 1 March 2014–31 May 2015).
4.4 Comparison with PNPR v1
In the second part of the verification study we have compared the performances over the African area of the PNPR v2 with the PNPR v1 to evaluate whether the use of the new ATMS channels and the newly designed NN have led to improve-ments in the retrievals. The performance of the PNPR v1 al-gorithm has been tested on the same 2-year period (2013– 2014) used for PNPR v2, considering coincident observa-tions of AMSU/MHS radiometers, on board the NOAA-18, NOAA-19, MetOp-A, and MetOp-B satellites, with TRMM-PR. The PNPR v1 and TRMM-PR coincidence dataset is made of about 3 million pixels. The procedure used to evalu-ate the PNPR v1 performance is the same as that adopted for the PNPR v2 algorithm, described in Sect. 4.1.
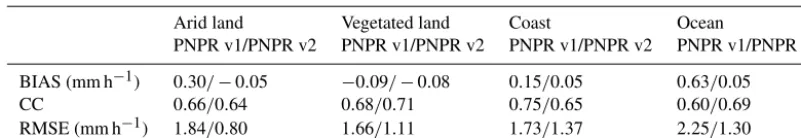
Table 5 presents the values of the statistical indexes hit bias, CC, and RMSE obtained in the comparison of PNPR v1 and PNPR v2 with TRMM-PR precipitation retrievals, over a 0.5◦×0.5◦ regular grid, for different background surfaces. These results indicate a good agreement of both the algorithm retrievals with the TRMM-PR (NASA/JAXA product 2A25) and a better performance of PNPR v2 es-pecially over vegetated land, in terms of CC (0.71 for PNPR v2 vs. 0.68 for PNPR v1) and RMSE (1.11 mm h−1 vs. 1.65 mm h−1), and over ocean in terms of all scores (CC=0.69 vs. 0.61, RMSE=1.30 mm h−1vs. 2.32 mm h−1,
and hit bias=0.05 mm h−1vs. 0.59 mm h−1). Over arid land
and coast PNPR v2 results might be affected by the limited size of the ATMS-PR coincidence dataset (ATMS is on board one satellite only, while AMSU/MHS is on board four differ-ent satellites). Improvemdiffer-ents compared to PNPR v1 are evi-dent in terms of hit bias (−0.05 mm h−1vs. 0.30 mm h−1for arid land and 0.05 mm h−1vs. 0.20 mm h−1for coast) and in terms of RMSE (0.80 mm h−1vs. 1.84 mm h−1for arid land and 1.37 mm h−1vs. 1.90 mm h−1for coast).
A further analysis of the performance of the two algo-rithms has been performed through the study of the relative bias percentage (RB%)and the adjusted fractional standard
error percentage (AFSE%) used to remove systematic errors
(Tang et al., 2014), as a function of the mean TRMM-PR rainfall rate value computed for different rainfall rate inter-vals (bins). In the analysis we have used rain rate bins of variable size to obtain a meaningful number of pixels within each bin.
These variables are defined as
relative bias %=100·
PN
i=1(mwi−rri)
PN
i=1rri
, (6)
AFSE %= q
1 N
PN
i=1(mwi−rri−bias)2 1
N
P
irri
·100, (7)
where mwi is the PNPR (v1 or v2) rainfall rate and rri is the TRMM-PR rainfall rate.N represents the number of pixels in each precipitation rate bin.
Figure 8.Relative bias percentage (top panel) and AFSE percentage (bottom panel) of PNPR v1 and PNPR v2 retrievals with respect to the TRMM-PR measurements.
Considering the RB%(top panel of Fig. 8), the better
per-formance of PNPR v2 in the rain rate estimation over ocean (solid blue line) with respect to the PNPR v1 (dashed blue line) is evident. The high relative bias over ocean for low rain rates in the PNPR v1 is significantly reduced in PNPR v2. In the interval between 0 and 4 mm h−1the RB%ranges
from 300 to 100 % for the PNPR v1 and from 50 to 1 % for the PNPR v2. In the following interval (4 to 10 mm h−1)the values varies from−5 to−40 % for both the algorithms with a slightly better performance of PNPR v2.
Over land both the algorithms present similar perfor-mances, with a slightly better result for PNPR v2 (solid black line) for low rain rates (0–3 mm h−1)and lower RB
%
of PNPR v1 (dashed black line) for higher rain rate values (> 3 mm h−1).
In the bottom panel of Fig. 8 AFSE% shows high values
(> 250 %) over ocean (blue curves) for very low rain rates (< 0.5 mm h−1)in PNPR v1, while for PNPR v2 AFSE% is
Table 5.Statistical indexes of the comparison of PNPR v1 and PNPR v2 vs. TRMM-PR retrievals.
Arid land Vegetated land Coast Ocean
PNPR v1/PNPR v2 PNPR v1/PNPR v2 PNPR v1/PNPR v2 PNPR v1/PNPR v2
BIAS (mm h−1) 0.30/−0.05 −0.09/−0.08 0.15/0.05 0.63/0.05 CC 0.66/0.64 0.68/0.71 0.75/0.65 0.60/0.69 RMSE (mm h−1) 1.84/0.80 1.66/1.11 1.73/1.37 2.25/1.30
rain rates < 2 mm h−1and better performance of PNPR v1 for rain rates between 2 and 6 mm h−1.
Over land, PNPR v2 shows lower AFSE% compared
to PNPR v1 for mid- to high rainfall rates (> 2 mm h−1),
while for lower rain rates the two curves are similar, with slightly better results for PNPR v2 for very low rain rates (< 0.5 mm h−1)and for PNPR v1 for rain rates between 0.5 and 2 mm h−1. It should be noted that overall this compari-son shows a general agreement in the capability to estimate the precipitation by the two algorithms (as expected since they are based on the same physical foundation) with better performance of the ATMS version of PNPR for low precip-itation rates, in particular over ocean (both in terms of RB%
and AFSE%). For higher precipitation rates both PNPR
ver-sions tend to underestimate the precipitation (negative RB%),
with larger (negative) bias of PNPR v2 than PNPR v1 over land.
It is worth noting that the main improvement of PNPR v2 with respect to PNPR v1 is the reduction of the relative bias (RB%)for low precipitation rates (where RB% was higher)
especially over ocean. Moreover, considering the AFSE%,
the error is generally lower in version 2 even if the effect of the bias reduction is not taken into account.
5 Summary and conclusion
This paper describes the design of a new algorithm, PNPR v2, for estimation of precipitation on the ground for the cross-track ATMS radiometer and presents the results of a verification study where the instantaneous precipitation rate estimates available from TRMM and GPM spaceborne radars are used as reference.
PNPR v2 has been designed for retrieval of precipitation in the MSG full disk area. The algorithm, based on a neural network approach, represents an evolution of the previous version PNPR v1, designed for the AMSU/MHS radiome-ter, with some changes made to take advantage of the im-provements of ATMS with respect to AMSU/MHS. Simi-larly to the previous algorithm it is based on a single neural network for all types of surface background, trained using a large database based on 94 cloud-resolving model simula-tions over the European and the African areas.
The verification study carried out through a compar-ison with co-located observations of ATMS with the NASA/JAXA TRMM-PR and GPM-KuPR spaceborne
radars analyzed on a 0.5◦×0.5◦regular grid showed a sub-stantial agreement of PNPR v2 with the precipitation prod-ucts available from the two radars. In the comparison with TRMM-PR, over the African area the CC has values between 0.64 (arid land) and 0.71 (vegetated land), and RMSE varies between 0.80 mm h−1(arid land) and 1.37 mm h−1 (coast). The AFSE%, as a function of PR precipitation rate, ranges
from 250 to 130 % over ocean and from 250 to 100 % over land in the interval from 0.1 to 1 mm h−1. It is less than 50 % for rain rate greater than 7 mm h−1 (ocean and land). In the comparison with GPM-KuPR over the European area the indexes are quite comparable with those over the African area, with lower correlation (0.59 over vegetated land and 0.57 over ocean) and RMSE (0.82 mm h−1 over vegetated land and 0.71 mm h−1over ocean). It is worth noting that the study based on GPM-KuPR will be further developed in the future using a larger coincidence dataset and a more consoli-dated version of DPR precipitation products. It should also be noted that the results presented in this study may be affected by the low sensitivity of spaceborne precipitation radars to light precipitation. This aspect will be further investigated through validation procedures based on ground radars and rain gauges (i.e., Puca et al., 2014), and further studies and dedicated activities are foreseen on these important aspects within the ongoing scientific collaboration between the EU-METSAT H-SAF and the NASA/JAXA PMM Research Pro-gram.
(GPROF) algorithm version developed for cross-track PMW sensors (MHS). Using quality-controlled ground-based radar data over the United States from 6 March 2014 through 5 March 2015, and computing the statistical scores (at the native – 15.88 km×15.88 km – retrieval resolution) over a 1◦×1◦ grid, they have found CC < 0.50 over the western USA and > 0.60 over the eastern USA. It is worth noting that a comparison of the measured performances of different algorithms is very difficult and may not be significant if the conditions in which the various studies are performed are dif-ferent (e.g., for the type and the quality of the reference data, different climate regimes, different matching procedure, and spatial resolution used in the analysis). Therefore, what can emerge from such results is that PNPR v2 performance is at least comparable with those of the analyzed algorithms.
In the comparison of PNPR v2 and PNPR v1 retrievals, performed over the African area and based on a 2-year pe-riod of coincident observations of ATMS and AMSU/MHS radiometers with TRMM-PR, an appreciably better perfor-mance of PNPR v2 has been evidenced by statistical indexes (e.g., CC equal to 0.71 for PNPR v2, vs. 0.68 for PNPR v1 over vegetated land, and equal to 0.69 for PNPR v2, vs. 0.61 for PNPR v1 over ocean) and by a general improvement of the estimate of low precipitation, mostly over ocean. The re-sulting differences can likely be attributed to improvements in the design of the neural network and also to the best tech-nical features of ATMS compared to AMSU/MHS.
Overall, the two versions of PNPR algorithm have shown a general consistency in the results, as expected considering that both are based on the same physical basis (the train-ing databases are based on the same cloud-resolvtrain-ing model and to the same radiative transfer model). It is worth not-ing that the achievement of consistency between products derived from different sensors is very relevant in the cur-rent GPM mission era, with constellation satellites (equipped with cross-track or conical scanning microwave radiometers) contributing to global coverage and higher temporal sam-pling of precipitation. This aspect has become very important also within the EUMETSAT H-SAF program and represents a guideline for the development of PMW precipitation prod-ucts. PNPR v2 and PNPR v1 for ATMS and AMSU/MHS, as well as other products for conically scanning radiome-ters (e.g., CDRD for SSMIS – Casella et al., 2013, Sanò et al., 2013), and new products for the other constellation ra-diometers are developed within H-SAF in this direction, with foreseen improvements of derived MW/IR products used in operational hydrology and near-real-time precipitation mon-itoring applications.
The results, however, have revealed a slight tendency of PNPR v2 to underestimate moderate to high precipitation, mostly over land, and overestimate moderate to light precip-itation over the ocean, especially compared to GPM-KuPR product over the North Atlantic Ocean. Besides well-known issues affecting PMW precipitation retrieval, such as non-uniform beam-filling effects related to small-scale rainfall
structures associated with local convection and difficulties in the retrieval of warm or shallow rain processes, in addition to the lack of low-frequency channels very useful for precipita-tion retrieval over ocean, other issues might be related to the use of spaceborne radar products as reference. The impact of sample volume discrepancies between radiometers and spaceborne radars, and uncertainties in the spaceborne radar estimates (due to attenuation correction, sensitivity thresh-olds, non-uniform beam-filling effect), needs to be evaluated when using spaceborne radar precipitation estimates as ref-erence. PNPR v2 will undergo thorough extensive validation within the EUMETSAT H-SAF program carried out by the H-SAF Precipitation Products Validation Service (Puca et al., 2014), using ground-based radars and rain gauges over Eu-rope and, in limited areas, over Africa, which will be useful to clarify some of these issues.
In spite of the above mentioned limitations, this study shows that the TRMM and GPM spaceborne radars can be very useful for an extensive verification, over long time peri-ods, of consistency and accuracy of instantaneous precipita-tion rate estimates from different sensors. The use of space-borne radars as reference overcomes some of the limita-tions in the use of ground-based data (such as inhomogeneity in their technical characteristics and data treatment, limited coverage, and beam blocking), providing consistent mea-surements around the globe, including remote areas where ground-based data are scarce or not available and oceans.
6 Data availability
The data used in the research concerning the ATMS radiometer brightness temperature are provided by the Na-tional Oceanic and Atmospheric Administration (NOAA), Comprehensive Large Array-data Stewardship System (CLASS), and are available at http://www.nsof.class. noaa.gov/saa/products/search?sub_id=0&datatype_family= ATMS_SDR&submit.x=15&submit.y=8 (NOAA, 2016). The data concerning the TRMM-PR and GPMKuPR radar measurements are provided by the National Aeronautics and Space Administration (NASA) and are available at https: //storm-pps.gsfc.nasa.gov/, ftp://pps.gsfc.nasa.gov/pub/, and ftp://arthurhou.pps.eosdis.nasa.gov (NASA, 2016). Data ac-cess is available to all users via a simple pre-registration pro-cedure(https://registration.pps.eosdis.nasa.gov/registration/).
research was supported by EUMETSAT through the “Satellite Application Facility on Support to Operational Hydrology and Water Management” (H-SAF), by the Earth2Observe FP7 EU funded project, and by the Italian Civil Protection Department. This research has been carried out within the collaboration between H-SAF and GPM (no-cost proposal approved by the NASA PMM Research Program) on the development of precipitation retrieval algorithms and validation activity.
Edited by: T. Islam
Reviewed by: two anonymous referees
References
Aires, F., Aznay, O., Prigent, C., Paul, M., and Bernardo F.: Syner-gistic multi-wavelength remote sensing versus a posteriori com-bination of retrieved products: Application for the retrieval of atmospheric profiles using MetOp-A, J. Geophys. Res., 117, D18304, doi:10.1029/2011JD017188, 2012.
Anders, U. and Korn, O.: Model selection in neural networks, Neu-ral Networks, 12, 309–323, 1999.
Bellerby, T., Todd, M., Kniveton, D., and Kidd, C.,: Rainfall Estimation from a Combination of TRMM Precipitation Radar and GOES Multispectral Satellite Imagery through the Use of an Artificial Neural Network, J. Appl. Meteorol., 39, 2115–2128, doi:10.1175/1520-0450(2001)040<2115:REFACO>2.0.CO;2, 2000.
Bellerby, T. J.: Satellite rainfall uncertainty estimation using an artificial neural network, J. Hydrometeorol., 8, 1397–1412, doi:10.1175/2007JHM846.1, 2007.
Bennartz, R. and Bauer, P.: Sensitivity of microwave radiances at 85-183 GHz to precipitating ice particles, Radio Sci., 38, 8075, doi:10.1029/2002RS002626, 2003.
Bennartz, R. and Petty, G. W.: The sensitivity of microwave re-mote sensing observations of precipitation to ice particle size dis-tributions, J. Appl. Meteorol., 40, 345–364, doi:10.1175/1520-0450(2001)040<0345:TSOMRS>2.0.CO;2, 2001.
Blackwell, W. J. and Chen, F. W.: Neural network applications in high-resolution atmospheric remote sensing, Lincoln Lab. J., 15, 299–322, 2005.
Boukabara, S.-A., Garrett, K., and Blackwell, B.: ATMS Descrip-tion & Expected Performances, Post-EPS User ConsultaDescrip-tion Workshop, Darmstadt, Germany, 29–30 September 2011. Boukabara, S.-A., Garrett, K., Grassotti, C., Iturbide-Sanchez, F.,
Chen, W., Jiang, Z., Clough, S. A., Zhan, X., Liang, P., Liu, Q,. Islam, T., Zubko, V., and Mims, A.: A physical approach for a simultaneous retrieval of sounding, surface, hydrometeor, and cryospheric parameters from SNPP/ATMS, J. Geophys. Res.-Atmos., 118, 12600–12619, doi:10.1002/2013JD020448, 2013. Burns, B. A., Wu, X., and Diak, G. R.: Effects of
precipi-tation and cloud ice on brightness temperatures in AMSU moisture channels, IEEE T. Geosci. Remote, 35, 1429–1437, doi:10.1109/36.649797, 1997.
Casella, D., Panegrossi, G., Sanò, P., Mugnai, A., Smith, E. A., Tripoli, G. J., Dietrich, S., Formenton, M., Leung, W. Y., and Mehta, A.: Transitioning from CRD to CDRD in bayesian re-trieval of rainfall from satellite passive microwave measure-ments: Part 2. Overcoming database profile selection
ambigu-ity by consideration of meteorological control on microphysics, IEEE T. Geosci. Remote, 51, 4650–4671, 2013.
Casella, D., Panegrossi, G., Sanò, P., Milani, L., Petracca, M., and Dietrich, S.: A novel algorithm for detection of precipitation in tropical regions using PMW radiometers, Atmos. Meas. Tech., 8, 1217–1232, doi:10.5194/amt-8-1217-2015, 2015.
Chandrasekar, V., Le, M., and Awaka, J.: Vertical profile classifica-tion algorithm for GPM, Int. Geosci. Remote Se., IGARSS 2014, 3458–3761, doi:10.1109/IGARSS.2014.6947301, 2014. Chen, F. W. and Staelin, D. H.: AIRS/AMSU/HSB
precip-itation estimates, IEEE T. Geosci. Remote, 41, 410–417, doi:10.1109/TGRS.2002.808322, 2003.
Chen, F. W., Bickmeier, L. J., Blackwell, W. J., Jairam, L. G., and Leslie, V. R.: Neural network retrieval of precipitation using NPOESS microwave sensors, Int. Geosci. Remote Se., IGARSS 2007, 2272–2275, doi:10.1109/IGARSS.2007.4423294, 2007. Chen, Y., Aires, F., Francis, J. A., and Miller, J. R.: Observed
re-lationships between artic longwave cloud forcing and cloud pa-rameters using a neural network, J. Climate, 4087–4104, 2006. Coulibaly, P., Dibike, Y. B., and Anctil, F.: Downscaling
Precipi-tation and Temperature with Temporal Neural Networks, J. Hy-drometeorol., 6, 483–496, doi:10.1175/JHM409.1, 2005. Del Frate, F. and Schiavon, G.: Nonlinear principal component
anal-ysis for the radiometric inversion of atmospheric profiles by us-ing neural networks, IEEE T. Geosci. Remote, 37, 2335–2342, doi:10.1109/36.789630, 1999.
Draper, D., Newell, D., Wentz, F., Krimchansky, S., and Skofronick-Jackson, G.: The Global Precipitation Measurement (GPM) Mi-crowave Imager (GMI): Instrument Overview and Early On-Orbit Performance, IEEE J. Sel. Top. Appl., 8, 3452–3462, doi:10.1109/JSTARS.2015.2403303, 2015.
Ferraro, R. R. and Marks, G. F.: The development of SSM/I rain-rate retrieval algorithms using ground-based radar measure-ments, J. Atmos. Ocean. Tech., 12, 755–770, doi:10.1175/1520-0426(1995)012<0755:TDOSRR>2.0.CO;2, 1995.
Ferraro, R. R.: The Status of the NOAA/NESDIS Operational AMSU Precipitation Algorithm, 2nd Workshop of the Interna-tional Precipitation Working Group, Monterey, 9 pp., 2004. Ferraro, R. R., Weng, F., Grody, N. C., Zhao, L., Meng, H.,
Kon-goli, C., Pellegrino, P., Qiu, S., and Dean, C.: NOAA oper-ational hydrological products derived from the advanced mi-crowave sounding unit, IEEE T. Geosci. Remote, 43 1036–1049, 2005.
Funatsu, B. M., Claud, C., and Chaboureau, J.-P.: Potential of Advanced Microwave Sounding Unit to identify precipitating systems and associated upper-level features in the Mediter-ranean region: Case studies, J. Geophys. Res., 112, D17113, doi:10.1029/2006JD008297, 2007.
Funatsu, B. M., Claud, C., and Chaboureau, J.-P.: Comparison be-tween the large-scale environments of moderate and intense pre-cipitating systems in the Mediterranean region, Mon. Weather Rev., 137, 3933–3959, doi:10.1175/2009MWR2922.1, 2009. Goldberg, M. D., Kilcoyne, H., Cikanek, H., and Mehta, A.: Joint
Polar Satellite System: The United States next generation civilian polar-orbiting environmental satellite system, J. Geophys. Res.-Atmos., 118, 13463–13475, doi:10.1002/2013JD020389, 2013. Grody, N. C.: Classification of snow cover and precipitation
Hall, T., Brooks, H. E., and Doswell III, C. A.: Precipitation fore-casting using a neural network, Weather Forecast., 14, 338–345, doi:10.1175/1520-0434(1999)014<0338:PFUANN>2.0.CO;2, 1999.
Hamada, A. and Takayabu, Y. N.: Improvements in Detection of Light Precipitation with the Global Precipitation Measurement Dual-Frequency Precipitation Radar (GPM/DPR), J. Atmos. Ocean. Tech., 33, 653–667, doi:10.1175/JTECH-D-15-0097.1, 2016.
Haupt, S. E., Pasini, A., and Marzban, C.: Artificial Intelligence Methods in the Environmental Sciences, Springer, ISBN 978-1-4020-9117-9 (HB), 2009.
Heymsfield, G. M., Geerts, B., and Tian, L.: TRMM Pre-cipitation Radar Reflectivity Profiles as Compared with High-Resolution Airborne and Ground-Based Radar Measure-ments, J. Appl. Meteorol., 39, 2080–2102, doi:10.1175/1520-0450(2001)040<2080:TPRRPA>2.0.CO;2, 2000.
Hirose, M., Shimizu, S., Oki, R., Iguchi, T., Short, D. A., and Nakamura, K.: Incidence-Angle Dependency of TRMM PR Rain Estimates, J. Atmos. Ocean. Tech., 29, 192–206, doi:10.1175/JTECH-D-11-00067.1, 2012.
Hong, G., Heygster, G., Miao, J., and Kunzl, K.: Detection of tropical deep convective clouds from AMSU-B vater va-por channels measurements, J. Geophys. Res., 110, D05205, doi:10.1029/2004JD004949, 2005.
Hong, Y., Hsu, K.-L., Sorooshian, S., and Gao, X.: Precipitation estimation from remotely sensed imagery using an artificial neu-ral network cloud classification system, J. Appl. Meteorol., 43, 1834–1853, 2004.
Hong, G., Heygster, G., Notholt, J., and Buehler, S. A.: Interan-nual to Diurnal Variations in Tropical and Subtropical Deep Convective Clouds and Convective Overshooting from Seven Years of AMSU-B Measurements, J. Climate, 21, 4168–4189, doi:10.1175/2008JCLI1911.1, 2008.
Hou, A. Y., Kakar, R. K., Neeck, S., Azarbarzin, A. A., Kum-merow, C. D., Kojima, M., Oki, R., Nakamura, K., and Iguchi, T.: The global precipitation measurement mission, B. Am. Meteorol. Soc., 95, 701–722, doi:10.1175/BAMS-D-13-00164.1, 2014. Hsu, K.-L., Gao, X., Sorooshian, S., and Gupta, H. V.:
Precip-itation estimation from remotely sensed information using artificial neural networks, J. Appl. Meteorol., 36, 1176–1190, doi:10.1175/1520-0450(1997)036<1176:PEFRSI>2.0.CO;2, 1997.
Huffman, G. J., Bolvin, D. T., Nelkin, E. J., Wolff, D. B., Adler, R. F., Gu, G., Hong, Y., Bowman, K. P., and Stocker, E. F.: The TRMM Multisatellite Precipitation Analy-sis (TMPA): Quasi-Global, Multiyear, Combined-Sensor Precip-itation Estimates at Fine Scales, J. Hydrometeorol., 8, 38–55, doi:10.1175/JHM560.1, 2007.
Huffman, G. J., Bolvin, D. T., Braithwaite, D., Hsu, K., Joyce, R., Kidd, C., Nelkin, E. J., and Pingping, X.: NASA Global Precipitation Measurement (GPM) Integrated Multi-satellitE Retrievals for GPM (IMERG), ATBD v. 4.5, NASA, avail-able at: http://pmm.nasa.gov/sites/default/files/document_files/ IMERG_ATBD_V4.5.pdf (last access: 1 November 2016), 66 pp., 2015.
Iguchi, T., Kozu, T., Meneghini, R., Awaka, J., and Okamoto, K.: Rain-Profiling Algorithm for the TRMM Precipitation
Radar, J. Appl. Meteorol., 39, 2038–2052, doi:10.1175/1520-0450(2001)040<2038:RPAFTT>2.0.CO;2, 2000.
Iguchi, T., Kozu, T., Kwiatkowski, J., Meneghini, R., Awaka, J., and Okamoto, K.: Uncertainties in the Rain Profiling Algorithm for the TRMM Precipitation Radar, J. Meteorol. Soc. Jpn., 87A, 1– 30, doi:10.2151/jmsj.87A.1, 2009.
Iturbide-Sanchez, F., Boukabara, S.-A., Chen, R., Garrett, K., Grassotti, C., Chen, W., and Weng, F.: Assessment of a Vari-ational Inversion System for Rainfall Rate Over Land and Water Surfaces, IEEE T. Geosci. Remote, 49, 3311–3333, doi:10.1109/TGRS.2011.2119375, 2011.
Kidd, C.: On rainfall retrieval using polarization-corrected temperatures, Int. J. Remote Sens., 19, 981–996, doi:10.1080/014311698215829, 1998.
Kidd, C., Matsui, T., Chern, J., Mohr, K., Kummerow, C., and Ran-del, D.: Global Precipitation Estimates from Cross-Track Pas-sive Microwave Observations Using a Physically Based Retrieval Scheme, J. Hydrometeorol., 17, 383–400, doi:10.1175/JHM-D-15-0051.1, 2016.
Kirstetter, P. E., Hong, Y., Gourley, J. J., Chen, S., Flamig, Z., Zhang, J., Schwaller, M., Petersen, W., and Amitai, E.: To-ward a Framework for Systematic Error Modeling of Space-borne Precipitation Radar with NOAA/NSSL Ground Radar– Based National Mosaic QPE, J. Hydrometeorol., 13, 1285–1300, doi:10.1175/JHM-D-11-0139.1, 2012.
Kirstetter, P.-E., Viltard, N., and Gosset, M.: An error model for instantaneous satellite rainfall estimates: evaluation of BRAIN-TMI over West Africa, Q. J. Roy. Meteor. Soc., 139, 894–911, doi:10.1002/qj.1964, 2013.
Kongoli, C., Meng, H., Dong, J., and Ferraro, R.: A snowfall de-tection algorithm over land utilizing high-frequency passive mi-crowave measurements – Application to ATMS. J. Geophys. Res.-Atmos., 120, 1918–1932, doi:10.1002/2014JD022427, 2015.
Krasnopolsky, V. M., Fox-Rabinovitz, M. S., and Belochitski, A. A.: Decadal climate simulations using accurate and fast neural network emulation of full, longwave and shortwave, radiation, Mon. Weather Rev., 3683–3695, doi:10.1175/2008MWR2385.1, 2008.
Kummerow, C. D., Ringerud, S., Crook, J., Randel, D., and Berg, W.: An Observationally Generated A Priori Database for Mi-crowave Rainfall Retrievals, J. Atmos. Ocean. Tech., 28, 113– 130, doi:10.1175/2010JTECHA1468.1, 2011.
Kummerow, C. D., Randel, D. L., Kulie, M., Wang, N.-Y., Ferraro, R., Munchak, S. J., and Petkovic, V.: The Evolution of the God-dard Profiling Algorithm to a Fully Parametric Scheme, J. At-mos. Ocean. Tech., 32, 2265–2280, doi:10.1175/JTECH-D-15-0039.1, 2015.
Laviola, S. and Levizzani, V.: The 183-WLS fast rain rate retrieval algorithm. Part I: Retrieval design, Atmos. Res., 99, 443–461, doi:10.1016/j.atmosres.2010.11.013, 2011.
Le, M. and Chandrasekar, V.: Hydrometeor Profile Character-ization Method for Dual-Frequency Precipitation Radar On-board the GPM, IEEE T. Geosci. Remote, 51, 3648–3658, doi:10.1109/TGRS.2012.2224352, 2013a.