www.atmos-meas-tech.net/9/9/2016/ doi:10.5194/amt-9-9-2016
© Author(s) 2016. CC Attribution 3.0 License.
The microwave properties of simulated melting precipitation
particles: sensitivity to initial melting
B. T. Johnson1,2, W. S. Olson1,2, and G. Skofronick-Jackson2
1University of Maryland Baltimore County, Joint Center for Earth Systems Technology, Baltimore, MD, USA 2NASA Goddard Space Flight Center, Code 612, Greenbelt, MD, USA
Correspondence to: B. T. Johnson ([email protected])
Received: 16 April 2015 – Published in Atmos. Meas. Tech. Discuss.: 5 June 2015
Revised: 17 November 2015 – Accepted: 25 November 2015 – Published: 15 January 2016
Abstract. A simplified approach is presented for assessing the microwave response to the initial melting of realistically shaped ice particles. This paper is divided into two parts: (1) a description of the Single Particle Melting Model (SPMM), a heuristic melting simulation for ice-phase precipitation par-ticles of any shape or size (SPMM is applied to two simu-lated aggregate snow particles, simulating melting up to 0.15 melt fraction by mass), and (2) the computation of the single-particle microwave scattering and extinction properties of these hydrometeors, using the discrete dipole approximation (via DDSCAT), at the following selected frequencies: 13.4, 35.6, and 94.0 GHz for radar applications and 89, 165.0, and 183.31 GHz for radiometer applications. These selected frequencies are consistent with current microwave remote-sensing platforms, such as CloudSat and the Global Precipi-tation Measurement (GPM) mission. Comparisons with cal-culations using variable-density spheres indicate significant deviations in scattering and extinction properties throughout the initial range of melting (liquid volume fractions less than 0.15). Integration of the single-particle properties over an exponential particle size distribution provides additional in-sight into idealized radar reflectivity and passive microwave brightness temperature sensitivity to variations in size/mass, shape, melt fraction, and particle orientation.
1 Introduction
Present methods of passive and active microwave remote sensing of precipitation have a key problem: the uncertainty of the physical and associated radiative properties of ice-and mixed-phase snowflakes. In nature, ice particles
mani-fest themselves in an extraordinarily diverse variety of sizes, shapes, and habits – ranging from simple crystals such as needles or plates to complex aggregates and rimed particles. Microwave radiation is sensitive to the presence of liq-uid water on ice-phase precipitation (e.g., Klassen, 1988), due, primarily, to the large difference in the dielectric con-stants of the two materials at microwave frequencies. How-ever, the relationship between the early stages of melting and incident microwave radiation has not been well described in the literature. With this in mind, the present research seeks to quantify the sensitivity of microwave scattering and ex-tinction cross sections to the onset of melting (melt fractions less than 0.15), with an emphasis on ultimately improving the forward-model simulation of the physical and radiative properties of realistically shaped mixed-phase precipitation particles. The onset of melting is generally believed to repre-sent the most rapid changes in the scattering and extinction properties of hydrometeors. Bohren and Battan (1982) made direct measurements and simulation of a normalized radar backscattering cross section for spongy ice spheres with var-ious liquid water contents. Most notable is that they show a a rapid change in the backscattering cross section between 0 and about 7 % liquid water volume fraction. Willis and Heymsfield (1989) also noted that the onset of melting rep-resents a critical point where the radar reflectivity increases rapidly. A comprehensive examination of the microwave sen-sitivity to the entire range of melting is left for future re-search.
arbitrary shape. By using simple rules and nearest-neighbor interactions, the melting process is simulated with a reason-able facsimile of reality. In SPMM, there are no explicit thermodynamic or physical properties, other than the 3-D shape and the relative positions of liquid and ice constituents. SPMM is an extremely computationally efficient algorithm for creating a series of melted particles ranging from un-melted to completely un-melted, only requiring several minutes on a normal desktop computer for a single particle. Thermo-dynamic melting-layer models can easily be employed to de-termine bulk meltwater generation (Mitra et al., 1990; Olson et al., 2001), and the SPMM-melted particles can be mapped into an appropriate particle size distribution according to the layer-averaged melting properties.
While the general physical properties and thermodynam-ics of melting snowflakes are fairly well understood, the complex interaction between realistically shaped melting snowflake aggregates and incident microwave radiation has been sparsely examined. Recently, radar properties of melt-ing aggregates at 3.0 and 35.6 GHz have been simulated by Botta et al. (2010). There are no known simulations of realistically shaped melting aggregate hydrometeors at fre-quencies above 35.6 GHz, for either passive or active mi-crowave remote-sensing applications. For dry realistically shaped aggregates, Petty and Huang (2010) compared sim-ulated reflectivities from aggregates and soft spheres at Ku, Ka, and the passive microwave response 18.7, 36.5, and 89.0 GHz, and Kulie et al. (2014) has examined the Ku-, Ka-, and W-band (14Ka-, 35Ka-, and 94 GHz) response to variations in shape and size, but neither paper consider melting.
In this study, the discrete dipole approximation (DDA), using DDSCAT (Discrete Dipole Scattering) version 7.3 (Draine and Flatau, 1994), is employed to compute the scattering and extinction efficiencies of individual particles with mass Ftmelt fractions ranging from from 0.0 (unmelted) to 0.15 (lightly melted). Due to the significant computational requirements of DDSCAT when liquid water is present, we have limited this study to two selected aggregate particles, shown in Fig. 1. The chosen microwave frequencies – 13.4, 35.6, 89.0, 94.0, 165.0, and 183.31 GHz – are relevant to cur-rent passive and active microwave sensors, such as Cloud-Sat (Stephens et al., 2002), the recently launched Global Pre-cipitation Measurement mission (GPM; Hou et al., 2014), and instrumentation employed during aircraft- and ground-based precipitation validation experiments over the past decade (e.g., MC3E – Petersen and Jensen, 2012; GCPEx – Hudak et al., 2012; and IPHEx – Barros, 2014) and the up-coming OLYMPEx field campaign in winter 2015/16 (Mc-Murdie et al., 2015).
The following sections describe the melting simulation methodology, the single-particle scattering and extinction properties at standard radar and radiometer center frequen-cies, and the particle size distribution averaged properties with implications for remote-sensing applications.
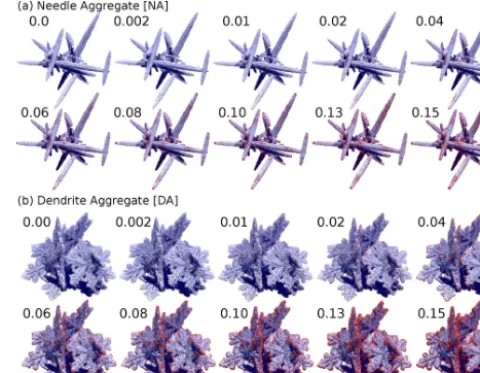
Figure 1. Selected steps in the onset of melting for (a) needle
ag-gregate (NA) and (b) dendrite agag-gregate (DA). Blue regions are ice, and red regions are liquid water; mass fraction of meltwater is indi-cated at each step. Particle mass is conserved throughout the melting process.
2 Physical description of melting
In an actual melting snowflake, the distribution of water on the surface of a melting ice crystal is governed primarily by the local amount of liquid water. According to Oraltay and Hallett (2005), in the initial stages of melting, meltwa-ter distributes more or less evenly over the surface of the ice crystal. At a locally critical liquid water content, surface tension effects take over and convex water droplets form at branch points and other energetically favorable regions on the surface of the underlying ice crystal. As the crystal shape changes due to additional melting, these water droplets co-agulate and tend to collect toward a common center under the influence of surface tension. Previous studies have exam-ined the effects of modifying the distribution of meltwater on oblate spheroids (Tyynelä et al., 2014), and one has explicitly examined melting realistically shaped snowflakes, but with ad hoc placement of water spheres to simulate melting (Botta et al., 2010). In reality, tumbling, breakup, shedding, colli-sion/aggregation, evaporation/condensation, and other phys-ical interactions often significantly alter growth and melting processes. Due to the complexities of such simulations, we do not explicitly consider these effects in the present phys-ical model – although aggregation is simulated through the creation of aggregate snowflakes.
2.1 Single Particle Melting Model
unit of mass of either ice or liquid. This assemblage of ice and water points constitutes the particle mass and volume; Fig. 1 illustrates this for the two selected aggregate shapes used in this study. In this figure, blue regions represent solid ice and red regions represent meltwater (red is used for visual clarity). The maximum melt fraction is 0.15 for the present study, in order to assess the microwave sensitivity to the ini-tial stages of melting. Throughout this melting range, casual inspection reveals that very little structural changes occur in either the dendrite aggregate (DA) or needle aggregate (NA). The basis for melting and meltwater movement in SPMM occurs through nearest-neighbor interactions. In a 3-D do-main, any given point has 26 nearest neighbors (including all diagonals). The interaction distance is limited to one neigh-bor, simplifying the computational requirements of the al-gorithm. Figure 2 conceptually illustrates the melting pro-cess in two dimensions; the same logic applies to the three-dimensional model. The melting simulation proceeds itera-tively until all ice is melted and a nearly spherical droplet is formed.
The SPMM proceeds with the following steps:
1. Populate a 3-D Cartesian grid with “ice” points, the en-semble of which comprise the entire volume of the sim-ulated snowflake or aggregate.
2. Iterate over all ice points, tabulating all 26 nearest neighbors (6 sides, 23 diagonals, excluding self). 3. The ice points having the fewest ice neighbors are
melted (see Fig. 2a). A stochastic control factor is em-ployed to control the rate of melting.
4. After each melt iteration, a movement check is applied to those liquid points having zero ice neighbors. Pro-hibiting the movement of liquid points that do have ice neighbors simulates a “coating” effect, whereas liquid points with no ice neighbors are able to move (Fig. 2b and c).
5. Movement is a weighted random walk, subject to certain constraints. The walk is weighted toward total particle center of mass, simulating the coalescence of liquid wa-ter. The movement phase iterates until all moving liquid cannot move to an open space closer to the center of mass than the current position. Return to step 2. In this simple model, ice structure collapse, breakup, or water shedding are not explicitly simulated – any orphaned droplets created during melting will naturally migrate to-wards the total center of mass as cohesive droplets.
Although the present study considers melt fractions up to 0.15, SPMM provides melting simulations for any arbitrary particle shape until it is completely melted. In principle, it can be applied to the melting of any material, where surface tension is a dominant factor in the liquid phase. The melting increments and distribution of meltwater can be finely tuned
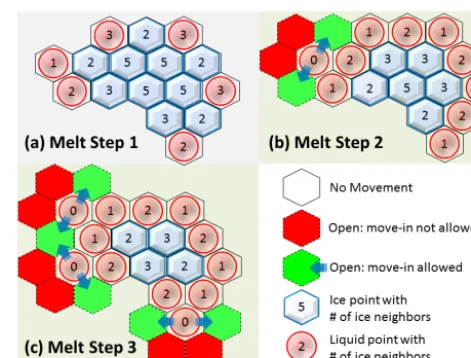
Figure 2. A simplified diagram depicting the steps in the SPMM.
At each step, ice (blue) points are converted to liquid (red) follow-ing nearest-neighbor rules (see text). Numbers depict the number of nearest ice neighbors. Panel (a) indicates the first iteration of the melting algorithm; (b) shows the second iteration and the allowable move conditions; and (c) shows the third iteration, where more ice has melted and three points are now free to move into the green regions.
to suit the application. On a modern desktop computer, a par-ticle having 200 000 ice points (“dipoles” in DDA parlance) can complete the entire melting process in less than 5 min us-ing a sus-ingle processor core. The Fortran 90 codes and MAT-LAB codes for SPMM are freely and indefinitely available upon request from the primary author.
3 Single-particle scattering and extinction properties
In the previous section we described the method for simu-lating the melting of realistically shaped precipitation hy-drometeors using SPMM. Given these two example sets of melted ice particles, the single-particle extinction cross sec-tion, backscattering cross secsec-tion, and asymmetry parameter properties were computed at 23 melting steps between 0.0 (unmelted) and 0.15 (lightly melted; see Fig. 1). To com-pute the single-particle radiative properties, the DDSCAT 7.3 model is used (Draine and Flatau, 1994).
3.1 Numerical scattering calculations
liq-uid water (Liebe et al., 1991),k is the wave number of the incident radiation, and d is the minimum spacing between adjacent dipoles. In each of the following calculations, spe-cific care was taken to ensure that this convergence criterion was adequately satisfied. In practice this was accomplished by having a sufficiently large number of dipoles representing the shapes, minimizing the dipole spacing d compensating for the increase in|m|imposed by the increasing amount of liquid water present in the melting simulation.
DDSCAT requires the following inputs: the polarization and wavelength of incident radiation, the 3-D Cartesian po-sition and index of refraction for each dipole point, the effec-tive radius of the entire particle (aeff: the radius of a sphere having equal mass), and 3-D rotation angles of the target in the reference frame. Here, the effective radius (aeff) acts as a proxy for particle mass, independent of the particle shape.
The outputs of interest for this study are extinction cross section, scattering asymmetry parameter, and radar backscat-tering cross section at 30 effective radius intervals – ranging in log scale from 50 microns to 2500 microns. For each effec-tive radius value, the input shape (relaeffec-tive dipole positions) remain the same, but each dipole mass (and consequently effective volume) is scaled appropriately. We also examine the extinction and backscattering efficiencies,QextandQbck, which are simply the respective cross sections (e.g.,Cext) di-vided by the cross-sectional area of the equivalent sphere (de-fined in DDSCAT byQ∗=C∗/π a2eff).
It should be noted that scaling particles in this manner does not create a mass–dimension relationship that is consistent with observations when these particles are used together in an ensemble. Each particle and its associated scattering and extinction properties are intended to be considered as inde-pendent particles if they are being used in an actual retrieval framework, and it is up to the researcher to ensure that the mass–dimension relationship they prefer to use is followed. Leinonen and Moissev (2015) found that the method of pro-ducing aggregates can result in significantly different optical properties, depending on the ultimate mass–dimension rela-tionship. in the present study, the purpose of choosing the shape-preserving scaling approach was so that the the melt-ing morphology would be preserved for a given base shape across all ranges of masses, enabling a consistent comparison independent of shape changes.
To simulate randomly oriented hydrometeors, an average over multiple orientations of the aggregate relative to a fixed direction of incident radiation is computed. This provides an orientation-averaged set of scattering and extinction proper-ties. Although not shown here, our sensitivity studies suggest that 75 discrete orientations, sampling a full 3-D rotation, are sufficient to provide a reasonably precise orientationally averaged set of scattering and extinction calculations. This trade-off keeps the computational requirements tractable: for a single effective radius, single shape, and single frequency, it requires 24 h to perform one set of calculations running in a parallel implementation a 24-core Intel(R) Xeon(R) CPU
X5670 at 2.93 GHz and requires up to 32 GB of allocated RAM per DDSCAT process. For 6 frequencies, 2 shapes, and 30 effective radii, it requires computation times on the order of 200 days of continuous calculations (with 3 processes run-ning in parallel). In addition the orientation-averaged quanti-ties, the scattering and extinction properties are also tabulated for each individual orientation, which has important implica-tions for exploring the polarization of scattered radiation, but this is left for future research.
In the current study, the single particle scattering and ex-tinction calculations are divided into two frequency groups:
1. Radar-specific frequencies, approximately consistent with the Global Precipitation Measurement mission Dual-Wavelength Precipitation Radar (GPM DPR) at Ku-band and Ka-band (13.4 and 35.6 GHz), and with the CloudSat W band radar (94.0 GHz). Several ground-based and aircraft-ground-based instruments also use these channels for precipitation remote-sensing applications. 2. “High-frequency” passive microwave channels at 89,
165, and 183.31 GHz, consistent with the GPM Mi-crowave Imager (GMI) channels used for detecting scattering by ice clouds and ice-phase precipitation. Similar channels are used on other satellites, aircraft, and ground-based passive microwave instruments (e.g., SSMI/S, TRMM, CoSMIR) for cloud and precipitation remote sensing.
3.2 Backscattering and extinction at radar frequencies
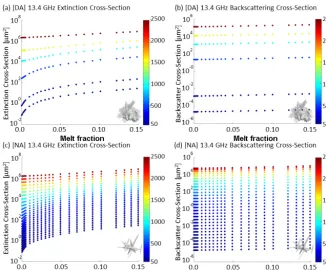
In Fig. 3, the 13.4 GHz extinction and radar backscattering cross sections are computed for the DA in panels (a) and (b) respectively, and for the NA panels (c) and (d). Colors represent the particle effective radius (values on the color bar are in microns), which is directly related to the particle mass. Both extinction and backscattering cross sections are most strongly influenced by changes in size. At the smaller sizes, however, the onset of melting has a strong influence on extinction (panels a and c). This indicates that the onset of melting is characterized by a rapid increase in extinction, while the backscattering tends to exhibit a more linear in-crease. This is consistent with the integrated backscattering and extinction properties, shown in Sect. 4.
Figure 3. Overview of 13.4 GHz extinction and backscattering: dendrite aggregate (row 1) (a) mean extinction cross section vs. melt fraction
and (b) mean backscattering cross section vs. melt fraction for various values of effective radius in microns (color bar). Needle aggregate (row 2) (c) mean extinction cross section vs. melt fraction and (d) mean backscattering cross section.
Figure 4. Single-particle DDSCAT calculations of the extinction coefficient (Qext) for the dendrite aggregate (DA) and needle aggregate (NA) at 50-micron effective radius. Shaded regions represent the range ofQextdue to various orientations of the particle relative to the direction of incident radiation. Black lines are the equivalent ice sphereQextvalues at 1, 10, 50, and 100 % densities (100 % is the bulk density of ice, 917 kg m−3). (a) 13.4, (b) 35.6, (c) 94.0 GHz – note different vertical axis ranges on each panel for optimal visualization.
different from the spherical properties and often outside of the range that could be captured by spherical particle shapes alone (e.g., Liao et al., 2013).
Figure 5 is the same as Fig. 4 except that the effective ra-dius has increased to 2500 microns. The behavior at (a) 13.4 and (b) 35.6 GHz shows a similar sensitivity to the onset of melting, but not quite as rapid as the smaller-particle case. Panel c (94 GHz) shows a relative insensitivity of extinction to onset of melting; in this case it is due to a trade-off between a rapidly decreasing scattering contribution and equally in-creasing absorption contribution to the total extinction. Also
of note in panel c is that the needle aggregate now shows an overall larger extinction than the dendrite aggregate, different from the other frequencies. This is indicative of the increased sensitivity of the smaller wavelength (approximately 3.2 mm at 94 GHz) to the finer-scale structures present in the nee-dle aggregate. We believe that this is the first evidence in the existing literature that points towards this behavior; however additional research will be required on this topic.
Figure 5. Same as Fig. 4 except effective radius is now 2500 microns (50-times-larger radius; 125 000-times-larger mass). As before, the
vertical axes are on different scales. Notice the swap at 94 GHz, where the needle aggregate exhibits a higher extinction than the dendrite aggregate.
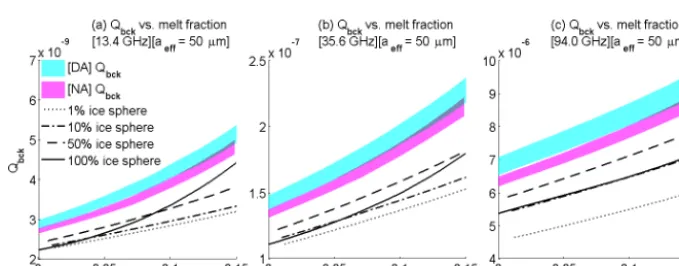
Figure 6. Similar to Fig. 4, the single-particle backscattering efficiency coefficient (Qbck) is shown for 50-micron effective radius. Both
ag-gregates show consistently larger backscattering efficiencies for the same mass as melt fractions compared to the spheres. Note the difference in the vertical axes on each panel.
byπ aeff2 (Bohren and Huffman, 1983). Integrating the single-particle backscattering cross section over a distribution of particle sizes yields the radar reflectivity, which is discussed in Sect. 4. Figure 6 is the backscattering efficiency for par-ticles of a 50-micron effective radius, whereas Fig. 7 is the same at 2500-micron effective radius.
At 50-micron effective radius, the scattering is well into the Rayleigh regime at all of the radar frequencies considered here. The response is a relatively gentle increase in backscat-tering over the 0 to 0.15 melt fraction range. The 94 GHz backscattering efficiency is roughly 3 orders of magnitude larger than the 13.4 GHz efficiency. Also of note is that the variable density spheres (black lines) consistently underes-timates the total radar backscattering for all densities com-pared to the two dendrites, implying that no modification of the density could reproduce the backscattering obtained by the non-spherical particles.
Figure 7 at 2500 microns shows a more complex relation-ship to melting and particle orientation. The backscattering efficiency exhibits a large variance due to particle orientation (the shaded regions) in all panels. The spheres at 13.4 GHz encompass the range of variability and exhibit a general
in-crease in backscattering with melting. However this breaks down at 35.6 and 94 GHz, where the Mie resonance effects start to have a stronger influence on the computed backscat-tering. Similar to what was seen in Fig. 5, the reversal of the backscattering roles occurs at 35.6 and 94 GHz, with the nee-dle aggregate exhibiting a higher backscattering than the den-drite aggregate. It is also notable that at 94 GHz the backscat-tering decreases with increasing melt fraction.
3.3 Scattering and extinction at passive microwave frequencies
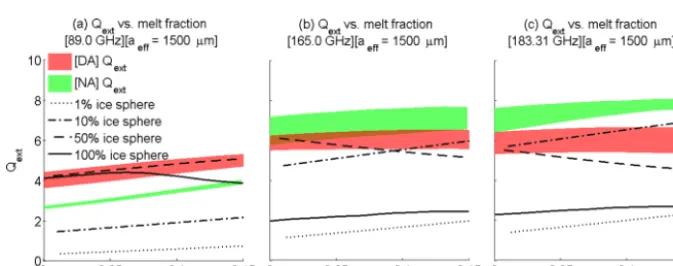
At passive microwave frequencies commonly employed for snowfall retrieval (e.g., 89, 165, and 183.31 GHz), the par-ticle interaction with microwave radiation comes primarily through extinction (scattering+absorption) and emission. Due to space constraints, only one effective radius (1500 mi-crons) is shown here in order to understand the general sensitivity of the single-particle extinction, single-scattering albedo and asymmetry parameter to the onset of melting.
Figure 7. Same as Fig. 6 except at 2500-micron effective radius. The needle aggregate at 35 GHz has a very large range due to
parti-cle rotation, whereas the dendrite aggregate exhibits about half the same range. Similar to Fig. 6c, the needle aggregate exhibits a larger backscattering compared to the dendrite aggregate efficiencies at 35.6 and 94 GHz. Panel (a) shows behavior consistent with spheres; how-ever, in (b) 35.6 and (c) 94 GHz there is no consistent behavior. Note that the backscattering efficiency in panel (b) for DA (blue region) is completely encompassed by NA, and there is significant overlap between the two in panel (c).
Figure 8. Extinction efficiencies (Qext) computed for both aggregates and spheres at an effective radius of 1500 microns for (a) 89, (b) 165,
and (c) 183.31 GHz. Similar to previous plots, shaded regions represent the ranges ofQextdue various orientations of the particle relative to incident radiation. Vertical axes are on the same scale.
for the non-spherical particles. At 89 GHz (panel a), the DA extinction is higher than NA; this role reverses at 165 and 183.31 GHz. Roughly speaking, 165 and 183.31 GHz exhibit similar sensitivities to melting at all effective radii (only 1500-micron effective radius is shown here), suggest-ing that, for rough estimates, computsuggest-ing the 165 GHz prop-erties may be sufficient for capturing the scattering and ex-tinction behaviors at 183.31 GHz (and nearby channel off-sets employed on the GPM microwave imager, and other im-agers and sounders). In actual remote-sensing applications, the difference in water vapor emission/absorption at 165 vs. 183.31 GHz is likely to dominate the signal, except in the driest of atmospheric profiles (Skofronick-Jackson and John-son, 2011).
The single-scattering albedo (the ratio of scattering to the total extinction) presented in Fig. 9 tells us the primary story of interest with regard to the onset of melting. Specifically we see that a small change in melt fraction yields a signifi-cant linear decrease in single-scattering albedo, which is an indicator of the rapidly increasing contribution of absorption to the total extinction. This, in turn, drives the thermal
emis-sion (according to Kirchhoff’s law) that we will later observe in Sect. 4.
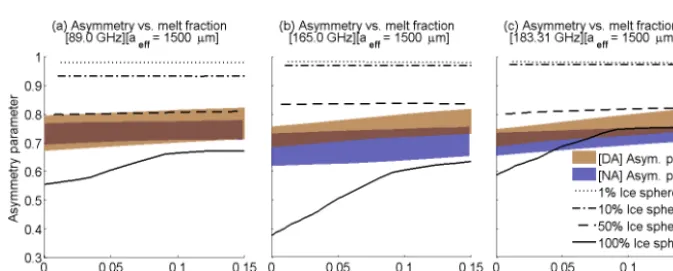
Finally, in Fig. 10, the scattering asymmetry parameter (cosine-averaged scattering contribution over all angles) de-scribes the degree to which incident radiation is forward scat-tered (g>0) or backward scatscat-tered (g<0). At a 1500-micron effective radius, very little sensitivity to the onset of melting was observed. Similar results were found at other effective radii. This is consistent with the notion that the scattered ra-diation depends primarily on the shape of the particle. Over this range of melting, the actual particle shape has changed very little, so the degree of forward scattering is not expected to change much. If melting were to continue beyond a melt fraction of 0.15 (not shown), the asymmetry parameter would change as the shape of the particle changes.
Figure 9. Similar to Fig. 8 except plotting single-scattering albedo (eω=Qsca/Qext). See text for discussion.
Figure 10. Following Figs. 8 and 9, the scattering asymmetry parameter (indicating the degree of forward scattering) is shown here. At all
frequencies, the asymmetry parameter is relatively insensitive to the early stages of melting, consistent with the fact that the overall structure of the melting particles does not change too much over this range. In panel (a), the asymmetry for NA (blue region) is fully encompassed by the asymmetry from DA, with partial overlaps in (b, c).
change. In some cases, the spherical particle properties do not bracket the non-spherical particles’ properties, suggest-ing that under the current formulation no amount of modify-ing the density parameter could result in a reliable substitute for more physically realistic shapes when one considers all of the scattering and extinction properties of interest to passive and active remote-sensing applications.
4 Integrated properties
In the previous section, we examined a subset of the single-particle scattering and extinction properties. Of interest for atmosphere radiative transfer and remote-sensing applica-tions is how these quantities behave in an ensemble of parti-cles.
4.1 Radar response
The equivalent radar reflectivities (Ze) at each frequency are calculated using the single-particle radar backscattering cross sections, Cbck(D), and integrating these over a given
particle size distribution,N (D):
Ze= λ4 π5|K
w|2 Dmax
Z
Dmin
Cbck(D) N (D)dD, (1)
whereD is the mass-equivalent diameter (twice the effec-tive radius),λis the wavelength of incident radiation with the same units as D, and Kw=(m2w−1)/(m2w+2)is the dielectric factor computed from the refractive index of wa-ter, mw. We note that in the present case we specifically chose|Kw|2≈0.93 for all wavelengths and melt fractions as a comparative convenience, so that only the backscatter-ing properties vary with melt fraction. In actual radar re-flectivities, the response to the dielectric properties of the ice/snow/mixed-phase particles within the radar range gate will be different, and completely dependent on the individual constituents shape, composition, temperature, and frequency of incident radiation.
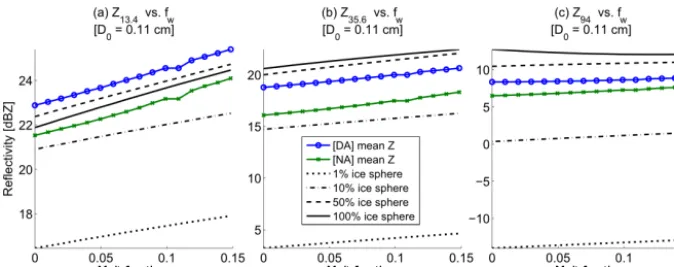
read-Figure 11. Simulated radar reflectivities at (a) 13.4, (b) 35.6, and (c) 94 GHz. Reflectivities were computed by integrating over the
orientation-averaged single-particle backscattering cross sections, assuming an exponential particle size distribution, for both aggregates and spheres. The reflectivities are presented only for one value ofD0=0.11 cm (i.e., the liquid-equivalent median volume diameter).N0andD0are
computed following Sekhon and Srivastava, 1970 (see text). Note different scaling on the vertical axes.
ily examined without confusion. Future research will explore the variation of melt fraction for particles of different sizes in a given volume of the atmosphere.
For the snowfall particle size distribution, we choose the exponential size distribution from Sekhon and Srivastava (1970) and Johnson (2007). In each of the following calcula-tions, all comparisons are made using an equal particle mass distribution. The particle size distributionN (D)is given by
N (D)=N0exp
−3.67D D0
, (2)
whereN0is the intercept parameter andD0is the “character-istic” diameter of the PSD.N0andD0are related as follows:
D0=0.14R0.45[cm], (3)
N0=2.5×10³R−0.94[mm−1m−3], (4) when liquid-equivalent precipitation rate,R, is given in units of millimeters per hour (mm hr−1).
Figures 11 and 12 show the simulated equivalent radar reflectivity, averaged over all particle orientations, vs. melt fraction for the NA (green line) and DA (blue line), along with the mass-equivalent variable-density spheres (black lines). In Fig. 11, we have selected the characteristic diam-eter D0=0.11 cm (corresponding to an ice water content of approximately 0.13 g m−3) for analysis. At all three fre-quencies, the reflectivity increases by a few decibels over the range of melting. With a judicious choice of density, spheres could reasonably approximate the simulated reflectivities of the non-spherical particles, except for the dendrite aggregate at 13.4 GHz (Fig. 11a).
In Fig. 12, the orientation-averaged reflectivities are com-puted forD0=0.55 cm, corresponding to an ice water con-tent of approximately 3 g m−3, which is roughly 15 mm h−1 liquid-equivalent snowfall rate – an exceptionally high snow-fall rate with very large snowflakes, representing an upper limit. Consequently, the simulated equivalent radar reflectiv-ities are as high as 47 dBZ for DA at 13.4 GHz. The increase
in reflectivity over the onset of melting is, similar to Fig. 11, only a few decibels per Z (dBZ) from 0 to 0.15 melt fraction. We note that becauseD0=0.55 cm is greater than the up-per limit of the individual particle size, truncation errors in the particle size distribution integration are potentially sig-nificant. So these quantities should be interpreted with this in mind. Due to computational limitations at the time of re-search, the individual melt particle sizes cannot be reliably computed above 2500-micron effective radius (5000-micron effective diameter).
Although not shown here, continued melting does not sig-nificantly increase the reflectivity beyond this point. This re-sult may appear to be inconsistent with radar observations of melting precipitation (i.e., the radar bright band) (Klassen, 1988). This suggests that the changing dielectric properties alone do not create the observed rapid increase in radar re-flectivities associated with melting. It is postulated, without proof, that enhanced aggregation of particles at or near the melting point causes a rapid increase in total particle size, en-hancing theD4diameter dependence of the reflectivity factor (e.g., Fabry and Zawadzki, 1995). A more detailed analysis of enhanced aggregation is beyond the scope of the current research.
Figure 12. Similar to Fig. 11 except for a largerD0=0.55 cm. Notice the flip in the computed reflectivities at 94 GHz, similar to what was
observed in the single-particle backscattering properties (Fig. 7). Note: the results in this figure may be subject to large particle diameter truncation, as discussed in the text.
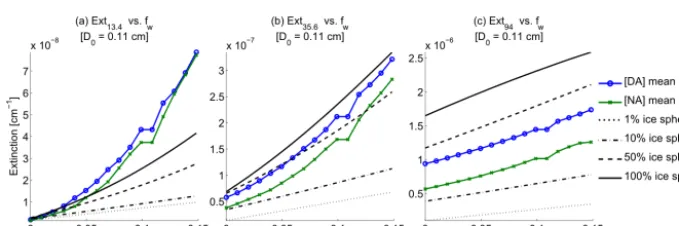
Figure 13. Volume extinction coefficient forD0=0.11 cm at (a) 13.4, (b) 35.6, and (c) 94.0 GHz. The orientation-averaged single-particle
extinction cross section was integrated over the same particle size distribution as was used in Fig. 11. Note different scaling on the vertical axes, including the exponents.
4.2 Passive microwave response
In addition to the radar sensitivity to melting, there is also an interest in understanding the sensitivity of passive microwave brightness temperatures to the onset of melting. In reality, the melting layer of a precipitating cloud is likely to be obscured by an overlying ice region, obscuring it partially or wholly, depending on the wavelength of radiation. For the follow-ing simplified analysis, a sfollow-ingle layer of meltfollow-ing hydrome-teors is simulated, with no atmospheric gases or other lay-ers intervening. To compute brightness temperatures, a two-stream approximation is used, which in past studies (Johnson et al., 2012) has been found to be remarkably accurate at de-scribing thermal emission from a plane-parallel slab viewed at the 55◦incidence angle, typical of a satellite microwave imager. The details of the two-stream approximation are pro-vided in Petty (2008). Under the assumption of an infinitely thick slab, the transmittance through the slab is zero. Conse-quently the resulting upwelling brightness temperature from the two-stream approximation is only a function of the layer temperature,Ta, and the layer reflectivity,r∞:
TB,∞=Ta−Tar∞, (5)
where
r∞= √
1−geω−√1−g √
1−geω+√1−g. (6)
Hereeωandghave been appropriately integrated over the exponential particle size distribution (Eq. 2). In this sim-plified model,r∞is uniquely determined given the follow-ing physical properties: the wavelength of incident radiation, melting fraction (i.e., the dielectric properties), the particle orientation, and the particle size distribution. The utility of the two-stream model should not be oversold: it is a useful method for understanding the bulk sensitivity of upwelling microwave TBs to modifications in the underlying physical properties of hydrometeors, but it ignores all other contri-butions that would normally be present in an actual remote-sensing scene. In this sense, it provides a “worst-case” sce-nario for the influence of microphysical properties on the up-welling brightness temperature.
pro-Figure 14. Same as Fig. 13 except forD0=0.55 cm. Note the different scaling on the vertical axes, including the exponents; the results in
this figure may be subject to large particle diameter truncation, as discussed in the text.
Figure 15. A surface plot of simulated brightness temperatures (TBs) for D0vs. melt fraction assuming an “infinite” layer of melting
hydrometeors at (a) 89, (b) 165.0, and (c) 183.31 GHz. A two-stream radiative transfer model (see text) was used to compute the TBs. Particle size distributions used here are the same as those used in the reflectivity computations.
ceeding from an unmelted particle to a melt fraction of 0.01 (only 1 % melted), the brightness temperatures increase by almost 100 K, whereas for larger particles (higher ice wa-ter contents) the sensitivity to melting is not as rapid but nevertheless significant throughout the range of D0values. The onset of melting, from 0.0 to 0.15 melt fractions, leads to increases of up to approximately 125 K. In order to bet-ter understand the impact of this, further analysis is needed wherein a 1-D vertical or 3-D simulation is used to simulate a more realistic atmospheric column. It is expected that an ice layer overlaying the melting layer would partially or wholly obscure emission through scattering at the frequencies exam-ined here – this is left for future studies.
5 Conclusions
In this paper, the Single Particle Melting Model was intro-duced as a novel and computationally efficient method to simulate the melting of an arbitrarily shaped ice hydrome-teor. SPMM uses a novel nearest-neighbor method for de-termining when a particular point will melt and when previ-ously melted points can move. It is easy to implement and map into any existing thermodynamic/melting-layer model, where a simple mapping between meltwater generation in a thermodynamic model and the melt fractions generated
by the melting simulation are linked as appropriate. This also provides finer control over the particle size distribution within the melting layer.
A limited study of the onset of melting, for melt frac-tions ranging from 0 to 0.15, was performed in order to quantify the sensitivity of microwave radiation scattering and extinction. Two snowflake aggregate shapes were selected: one composed of needles and the other composed of den-dritic crystals. For comparison with past studies, the scat-tering and extinction properties of spherical particles hav-ing 1, 10, 50, and 100 % volume fractions of ice (relative to air) were simulated. Single particle calculations using the discrete dipole approximation, via the DDSCAT code, were made, highlighting the individual particle and size-distribution integrated particle properties. These calculations were made at 13.4, 35.6, and 94 GHz, consistent with the GPM dual-frequency precipitation radar, and at 89, 165, and 183.31 GHz, consistent with the GPM microwave radiome-ter. We believe that this study represents the first simula-tion of the scattering and extincsimula-tion properties of realistically shaped melting hydrometeors for a wide range of microwave frequencies and particle sizes.
spherical particle assumption was unable to capture the range of computed scattering properties from the non-spherical particles and did not provide consistent relationships be-tween scattering and extinction throughout the onset of melt-ing. The conclusion one could draw from this is that from a modeling perspective it appears that spherical particles (no matter how the density/mass is modified) cannot fully repre-sent the range of uncertainties in the absence of of knowledge of the hydrometeors present in a given remote-sensing scene. Capturing this behavior in physical models is critical for ac-curately computing uncertainty estimates in forward model simulations and retrieval algorithms.
Validation of these simulations could be, in future work, performed by examining, for example, radar observations of stratiform melting layers – especially in cases where in situ observations of particle shape are available. The present model is currently being adapted to simulate melting for ex-isting ice hydrometeor databases consex-isting of tens of thou-sands of particles, and it will allow for more realistic com-parisons with observational data.
Acknowledgements. The majority of this investigation was
sup-ported by the NASA PMM (R. Kakar) and RST (L. Tsaoussi) programs – specifically NASA grants NNX11AR55G (PI: B. Johnson), NNX10AI49G (PI: W. Olson), and NNX10AT36A (PI: G. Skofronick-Jackson).
Edited by: M. Kulie
References
Barros, A. P.: NASA GPM-Ground Validation: Integrated Precipi-tation and Hydrology Experiment 2014 Science Plan., Tech. rep., Duke University, Durham, NC, 64 pp., 2014.
Bohren, C. F. and Huffman, D. R.: Absorption and Scattering of Light by Small Particles, Wiley-Interscience, New York, 530 pp., 1983.
Bohren, C. F. and Battan, L. J.: Radar backscattering of microwaves by spongy ice spheres, J. Atmos. Sci., 39, 2623–2628, 1982. Botta, G., Aydin, K., and Verlinde, J.: Modeling of microwave
scat-tering from cloud ice crystal aggregates and melting aggregates: a new approach, IEEE Geosci. Remote S., 7, 572–576, 2010. Draine, B. T. and Flatau, P. J.: Modeling of microwave scattering
from cloud ice crystal aggregates and melting aggregates: a new approach, J. Opt. Soc. Am. A, 11, 1491–1499, 1994.
Fabry, F. and Zawadzki, I.: Long-term radar observations of the melting layer of precipitation and their interpretation, J. Atmos. Sci., 52, 838–851, 1995.
Hou, A. Y., Kakar, R. K., Neeck, S., Azarbarzin, A. A., Kum-merow, C. D., Masahiro, K., Oki, R., Nakamura, K., and Iguchi, T.: The global precipitation measurement mission, B. Am. Meteorol. Soc., 95, 701–722, 2014.
Hudak, D., Petersen, W. A., Skofronick-Jackson, G., Wolde, M., Schwaller, M., Joe, P., and Steward, R.: GPM cold season pre-cipitation experiment (GCPEx), in: EUMETSAT Proc. Meteor. Sat. Conf., Sopot, Poland, 1–8, 3–7 September 2012.
Johnson, B. T.: Multi-frequency passive microwave and dual-frequency radar remote sensing of snowfall, PhD thesis, Univer-sity of Wisconsin, Madison, WI, 242 pp., 2007.
Johnson, B. T., Petty, G. W., and Skofronick-Jackson, G.: Mi-crowave properties of ice-phase hydrometeors for radar and ra-diometers: sensitivity to model assumptions, J. Appl. Meteorol. Clim., 51, 2152–2171, 2012.
Klassen, W.: Radar observations and simulation of the melt-ing layer of precipitation, J. Atmos. Sci., 45, 3741–3753, doi:10.1175/1520-0469(1988)045<3741:ROASOT>2.0.CO;2, 1988.
Kulie, M. S., Hiley, M. J., Bennartz, R., Kneifel, S., and Tanelli, S.: Triple-frequency radar reflectivity signatures of snow: observa-tions and comparisons with theoretical ice particle scattering models, J. Appl. Meteorol. Clim., 53, 1080–1098, 2014. Liao, L., Meneghini, R., Nowell, H. K., and Liu, G.: Scattering
com-putations of snow aggregates from simple geometrical particle models, IEEE J. Sel. Top. Appl., 6, 1409–1417, 2013.
Liebe, H. J., Hufford, G. A., and Manabe, T.: A model for the com-plex permittivity of water at frequencies below 1 THz, Int. J. In-frared Milli., 12, 659–675, 1991.
McMurdie, L., Houze Jr., R. A., Petersen, W., Cifelli, R., Schnei-der, T., Lettenmeier, D., Medina, S., and Brodzik, S.: Prospec-tus for a GPM Ground Validation Experiment in the Pacific Northwest, available at: http://olympex.atmos.washington.edu/, last access: 14 April 2015.
Mitra, S. K., Vohl, O., Ahr, M., and Pruppacher, H. R.: A wind tun-nel and theoretical study of the melting behavior of atmospheric ice particles. IV: Experiment and theory for snow flakes, J. At-mos. Sci., 47, 584–591, 1990.
Leinonen, J. and Moisseev, D., What do triple-frequency radar sig-natures reveal about aggregate snowflakes?, J. Geophys. Res. At-mos., 120, 229–239, 2015.
Olson, W. S., Bauer, P., Viltard, N. F., Johnson, D. E., Wei-Kuo, T., Meneghini, R., and Liao, L.: A melting-layer for passive/active microwave remote sensing applications. Part I: Model formula-tion and comparison with observaformula-tions, J. Appl. Meteorol., 40, 1145–1163, 2001.
Oraltay, R. G. and Hallett, J.: The melting layer: a laboratory inves-tigation of ice particle melt and evaporation near 0◦C, J. Appl. Meteorol., 44, 206–220, 2005.
Petersen, W. A. and Jensen, M.: The NASA-GPM and DOE-ARM Midlatitude Continental Convective Clouds Experiment (MC3E), Int. J. Appl. Earth Obs., 24, 12–18, 2012.
Petty, G. W.: A First Course in Atmospheric Radiation, Sundog Publishing, Madison, Wisconsin, 472 pp., 2008.
Petty, G. W. and Huang, W.: Microwave backscatter and extinction by soft ice spheres and complex snow aggregates, J. Atmos. Sci., 67, 769–787, 2010.
Sekhon, R. S. and Srivastava, R. C.: Snow size spectra and radar reflectivity, J. Atmos. Sci., 27, 299–307, 1970.
Skofronick-Jackson, G. and Johnson, B. T.: Scattering computa-tions of snow aggregates from simple geometrical particle mod-els, J. Geophys. Res.-Atmos., 116, 1984–2012, 2011.
Tyynelä, J., Leinonen, J., Moisseev, D., Nousiainen, T., and von Ler-ber, A.: Modeling radar backscattering from melting snowflakes using spheroids with nonuniform distribution of water, J. Quant. Spectrosc. Ra., 133, 504–519, 2014.
Warren, S. and Brandt, R. E.: Optical constants of ice from the ultra-violet to the microwave: a revised compilation, J. Geophys. Res., 113, D14220, doi:10.1029/2007JD009744, 2008.