https://doi.org/10.5194/cp-13-1435-2017 © Author(s) 2017. This work is distributed under the Creative Commons Attribution 3.0 License.
A pseudoproxy assessment of data assimilation for
reconstructing the atmosphere–ocean dynamics
of hydroclimate extremes
Nathan J. Steiger and Jason E. Smerdon
Lamont-Doherty Earth Observatory, Columbia University, Palisades, New York, USA
Correspondence to:Nathan J. Steiger (nsteiger@ldeo.columbia.edu)
Received: 5 May 2017 – Discussion started: 19 May 2017
Revised: 1 September 2017 – Accepted: 16 September 2017 – Published: 27 October 2017
Abstract. Because of the relatively brief observational record, the climate dynamics that drive multiyear to cen-tennial hydroclimate variability are not adequately charac-terized and understood. Paleoclimate reconstructions based on data assimilation (DA) optimally fuse paleoclimate prox-ies with the dynamical constraints of climate models, thus providing a coherent dynamical picture of the past. DA is therefore an important new tool for elucidating the mecha-nisms of hydroclimate variability over the last several mil-lennia. But DA has so far remained untested for global hy-droclimate reconstructions. Here we explore whether or not DA can be used to skillfully reconstruct global hydroclimate variability along with the driving climate dynamics. Through a set of idealized pseudoproxy experiments, we find that an established DA reconstruction approach can in principle be used to reconstruct hydroclimate at both annual and sea-sonal timescales. We find that the skill of such reconstruc-tions is generally highest near the proxy sites. This set of re-construction experiments is specifically designed to estimate a realistic upper bound for the skill of this DA approach. Importantly, this experimental framework allows us to see where and for what variables the reconstruction approach may never achieve high skill. In particular for tree rings, we find that hydroclimate reconstructions depend critically on moisture-sensitive trees, while temperature reconstruc-tions depend critically on temperature-sensitive trees. Real-world DA-based reconstructions will therefore likely require a spatial mixture of temperature- and moisture-sensitive trees to reconstruct both temperature and hydroclimate variables. Additionally, we illustrate how DA can be used to elucidate the dynamical mechanisms of drought with two examples: tropical drivers of multiyear droughts in the North American
Southwest and in equatorial East Africa. This work thus pro-vides a foundation for future DA-based hydroclimate recon-structions using real-proxy networks while also highlighting the utility of this important tool for hydroclimate research.
1 Introduction
While hydroclimate reconstructions exist over many dif-ferent timescales and resolutions (e.g., Tierney et al., 2008, 2011; Masson-Delmotte et al., 2013), hydroclimate recon-structions over the Common Era (the past two thousand years) are particularly important because this time period al-lows for seasonal- and annual-timescale reconstructions over much of the globe (Bradley, 2014; Smerdon et al., 2017). Hy-droclimate reconstructions for the Common Era have been performed for localized regions, such as for snowpack and precipitation in specific mountain ranges (e.g., Belmecheri et al., 2016; Neukom et al., 2015) or for the streamflow of particular rivers (e.g., Jacoby Jr., 1976; Cook et al., 2013). On continental scales, gridded “drought atlases” targeting the Palmer drought severity index (PDSI) have been derived over portions of North America (Cook et al., 2007; Stahle et al., 2016), Europe (E. R. Cook et al., 2015), Southeastern Asia (Cook et al., 2010a), and Australia and New Zealand (Palmer et al., 2015). Despite these regional successes, no truly global hydroclimate reconstructions have been attempted.
The goal of this work is to demonstrate and test the ap-plication of data assimilation (DA) for global hydroclimate reconstructions. DA is a method that optimally fuses proxy information with the dynamical constraints of climate mod-els (Goosse et al., 2012; Steiger et al., 2014; Hakim et al., 2016). We lay this groundwork by performing a set of syn-thetic “pseudoproxy” reconstructions that estimate a realistic upper bound on reconstruction skill: given the current proxy networks and state-of-the-art climate models, we ask whether or not it is possible to skillfully reconstruct hydroclimate variables and their related dynamics. Pseudoproxy experi-ments provide a test of the reconstruction methodology while controlling for uncontrolled and sometimes unknown factors that pervade real-proxy reconstructions (see Smerdon, 2012, for a review). Pseudoproxy experiments have been success-fully used to test the skill and characteristics of several recon-struction methodologies, including DA, and reconstructed variables such as temperature and precipitation (e.g., Mann et al., 2005, 2007; Christiansen et al., 2009; Smerdon et al., 2011; Werner et al., 2013; Steiger et al., 2014; Wang et al., 2014, 2015; Gómez-Navarro et al., 2015). The present pseu-doproxy reconstruction work will help to focus future DA reconstruction efforts on the variables, timescales, and ge-ographic areas that are most likely to be successfully recon-structed. This paper also showcases the new kinds of analyses that are possible with the dynamical atmosphere–ocean vari-ables from a DA-based climate reconstruction. We first ana-lyze the pseudoproxy reconstructions by focusing on global-scale temperature and hydroclimate indices. We then move into specific analyses of the mechanisms of drought in the North American Southwest and equatorial East Africa.
2 Experimental framework
2.1 DA methodology
We employ a DA technique that optimally combines observa-tions (in this context, proxy data) with climate model states. The model provides an initial, or prior, state estimate that is updated in a Bayesian sense based on the observations and an estimate of the errors in both the observations and the prior. The prior may contain any climate model variables of inter-est. The updated prior, called the posterior, is the estimate of the climate state given the observations and the error esti-mates. The basic state update equations of DA (e.g., Kalnay, 2003, Chap. 5) are given by
xa=xb+K[y−H(xb)], (1)
wherexbis the prior (or “background”) estimate of the state vector andxais the posterior (or “analysis”) state vector. Ob-servations (or proxies) are contained in vectory. The obser-vations are estimated by the prior throughH(xb), which is in general a nonlinear vector-valued observation operator that mapsxbfrom the state space to the observation space. The Kalman gain matrixKcan be written as
K=BHT[HBHT+R]−1, (2)
whereB is the prior covariance matrix, Ris the error co-variance matrix for the proxy data, andHis the linearization ofHabout the mean value of the prior. Specifically, we use an ensemble square root filter (Whitaker and Hamill, 2002) to compute Eq. (1). We also note that Eq. (1) assumes that y,xb, andH(xb) are Gaussian distributed and that their er-rors are unbiased. The reconstruction process works by es-sentially computing an optimal linear fit between the initial guess of the climate state (the priorxb) and the proxies (y). This process involves iteratively computing Eq. (1) for each year of the reconstruction to arrive at ensemble estimates (the posteriorxa) of the climate for each year. In any given year of the reconstruction,xais the probability distribution of states that are consistent with the proxy observations and errors and the prior distribution; therefore it is the full probability dis-tribution ofxathat represents the probabilistic reconstruction of the climate state. In the time series figures herein, we show the mean ofxa, with uncertainty estimates derived from the posterior distribution. For more mathematical details of the reconstruction methodology and the precise calculation pro-cedure, see the Appendix of Steiger et al. (2014).
sin-gle long simulation, multiple simulations, or even from sim-ulations of a collection of climate models; the only impor-tant requirement is that the prior be climatologically repre-sentative of what one is trying to reconstruct (e.g., to recon-struct a year with a large volcanic eruption, the prior should contain ensemble members that come from simulation years with large volcanic eruptions). Because of how the prior is constructed here, it does not contain year-specific forcings or boundary conditions, information which appears to be su-perfluous according to many previous reconstructions exper-iments (Steiger et al., 2014, 2017; Hakim et al., 2016; Steiger and Hakim, 2016; Dee et al., 2016; Okazaki and Yoshimura, 2017). The reconstruction process is also performed for each year independently such that no information is propagated forward in time. As discussed in Steiger et al. (2014, 2017) and Hakim et al. (2016), the offline approach is well suited to a paleoclimate context in which it has been shown to be highly skillful at annual timescales (Hakim et al., 2016) with-out the immense computational costs of a traditional online approach. Moreover, tests of offline vs. online approaches for paleoclimate have so far shown no improvement in re-construction skill with an online method (Matsikaris et al., 2015; Acevedo et al., 2017).
2.2 Climate model simulations
Here we explore hydroclimate reconstructions using DA with a series of pseudoproxy experiments. For these experiments, we employ two full-forcing simulations of the Community Earth System Model from the Last Millennium Ensemble Project (CESM LME; Otto-Bliesner et al., 2016). These CESM simulations used∼2◦atmosphere and land compo-nents and ∼1◦ ocean and sea ice components. The simu-lations were run from the years 850 to 1850 CE using esti-mates of the transient evolution of solar intensity, volcanic emissions, greenhouse gases, aerosols, land-use conditions, and orbital parameters. The simulations were given identical forcings but differed by round-off error in the initial atmo-spheric state; this difference was sufficient to generate sim-ulations with different time histories (e.g., Nino 3.4 indices from the two simulations we use here have an annual average correlation of 0.097). These simulations provide the climate states for our prior ensembles and the climate inputs for the pseudoproxies: the pseudoproxies, y, are generated for the CESM LME simulation 10, while the prior,xb, and the prior estimate of the pseudoproxies,H(xb), are from simulation 9. In other words, simulation 10 plays the role of the actual cli-mate in a real-world reconstruction setting; the pseudoprox-ies are all derived from that simulation, while simulation 9 generates the ensemble of states that define the prior. We use two different simulations in this way so that there is no over-lap between the specific prior states and the reconstructed climate states.
2.3 Pseudoproxy construction
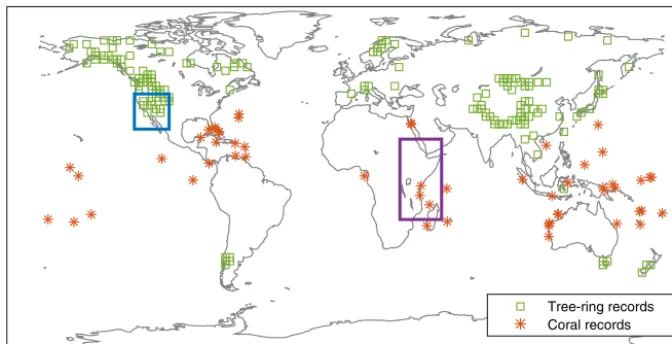
We generate realistic pseudoproxies via process (or forward) models for each proxy type (see Evans et al., 2013, for a review), which transform the simulated climate signal (e.g., temperature, precipitation) into synthetic proxy observations. For the pseudoproxy experiments, we construct pseudo-tree-ring width and an approximation of pseudo-coralδ18O. We only consider these two proxy types because they have estab-lished proxy system models and because they represent the majority of proxies in global databases (e.g., 92 % of proxies in the PAGES2k network; PAGES2k Consortium, 2017). Be-cause our experimental construction defines an upper limit on reconstruction skill, we do not consider age uncertainties, which would act to degrade reconstruction skill and are not applicable for the tree-ring proxies that constitute the major-ity of the proxy network. We use the pseudoproxy network shown in Fig. 1, which is based on the updated PAGES2k network of real, global proxy data (PAGES2k Consortium, 2017). In this pseudoproxy network, we created only one pseudoproxy per climate model grid cell, though in real-proxy reconstructions there would be the possibility of hav-ing multiple proxies within a given grid cell. Reconstruc-tions were performed using both tree and pseudo-coral proxies together and also using pseudo-trees alone.
We generated 160 pseudo-tree-ring widths using the model VS-lite (Tolwinski-Ward et al., 2011), which uses monthly temperature and precipitation from the CESM LME simulations to calculate tree-ring width time series at each pseudo-tree-ring location. This model accounts for the sea-sonal dependence of tree growth via simple parameteriza-tions of temperature and moisture threshold responses at monthly scales and latitudinal light availability. We esti-mated the four growth parameters of VS-lite for each pseudo-tree location using the real PAGES2k pseudo-tree-ring width data (PAGES2k Consortium, 2017), the monthly observational temperature and precipitation data of CRU TS3.23 (Harris et al., 2014), and the VS-lite parameter estimation code from Tolwinski-Ward et al. (2013). Note also that because this proxy system model takes care of the averaging timescale of each individual tree, there is no need to define a rigid timescale imposed on all tree sites (e.g., all trees in the North-ern Hemisphere reflect only June–July–August temperature). We generated 55 pseudo-coralδ18O values through the lin-ear proxy system model of Thompson et al. (2011), which for a given coral proxy can be written as
δ18Opseudo-coral=a1SST+a2SSS+, (3)
proxy system model only requires SST and SSS to create coralδ18O pseudoproxies.
Within the formulations for both the pseudo-tree-ring widths and pseudo-coral δ18O, each have realistic param-eters estimated with real-proxy and historical data but are driven offline by climate time series inputs from the CESM LME simulations, viz., 2 m air temperature, total precipita-tion, SST, and SSS. While the combination of the climate simulation output and the proxy system models produce sin-gle proxy values for a given year, these values represent the many short timescale processes included in the climate model simulations, such as daily weather events.
We additionally note a special issue regarding the use of the VS-lite proxy system model within our Kalman-filter-based DA method: we find the output of VS-lite for some locations to be strictly non-Gaussian. This is important be-cause Eq. (1) assumes that y andH(xb) are Gaussian. In preliminary work, we observed “filter divergence” (in which the state estimate diverges unrealistically away from the true state) for small prior ensembles when using VS-lite pseu-doproxies. We have not observed this effect with the proxy system models for corals or ice cores (Dee et al., 2016; Steiger et al., 2017). A common though ad hoc way of deal-ing with filter divergence is to employ covariance localiza-tion that smooths out spurious long-range correlalocaliza-tions, acts to boost the “effective” ensemble size, and tends to reduce non-Gaussian issues (Houtekamer and Mitchell, 1998). Us-ing covariance localization is unattractive, however, because it is ad hoc and ensemble sizes can be very large in an of-fline DA approach. We therefore found that to avoid fil-ter divergence we needed over 500 ensemble members in our prior. We did not find much sensitivity to the results with ensemble sizes between about 600 and 1000 mem-bers (e.g., maximum changes of 0.05 in the correlation skill of the global mean temperature reconstructions). We there-fore performed the reconstructions with 1000 members, the maximum available years for the CESM LME simulations. This does not limit future real-proxy reconstructions be-cause of the many millennial-length climate model simu-lations available (Fernández-Donado et al., 2013; Masson-Delmotte et al., 2013), but it did require that we use the CESM LME in the present pseudoproxy experiments be-cause it is the only high-resolution, CMIP5/PMIP3-class cli-mate model with multiple millennial-length simulations that are publicly available.
A further idealization in these reconstructions is that we consider only measurement error. Specifically, we add white noise with a standard deviation of 0.01 (approximate width measurement uncertainty) to the pseudo-tree-ring time series that already have a variance equal to 1 and 0.1 (approxi-mate isotope measurement uncertainty) to the pseudo-coral time series that are in units of per mil; the diagonal elements of Rare 0.012for pseudo-trees and 0.12for pseudo-corals. This choice is motivated by our interest in the best-case sce-nario so as to estimate an upper bound for DA-based
re-constructions. Our choice is also motivated by the fact that quantifying errors in nonlinear proxy system models like VS-lite is nontrivial (Evans et al., 2014), and thus we can have more confidence in an upper-bound reconstruction skill estimate than a “most-realistic” skill estimate. However, in the context of traditional regression-based reconstruction ap-proaches, multivariate signals in proxies are “noise.” For ref-erence, when the no-noise-added tree-ring and coral pseudo-proxies are compared against the climate model PDSI and SST, respectively, the tree rings have a mean signal-to-noise ratio (SNR) of 0.46 with a standard deviation of 0.50 and the corals have a mean SNR of 0.41 with a standard de-viation of 0.23 (calculated following Mann et al. (2007), SNR= |ρ|/p1−ρ2, whereρis the correlation between the proxy and the nearest grid point climate variable time se-ries). These SNRs are therefore typical of estimates for real proxies and are comparable to the SNRs adopted in pseu-doproxy contexts that test traditional regression approaches (Wang et al., 2014).
2.4 Reconstruction procedure and experiments
Here we employ a “perfect model” framework in which the same underlying climate model is used for both the prior and the “true” climate model state. The prior,xb, consists of all the climate states at their relevant resolutions (including monthly, seasonal, and annual resolutions as defined below) from the CESM LME simulation number 9. Using this prior, we reconstruct the corresponding annual and seasonal states of simulation 10 based only on our prior and the pseudoprox-ies that are generated from simulation 10. Despite the ideal-ization of the perfect model framework, previous DA-based reconstruction work has shown similar results using differ-ent climate models in both pseudoproxy and real-proxy re-constructions that did not assume a perfect model framework (Hakim et al., 2016; Dee et al., 2016; Steiger et al., 2017). These studies saw similar basin and continent-wide patterns and magnitudes of reconstruction skill.
For the reconstructions, the annual states are constructed out of monthly CESM LME output averaged from April to the next calendar year’s March. This annual average is chosen to account for the seasonal cycle of a global net-work of proxies and climate phenomena like the El Niño– Southern Oscillation (ENSO), the continuity of which would be ignored with a calendar year average. The seasonal states we use are June–July–August (JJA) and December–January– February (DJF) averages of the monthly climate variables.
Figure 1.Pseudoproxy network used in this study based on the PAGES2k global database of tree-ring and coral records (PAGES2k Con-sortium, 2017), and the drought regions explored in this study, with the North American Southwest in blue and equatorial East Africa in purple.
precipitation, 2 m temperature, vapor pressure, net surface ra-diation, surface pressure, and surface wind (estimated from 10 m down to 2 m using the wind profile power law). Here we focus on PDSI and SPEI because they are so widely used for current drought monitoring and historical drought recon-structions. In addition to these global variables, we also clude the following index variables: the location of the in-tertropical convergence zone (ITCZ) defined by the precip-itation centroid (center of mass) of the zonal mean tropical precipitation (20◦N to 20◦S; Frierson and Hwang, 2012) and the monthly Nino 3.4 index. Note that both of these vari-ables are computed upfront and included as index varivari-ables in the prior state vector rather than being post-processed from reconstructed spatial climate fields (both approaches give equivalent results); this was done simply to save computa-tional memory and speed up the reconstructions.
As in previous work (Hakim et al., 2016; Steiger and Hakim, 2016; Dee et al., 2016; Steiger et al., 2017), we quan-tify uncertainty in our reconstructions through a combination of Monte Carlo sampling of the proxy network and account-ing for the spread in the posterior distribution,xa. Each 1000-year reconstruction is repeated 25 times in a Monte Carlo fashion by sampling 75 % of the pseudoproxy network for each reconstruction iteration (we only perform 25 iterations because the small pseudoproxy errors lead to very similar reconstructions). This gives us 25 equally likely reconstruc-tions that each come with a 1000-member posterior ensem-ble estimate for each year of the reconstruction. Because this generates very large data files, we save the ensemble mean for each year of the Monte Carlo iterations and the full pos-terior ensembles for only one of the iterations. This yields two distributions for each year based on the proxy network sampling and the spread in climate model states. We compute the standard deviation of each of these distributions and add
them in quadrature, giving us the final uncertainty estimates for all of the variables in space and time. For this particu-lar experimental setup, we note that it is actually only neces-sary to save one full posterior ensemble because the posterior spread depends only on the spread in the prior, the spread in the prior estimate of the proxies, the proxy error estimates, and the number of proxies (see, for example, Eqs. A2–A4 in Steiger et al., 2014), each of which are identical for all the Monte Carlo iterations. The upshot is that the ensemble spread (but not the ensemble mean) is identical for each year and each reconstruction iteration.
recon-structions provide no meaningful information. However, be-cause such experiments are synthetically constructed, there is significant uncertainty about their fidelity to the real climate reconstruction problem; for example, Dee et al. (2016) used a model of intermediate complexity to reconstruct a simula-tion from a state-of-the-art coupled model to test the effect of inexact model covariance structures of the prior, but it is unclear how representative this comparison is to a real-world reconstruction. Working within a more idealized context cir-cumvents such issues but also affects the framing and inter-pretation of the results. These upper-bound skill estimates indicate what is theoretically possible and are most useful in showing which regions and variables lack skill and are thus likely unreconstructable.
3 Global reconstruction skill assessment
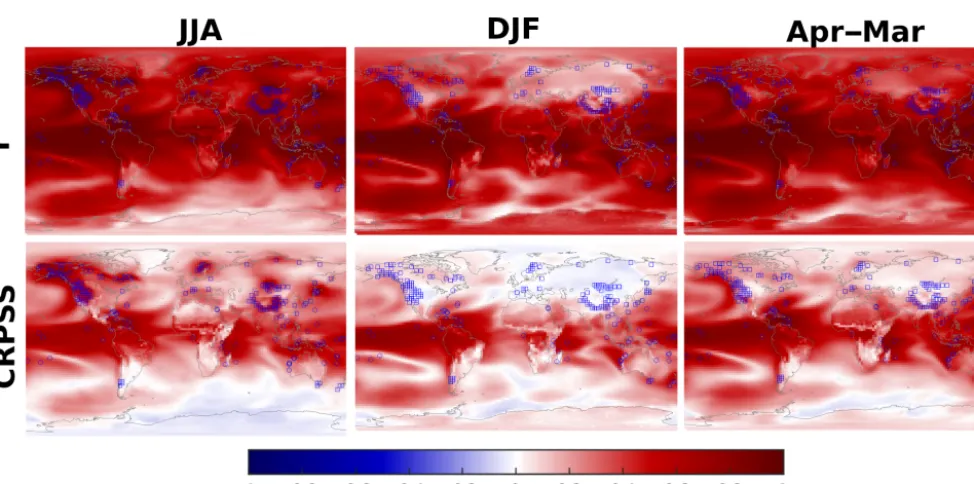
We first assess the spatial temperature reconstructions in Fig. 2, which shows the skill of the reconstruction at each grid point using the metrics of correlation (r) and the mean continuous ranked probability skill score (CRPSS). Seasonal (JJA and DJF) and annual reconstructions are organized by column. Correlation is computed using only the reconstruc-tion mean time series at each grid point, while the CRPSS metric accounts for both the mean grid point time series and the grid point uncertainty estimates. CRPSS is based on the continuous ranked probability score (CRPS), which is a “strictly proper” scoring rule that accounts for the skill of the entire posterior reconstruction distribution (Gneiting and Raftery, 2007); because the posterior ensemble estimates are normally distributed, we use Eq. (5) from Gneiting et al. (2005), which is given by
crps=σ
yn h
28(yn)−1 i
+2φ(yn)− 1 √ π
, (4)
whereyn=(y−µ)/σ, withy being the true value,µis the mean of the posterior ensemble estimate, σ is the standard deviation of the posterior ensemble, andφ(yn) and8(yn) are respectively the normal probability density function and the normal cumulative distribution function ofyn. All of our uses of Eq. (4) are for time series, either individual or grid point. We therefore compute the mean of all the time-step values and denote it as CRPS. The skill score version, CRPSS, is the reconstructed CRPS computed with respect to the CRPS of a reference distribution, CRPSS≡1−CRPSrec/CRPSref, here the initial uninformed prior; positive CRPSS indicates that the reconstructed distribution is more skillful for this metric than the uninformed prior. CRPSS is a much more stringent skill metric than correlation, so we focus most of our atten-tion on CRPSS.
Returning again to Fig. 2 and focusing on the CRPSS sults, we note that skill is highest in the densest proxy re-gions. Comparing the first and second columns in Fig. 2, skill is also much higher near the pseudo-trees during their
primary growing season (note that the full growing season for each pseudo-tree site is not preset but determined by VS-lite based on the local temperature and moisture conditions that allow or suppress growth). Despite these seasonal de-pendencies, the annual mean temperature reconstructions in the third column of Fig. 2 are skillful (positive CRPSS) de-spite the fact that the pseudo-trees are not responsive to the full annual cycle of climate. This is possible because the DA algorithm can exploit climate field covariance informa-tion across timescales; see Steiger and Hakim (2016) and note that, for example, ENSO and the approximately 500-day thermal timescale of the global ocean mixed layer (Lint-ner and Neelin, 2008) are physical features of the climate system that can retain information across seasonal and an-nual timescales. The skill of the temperature reconstructions in Fig. 2 is high across the tropics and is not solely depen-dent on the presence of corals there, though they do improve tropical reconstructions (see Sect. 4.1).
One more subtle feature of Fig. 2 is that not all proxy loca-tions show similar local temperature reconstruction skill, par-ticularly for the pseudo-tree rings. This suggests that certain pseudoproxy locations provide more local information about temperature than other locations. Importantly, the tree-ring proxy system model VS-lite explicitly models how much of a given site’s growth is affected by either temperature or mois-ture limitations (the two growth-controlling factors modeled by VS-lite). Following Tolwinski-Ward et al. (2013), we used VS-lite’s growth responses (optional outputs of VS-lite) to calculate which locations were either moisture or tempera-ture limited, expressed here by a “moistempera-ture limitation frac-tion,” as shown in Fig. 3. Specifically, we computed the fraction of summer months over the entire simulation in which the growth response to soil moisture was less than the growth response to temperature; summer is defined as JJA in the Northern Hemisphere and DJF in the Southern Hemi-sphere. Values of this fraction approaching zero indicate a temperature-limited site, while values approaching one indi-cate a moisture-limited site.
Figure 2.Reconstruction skill for 2 m air temperature. Rows show the skill metrics of correlation (r) and the mean continuous ranked probability skill score (CRPSS). These skill metrics are computed for the entire 1000-year reconstruction against the true grid point time series, CESM LME simulation 10. Columns show the reconstruction skill for June–July–August (JJA) and December–January–February (DJF) seasonal means and the annual mean from April to the next calendar year’s March. Pseudo-tree sites are indicated by blue squares, and pseudo-corals are indicated by blue circles.
Figure 3. Moisture limitation fraction for each pseudo-tree ring, with green values indicating more moisture-limited sites and red values indicating more temperature-limited sites. A value of 0 in-dicates a pseudo-tree site that is completely temperature limited, while a value of 1 indicates a completely moisture-limited site.
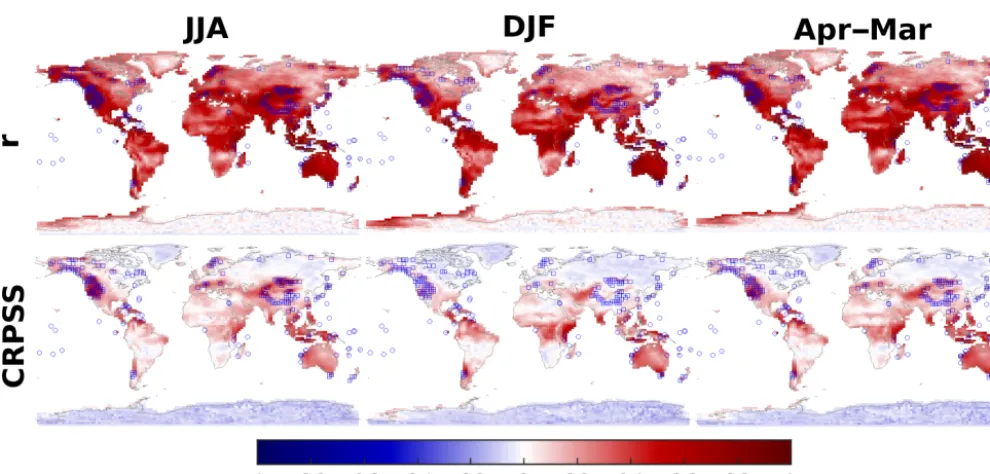
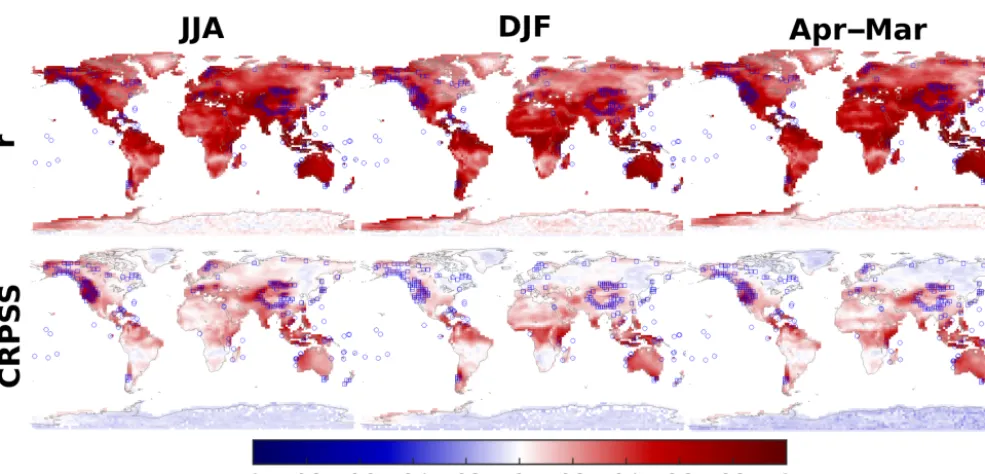
Figures 4 and 5 show the skill of the reconstructed PDSI and SPEI. Both indices behave very similarly, with slightly higher skill values for SPEI (e.g., over boreal Canada and Russia for JJA correlation and CRPSS). Similar to the tem-perature reconstruction, the higher skill values tend to be local to the proxy sites, especially for the CRPSS metric. This result particularly holds for the areas of single
moisture-limited proxies or clusters thereof. These dependencies are again illustrated by comparing Figs. 3, 4, and 5 around the four Arctic Russia sites where skill is increased around the moisture-limited locations, particularly for the far east-ern proxy in that region. Similarly, the cluster of moisture-limited sites in the Pamir mountain range is associated with increased skill there and westward to the Caspian Sea. In contrast, the arc of Himalayan pseudo-tree rings is largely temperature limited, and despite their density they have low CRPSS skill values for the PDSI and SPEI reconstructions. We also note that the skill over Australia and the equatorial regions is not dependent on the presence of the pseudo-corals (not shown), which is consistent with some of the findings of real-proxy drought reconstructions (Palmer et al., 2015) that indicate the long covariance length scales in these re-gions. Similar to the temperature reconstructions, Figs. 4 and 5 show that skillful annual reconstructions of hydroclimate are in principle possible in this DA framework despite the fact that the pseudo-trees are primarily responding to grow-ing season conditions. This result may be due in part to the persistence built into the drought indices.
cor-Figure 4.Reconstruction skill, correlation (r), and the mean continuous ranked probability skill score (CRPSS) for the Palmer drought severity index (PDSI); cf. Fig. 2.
relation is less stringent in that it only tracks the phase of the mean reconstruction and results in generally quite high correlations for most locations and seasons. The compar-isons we have so far made between Fig. 3 and the skill metrics in Figs. 2, 4, and 5 illustrate a general rule that without moistusensitive trees skillful PDSI or SPEI re-constructions are unlikely; similarly, without temperature-sensitive trees skillful temperature reconstructions are un-likely. This might at first appear to be an obvious observation. It is nevertheless important to recall that PDSI and SPEI are both dependent on temperature through their incorporation of potential evapotranspiration. Therefore it might be possi-ble in principle for tree rings to reconstruct both temperature and moisture indices equally well regardless of whether the trees are moisture or temperature limited. To the contrary, our experiments suggest that this is not the case. Based on these experimental results, we recommend that future DA-based hydroclimate reconstructions use a spatial mixture of temperatu and moistusensitive trees if the goal is to re-construct both temperature and hydroclimate indices (as hap-pens to be the case over western North America in our periments). Where this is impossible, our pseudoproxy ex-periments suggest that reconstruction skill will be signifi-cantly diminished for the target variable not represented by the proxy network.
4 Regional hydroclimate reconstructions
Given the above demonstrations of global reconstruction skill, we now showcase two regional examples that explore
the driving dynamics of multiyear droughts in the North American Southwest and equatorial East Africa within the pseudoproxy reconstructions.
Figure 5.Reconstruction skill, correlation (r), and the mean continuous ranked probability skill score (CRPSS) for the standardized precip-itation evapotranspiration index (SPEI) with a 12-month decaying exponential weighting kernel; cf. Figs. 2 and 4.
Figure 6. North American Southwest area-averaged JJA PDSI in the reconstruction mean (purple) and the climate model truth (black). Both time series have been smoothed with an 11-year mov-ing average (Meehl and Hu, 2006). The skill metrics of correlation (r) and the mean continuous ranked probability skill score (CRPSS) for the smoothed time series are shown in the lower left corner. The five most severe multiyear droughts over this period are highlighted in corresponding colors. Reconstruction error estimates, similar to those shown in Fig. 8, have been left off to clearly show the severe drought highlighting.
we have computed here); the reconstruction using pseudo-trees alone has skill values of r=0.89 and CRPSS=0.54 (not shown). Despite the high skill of the overall reconstruc-tion, it is challenging to consistently identify the rank of the most severe droughts based on the imperfect reconstruction; this is true not only for the top 5 droughts, but also for the top 10 and 15. This is due to the fact that drought identifi-cation and ranking procedures (Meehl and Hu, 2006; Coats
et al., 2013) tend to be sensitive to the precise zero crossings of the hydroclimate time series that set the beginning or end-ing of a drought (thus affectend-ing both the identification and subsequent ranking); for example, the mid- to late-1300s-era drought in Fig. 6 is cut short in the reconstruction because of a zero crossing of the PDSI values near the middle of the true drought.
recon-Figure 7.Power spectral density of the true model Nino 3.4 index time series along with the reconstructions based on pseudo-trees and pseudo-corals (purple) and pseudo-trees alone (green).
struction can provide meaningful monthly states for this vari-able (Tardif et al., 2014; Steiger and Hakim, 2016). The re-sults of the reconstructions using pseudo-trees alone is also particularly important given that coral records are generally short and not extant over more than a few centuries.
As an analysis of the relationship between North Ameri-can Southwest drought variability and ENSO, Fig. 9 shows the monthly percent occurrence of El Niño or La Niña states during the 15 most severe multiyear droughts (spanning droughts of 9 to 38 years in length). The El Niño and La Niña states are defined as the months for which the SST anomaly exceeds 0.5 and −0.5◦C, respectively. Figure 9a shows how the percent occurrence for each drought recon-struction compares to the true percent occurrence, while Fig. 9b shows the distribution of all 15 droughts for the truth and the two reconstructions. This figure illustrates that in the CESM LME simulation, multiyear droughts are associ-ated with an above-average occurrence of La Niña states. This relationship is consistent with observations and histori-cal model simulations, which show that cooler La Niña-like SSTs in the tropical Pacific tend to shift the storm track over North America polewards, leading to a drying of the Amer-ican Southwest (Seager and Hoerling, 2014). In a paleocli-mate context, it has also been inferred that increased inci-dences of La Niña events have likely driven megadroughts in western North America over the last 1000 years (Coats et al., 2016). Additionally, last-millennium simulations of the CESM model have also been shown to have the strongest relationship between ENSO and drought in the American Southwest compared to other CMIP5-class models (Coats et al., 2015, 2016). These results thus collectively indicate that drought reconstructions and specific driving dynamics can be successfully investigated within a DA-based recon-struction.
(a)
(b)
o
o
Figure 8.Monthly reconstruction of Nino 3.4 index during the most severe drought period in the reconstruction(a)using both pseudo-trees and pseudo-corals and(b)using only pseudo-trees. The 2σ uncertainty estimates are derived from both the Monte Carlo recon-struction iterations and the posterior distribution; see Sect. 2.4 for details.
4.2 Equatorial East Africa multiyear drought
The next reconstruction illustration we consider is multi-year drought in equatorial East Africa. Specifically, we ex-plore where drought is occurring and its plausible large-scale drivers according to the CESM LME simulations. Similar to the results shown in Sect. 4.1, we use drought dynamics in East Africa as an example of what can be reconstructed using the DA method. We additionally provide a dynamical analysis that would be the starting point for a region-specific analysis that could be performed based on a real-proxy re-construction. The choice of this region is motivated by the observation that the spatial drought index reconstructions, Figs. 4 and 5, show skillful drought reconstructions in East-ern Africa and because tropical dynamics and variables are generally better reconstructed than midlatitude variables and dynamics in global, DA-based reconstructions (see, for ex-ample, Fig. 2 and Steiger et al., 2014; Hakim et al., 2016).
Figure 9.(a)Monthly percent occurrence of El Niño or La Niña states during the 15 most severe multiyear droughts. The occurrences are computed as a percentage of the total number of months in a given drought. Dashed lines indicate the average percent occurrence of El Niño (red) or La Niña (blue) in the CESM LME simulation 10.(b)Box plot distribution summaries of the monthly percent occurrence of El Niño or La Niña states shown in panel(a). Light gray lines indicate the means and the darker colors indicate 1 standard deviation of the data, while the lighter colors indicate the 95 % confidence intervals of the mean. The letters LN and EN stand for La Niña and El Niño, while the letters T and C indicate experiments with pseudo-trees or pseudo-corals. “LN” and “EN” by themselves are the true La Niña and El Niño occurrences (gray box plots) corresponding to the distribution of filled circles in panel(a).
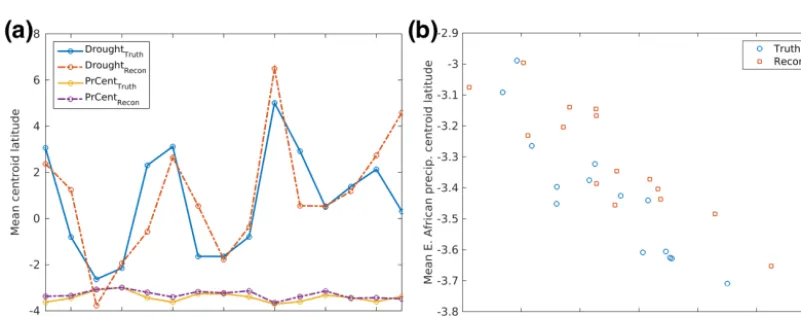
Figure 10. The latitude locations of the zonal mean multiyear drought and precipitation centroids (PrCent) for both the truth and the reconstruction over equatorial East Africa. Panel(a)shows the centroid locations as a function of drought severity rank, while panel(b)has the same information but more clearly shows the negative correlation between the locations of drought and precipitation centroids.
in the ITCZ (see Chiang and Friedman, 2012, for a re-view). Here we explore how a common indicator of the lo-cation of the ITCZ, the zonal precipitation centroid (Frier-son and Hwang, 2012), is related the location of East African droughts. We calculate the precipitation centroid as the center of mass of the zonal mean precipitation within the latitudinal range of 20◦N–20◦S and the longitudinal range of 28–52◦E; as seen in Fig. 1 this boxed area is centered over Eastern Africa and includes precipitation over both land and ocean. We construct a similar drought location index by computing
the centroid of the zonal mean negative SPEI values over the continental African land area within this East African box. We use SPEI for this region because some work indicates that it may be better suited to drought assessments in East Africa than PDSI (Ntale and Gan, 2003), though the results shown in this section are not dependent on the choice of drought variable.
this figure shows the mean latitudinal location of the pre-cipitation centroid averaged over each of the drought peri-ods. The locations of the two centroids are well matched to the truth in the reconstruction. Furthermore, Fig. 10b shows that these two centroids are negatively correlated (in both the truth and the reconstructions), indicating that as the average precipitation shifts south in CESM, drought occurs in the north and vice versa. Because the zonal mean precipitation is strongly peaked in the annual mean with more variability in the wings of the zonal mean distribution, small changes in the precipitation centroid can lead to larger changes in the lo-cation of drought (Fig. 10a). Similar to the results presented for North America, these collective results for East Africa further illustrate the utility of DA-based reconstructions and their potential to test specific hypotheses, such as the hypoth-esis that shifts in the ITCZ can drive multiyear droughts.
5 Conclusions
Using DA for hydroclimate reconstructions is a new area of research. The aim of this paper was therefore to explore some foundational aspects of global hydroclimate reconstructions using DA. Through a set of pseudoproxy reconstruction ex-periments, we estimated a realistic upper bound on hydro-climate reconstruction skill for a global pseudoproxy net-work based on pseudo-tree rings and corals. Unlike most pseudoproxy experiments that use statistical noise perturba-tions for proxy construction, the pseudo-tree rings and corals were generated here using established proxy system models. These models are physically based and account for multiple climatic factors in proxy development.
Because these reconstruction experiments have been de-signed as upper-bound skill estimates, the results are most useful in showing where and for which variables the recon-structionslackskill. This framing allows us to highlight what is theoretically possible while also making falsifiable claims about what is impossible to reconstruct given current proxy networks. In our experiments we find that skill is highest in the tropics and in regions local to proxy sampling, in ac-cordance with many previous pseudoproxy and real-proxy reconstructions that focused on temperature or other non-hydroclimate variables (e.g., Smerdon, 2012; Steiger et al., 2014; Hakim et al., 2016; Anchukaitis et al., 2017). For tree rings (which constitute the majority of annually resolved proxies) we also find that local reconstruction skill depends on the moisture or temperature sensitivity of particular tree-ring proxies: moisture-sensitive trees are necessary for skill-ful PDSI or SPEI reconstructions, and temperature-sensitive trees are similarly necessary for skillful temperature recon-structions. The covariability of moisture and temperature is not sufficiently strong for our DA approach to reconstruct both variables equally well from a given tree. Based on these results, we recommend that future DA-based hydroclimate reconstructions use a spatial mixture of temperature- and
moisture-sensitive trees if the goal is to reconstruct both tem-perature and hydroclimate indices. Importantly, we also per-formed seasonal and monthly reconstructions and found that it is in principle possible to reconstruct non-growing season or annual mean climate variables in many regions using DA. We also found that it is possible to reconstruct a monthly Nino 3.4 index.
Two regional climate dynamics analyses also explored the key drivers of hydroclimate extremes in the North American Southwest and equatorial East Africa. These regional exam-ples highlight how DA-based reconstructions could in gen-eral be used to find the dynamical drivers of hydroclimate extremes. This information-added benefit from DA-based re-constructions is very important given that dynamical infor-mation is difficult to simultaneously obtain from a traditional reconstruction. Based on these results, the application of DA to the PAGES2k network may yield skillful hydroclimate reconstructions that will deepen our current understanding of decadal to centennial hydroclimate variability. We find that this approach can potentially yield dynamical insights about regions that have not been previously well character-ized, such as Africa.
Code availability. The code used in the production and anal-ysis of the reconstructions is available upon request from nsteiger@ldeo.columbia.edu.
Data availability. Monthly CESM LME data are available from http://www.earthsystemgrid.org. The pseudoproxies and reconstructions from this paper are publicly available at https://doi.org/10.5281/zenodo.1035402 (Steiger, 2017).
Author contributions. NJS and JES designed the experiments and prepared the paper. NJS developed the code, ran the experi-ments, and analyzed the experimental results.
Competing interests. The authors declare that they have no con-flict of interest.
Acknowledgements. We acknowledge the CESM1 (CAM5) Last Millennium Ensemble Community Project and the supercomputing resources provided by NSF/CISL/Yellowstone. This work was supported by the NOAA Climate and Global Change Postdoctoral Fellowship Program administered by UCAR’s Visiting Scientist Programs. This work was also supported in part by the National Science Foundation under grants AGS-1243204, AGS-1401400, AGS-1602581, and AGS-1602920. LDEO contribution number 8153.
References
Acevedo, W., Fallah, B., Reich, S., and Cubasch, U.: Assim-ilation of pseudo-tree-ring-width observations into an atmo-spheric general circulation model, Clim. Past, 13, 545–557, https://doi.org/10.5194/cp-13-545-2017, 2017.
Anchukaitis, K. J., Wilson, R., Briffa, K. R., Büntgen, U., Cook, E. R., D’Arrigo, R., Davi, N., Esper, J., Frank, D., Gunnarson, B. E., Hegerl, G., Helama, S., Klesse, S., Kru-sic, P. J., Linderholm, H. W., Myglan, V., Osborn, T. J., Zhang, P., Rydval, M., Schneider, L., Schurer, A., Wiles, G., and Zorita, E.: Last millennium Northern Hemisphere summer temperatures from tree rings: Part II, spatially re-solved reconstructions, Quaternary Sci. Rev., 163, 1–22, https://doi.org/10.1016/j.quascirev.2017.02.020, 2017.
Ault, T. R., Mankin, J. S., Cook, B. I., and Smerdon, J. E.: Relative impacts of mitigation, temperature, and precipitation on 21st-century megadrought risk in the American Southwest, Science Advances, 2, e1600873, https://doi.org/10.1126/sciadv.1600873, 2016.
Battisti, D. S. and Naylor, R. L.: Historical warnings of future food insecurity with unprecedented seasonal heat, Science, 323, 240– 244, 2009.
Beguería, S., Vicente-Serrano, S. M., Reig, F., and Latorre, B.: Stan-dardized precipitation evapotranspiration index (SPEI) revis-ited: parameter fitting, evapotranspiration models, tools, datasets and drought monitoring, Int. J. Climatol., 34, 3001–3023, https://doi.org/10.1002/joc.3887, 2014.
Belmecheri, S., Babst, F., Wahl, E. R., Stahle, D. W., and Trouet, V.: Multi-century evaluation of Sierra Nevada snowpack, Nature Climate Change, 6, 2–3, 2016.
Bradley, R. S.: Paleoclimatology, 3rd Edn., Academic Press, Ox-ford, UK, 2014.
Carton, J. A. and Giese, B. S.: A reanalysis of ocean climate using Simple Ocean Data Assimilation (SODA), Mon. Weather Rev., 136, 2999–3017, 2008.
Chiang, J. C. and Friedman, A. R.: Extratropical Cool-ing, Interhemispheric Thermal Gradients, and Tropical Cli-mate Change, Annu. Rev. Earth Pl. Sc., 40, 383–412, https://doi.org/10.1146/annurev-earth-042711-105545, 2012. Christiansen, B., Schmith, T., and Thejll, P.: A Surrogate
Ensemble Study of Climate Reconstruction Methods: Stochasticity and Robustness, J. Climate, 22, 951–976, https://doi.org/10.1175/2008JCLI2301.1, 2009.
Coats, S., Smerdon, J. E., Seager, R., Cook, B. I., and González-Rouco, J. F.: Megadroughts in southwestern North America in ECHO-G millennial simulations and their comparison to proxy drought reconstructions, J. Climate, 26, 7635–7649, 2013. Coats, S., Smerdon, J. E., Cook, B. I., and Seager, R.: Are
Simu-lated Megadroughts in the North American Southwest Forced?, J. Climate, 28, 124–142, 2015.
Coats, S., Smerdon, J. E., Cook, B. I., Seager, R., Cook, E. R., and Anchukaitis, K. J.: Internal ocean-atmosphere variability drives megadroughts in Western North America, Geophys. Res. Lett., 43, 9886–9894, https://doi.org/10.1002/2016GL070105, 2016. Cook, B. I., Ault, T. R., and Smerdon, J. E.:
Unprece-dented 21st century drought risk in the American South-west and Central Plains, Science Advances, 1, e1400082, https://doi.org/10.1126/sciadv.1400082, 2015.
Cook, B. I., Cook, E. R., Smerdon, J. E., Seager, R., Williams, A. P., Coats, S., Stahle, D. W., and Díaz, J. V.: North American megadroughts in the Common Era: reconstructions and simula-tions, Wiley Interdisciplinary Reviews: Climate Change, 7, 411– 432, 2016.
Cook, E. R., Seager, R., Cane, M. A., and Stahle, D. W.: North American drought: Reconstructions, causes, and consequences, Earth-Sci. Rev., 81, 93–134, https://doi.org/10.1016/j.earscirev.2006.12.002, 2007.
Cook, E. R., Anchukaitis, K. J., Buckley, B. M., D’Arrigo, R. D., Jacoby, G. C., and Wright, W. E.: Asian Monsoon Failure and Megadrought During the Last Millennium, Science, 328, 486– 489, https://doi.org/10.1126/science.1185188, 2010a.
Cook, E. R., Seager, R., Heim, R. R., Vose, R. S., Herweijer, C., and Woodhouse, C.: Megadroughts in North America: Placing IPCC projections of hydroclimatic change in a long-term palaeoclimate context, J. Quaternary Sci., 25, 48–61, 2010b.
Cook, E. R., Palmer, J. G., Ahmed, M., Woodhouse, C. A., Fenwick, P., Zafar, M. U., Wahab, M., and Khan, N.: Five centuries of Up-per Indus River flow from tree rings, J. Hydrol., 486, 365–375, 2013.
Cook, E. R., Seager, R., Kushnir, Y., Briffa, K. R., Büntgen, U., Frank, D., Krusic, P. J., Tegel, W., van der Schrier, G., Andreu-Hayles, L., Baillie, M., Baittinger, C., Bleicher, N., Bonde, N., Brown, D., Carrer, M., Cooper, R., ˇCufar, K., Dittmar, C., Es-per, J., Griggs, C., Gunnarson, B., Günther, B., Gutierrez, E., Haneca, K., Helama, S., Herzig, F., Heussner, K.-U., Hofmann, J., Janda, P., Kontic, R., Köse, N., Kyncl, T., Levaniˇc, T., Lin-derholm, H., Manning, S., Melvin, T. M., Miles, D., Neuwirth, B., Nicolussi, K., Nola, P., Panayotov, M., Popa, I., Rothe, A., Seftigen, K., Seim, A., Svarva, H., Svoboda, M., Thun, T., Timo-nen, M., Touchan, R., Trotsiuk, V., Trouet, V., Walder, F., Wa˙zny, T., Wilson, R., and Zang, C.: Old World megadroughts and plu-vials during the Common Era, Science Advances, 1, e1500561, https://doi.org/10.1126/sciadv.1500561, 2015.
Dee, S. G., Steiger, N. J., Emile-Geay, J., and Hakim, G. J.: On the utility of proxy system models for estimating climate states over the common era, Journal of Advances in Modeling Earth Sys-tems, 8, 1164–1179, https://doi.org/10.1002/2016MS000677, 2016.
Evans, M. N., Tolwinski-Ward, S., Thompson, D., and Anchukaitis, K. J.: Applications of proxy system modeling in high resolution paleoclimatology, Quaternary Sci. Rev., 76, 16–28, 2013. Evans, M. N., Smerdon, J. E., Kaplan, A., Tolwinski-Ward,
S. E., and González-Rouco, J. F.: Climate field reconstruc-tion uncertainty arising from multivariate and nonlinear prop-erties of predictors, Geophys. Res. Lett., 41, 9127–9134, https://doi.org/10.1002/2014GL062063, 2014.
Fernández-Donado, L., González-Rouco, J. F., Raible, C. C., Am-mann, C. M., Barriopedro, D., García-Bustamante, E., Jungclaus, J. H., Lorenz, S. J., Luterbacher, J., Phipps, S. J., Servonnat, J., Swingedouw, D., Tett, S. F. B., Wagner, S., Yiou, P., and Zorita, E.: Large-scale temperature response to external forcing in simu-lations and reconstructions of the last millennium, Clim. Past, 9, 393–421, https://doi.org/10.5194/cp-9-393-2013, 2013. Frierson, D. M. and Hwang, Y.-T.: Extratropical influence on ITCZ
Gneiting, T. and Raftery, A. E.: Strictly proper scoring rules, pre-diction, and estimation, J. Am. Stat. Assoc., 102, 359–378, 2007. Gneiting, T., Raftery, A. E., Westveld III, A. H., and Goldman, T.: Calibrated probabilistic forecasting using ensemble model output statistics and minimum CRPS estimation, Mon. Weather Rev., 133, 1098–1118, 2005.
Gómez-Navarro, J. J., Werner, J., Wagner, S., Luterbacher, J., and Zorita, E.: Establishing the skill of climate field reconstruc-tion techniques for precipitareconstruc-tion with pseudoproxy experiments, Clim. Dynam., 45, 1395–1413, 2015.
Goosse, H., Crespin, E., Dubinkina, S., Loutre, M.-F., Mann, M. E., Renssen, H., Sallaz-Damaz, Y., and Shindell, D.: The role of forcing and internal dynamics in explaining the Medieval Cli-mate Anomaly, Clim. Dynam., 39, 2847–2866, 2012.
Hakim, G. J., Emile-Geay, J., Steig, E. J., Noone, D., An-derson, D. M., Tardif, R., Steiger, N., and Perkins, W. A.: The Last Millennium Climate Reanalysis Project: Framework and First Results, J. Geophys. Res.-Atmos., 121, 6745–6764, https://doi.org/10.1002/2016JD024751, 2016.
Harris, I., Jones, P., Osborn, T., and Lister, D.: Updated high-resolution grids of monthly climatic observations – the CRU TS3.10 Dataset, Int. J. Climatol., 34, 623–642, https://doi.org/10.1002/joc.3711, 2014.
Houtekamer, P. L. and Mitchell, H. L.: Data Assimila-tion Using an Ensemble Kalman Filter Technique, Mon. Weather Rev., 126, 796–811, https://doi.org/10.1175/1520-0493(1998)126<0796:DAUAEK>2.0.CO;2, 1998.
Jacoby Jr., G. C.: Long-term surface-water supply and streamflow trends in the Upper Colorado River basin based on tree-ring anal-yses, Natl. Sci. Found. Lake Powell Res. Proj. Bull, 18, 1–70, 1976.
Kalnay, E.: Atmospheric modeling, data assimilation and pre-dictability, Cambridge University Press, Cambridge, UK, 2003. Lintner, B. R. and Neelin, J. D.: Time Scales and Spatial Patterns of
Passive Ocean–Atmosphere Decay Modes, J. Climate, 21, 2187– 2203, 2008.
Mann, M. E., Rutherford, S., Wahl, E., and Ammann, C.: Testing the fidelity of methods used in proxy-based reconstructions of past climate, J. Climate, 18, 4097–4107, 2005.
Mann, M. E., Rutherford, S., Wahl, E., and Ammann, C.: Robustness of proxy-based climate field reconstruc-tion methods, J. Geophys. Res.-Atmos., 112, d12109, https://doi.org/10.1029/2006JD008272, 2007.
Masson-Delmotte, V., Schulz, M., Abe-Ouchi, A., Beer, J., Ganopolski, A., González Rouco, J., Jansen, E., Lambeck, K., Luterbacher, J., Naish, T., Osborn, T., Otto-Bliesner, B., Quinn, T., Ramesh, R., Rojas, M., Shao, X., and Timmerman, A.: Cli-mate Change 2013: The Physical Science Basis. Contribution of Working Group I to the Fifth Assessment Report of the Intergov-ernmental Panel on Climate Change, chap. “Information from Paleoclimate Archives”, 383–464, Cambridge University Press, Cambridge, UK and New York, NY, USA, 2013.
Matsikaris, A., Widmann, M., and Jungclaus, J.: On-line and off-line data assimilation in palaeoclimatology: a case study, Clim. Past, 11, 81–93, https://doi.org/10.5194/cp-11-81-2015, 2015. Meehl, G. A. and Hu, A.: Megadroughts in the Indian monsoon
region and southwest North America and a mechanism for asso-ciated multidecadal Pacific sea surface temperature anomalies, J. Climate, 19, 1605–1623, 2006.
Neukom, R., Rohrer, M., Calanca, P., Salzmann, N., Huggel, C., Acuña, D., Christie, D. A., and Morales, M. S.: Facing unprece-dented drying of the Central Andes? Precipitation variability over the period AD 1000–2100, Environ. Res. Lett., 10, 084017, https://doi.org/10.1088/1748-9326/10/8/084017, 2015.
Ntale, H. K. and Gan, T. Y.: Drought indices and their ap-plication to East Africa, Int. J. Climatol., 23, 1335–1357, https://doi.org/10.1002/joc.931, 2003.
Okazaki, A. and Yoshimura, K.: Development and evaluation of a system of proxy data assimilation for paleoclimate recon-struction, Clim. Past, 13, 379–393, https://doi.org/10.5194/cp-13-379-2017, 2017.
Otto-Bliesner, B. L., Brady, E. C., Fasullo, J., Jahn, A., Landrum, L., Stevenson, S., Rosenbloom, N., Mai, A., and Strand, G.: Cli-mate Variability and Change since 850 CE: An Ensemble Ap-proach with the Community Earth System Model, B. Am. Me-teorol. Soc., 97, 735–754, https://doi.org/10.1175/BAMS-D-14-00233.1, 2016.
PAGES2k Consortium: A global multiproxy database for temper-ature reconstructions of the Common Era, Scientific Data, 4, https://doi.org/10.1038/sdata.2017.88, 2017.
Palmer, J. G., Cook, E. R., Turney, C. S., Allen, K., Fenwick, P., Cook, B. I., O’Donnell, A., Lough, J., Grierson, P., and Baker, P.: Drought variability in the eastern Australia and New Zealand summer drought atlas (ANZDA, CE 1500–2012) modulated by the Interdecadal Pacific Oscillation, Environ. Res. Lett., 10, 124002, https://doi.org/10.1088/1748-9326/10/12/124002, 2015. Seager, R. and Hoerling, M.: Atmosphere and Ocean Origins of
North American Droughts, J. Climate, 27, 4581–4606, 2014. Seager, R., Kushnir, Y., Herweijer, C., Naik, N., and Velez, J.:
Mod-eling of Tropical Forcing of Persistent Droughts and Pluvials over Western North America: 1856–2000, J. Climate, 18, 4065– 4088, https://doi.org/10.1175/JCLI3522.1, 2005.
Smerdon, J. E.: Climate models as a test bed for climate reconstruc-tion methods: pseudoproxy experiments, Wiley Interdisciplinary Reviews: Climate Change, 3, 63–77, 2012.
Smerdon, J. E., Kaplan, A., Chang, D., and Evans, M. N.: A Pseu-doproxy Evaluation of the CCA and RegEM Methods for Recon-structing Climate Fields of the Last Millennium, J. Climate, 24, 1284–1309, 2011.
Smerdon, J. E., Luterbacher, J., Phipps, S. J., Anchukaitis, K. J., Ault, T., Coats, S., Cobb, K. M., Cook, B. I., Colose, C., Fe-lis, T., Gallant, A., Jungclaus, J. H., Konecky, B., LeGrande, A., Lewis, S., Lopatka, A. S., Man, W., Mankin, J. S., Maxwell, J. T., Otto-Bliesner, B. L., Partin, J. W., Singh, D., Steiger, N. J., Stevenson, S., Tierney, J. E., Zanchettin, D., Zhang, H., Atwood, A. R., Andreu-Hayles, L., Baek, S. H., Buckley, B., Cook, E. R., D’Arrigo, R., Dee, S. G., Griffiths, M., Kulkarni, C., Kushnir, Y., Lehner, F., Leland, C., Linderholm, H. W., Okazaki, A., Palmer, J., Piovano, E., Raible, C. C., Rao, M. P., Scheff, J., Schmidt, G. A., Seager, R., Widmann, M., Williams, A. P., and Xoplaki, E.: Comparing proxy and model estimates of hydroclimate vari-ability and change over the Common Era, Clim. Past Discuss., https://doi.org/10.5194/cp-2017-37, in review, 2017.
colo-nial, and modern eras, Quaternary Sci. Rev., 149, 34–60, https://doi.org/10.1016/j.quascirev.2016.06.018, 2016.
Steiger, N. J.: Pseudoproxies for the paper “A pseudoproxy assessment of data assimilation for reconstructing the atmosphere–ocean dynamics of hydroclimate extremes”, https://doi.org/10.5281/zenodo.1035402, 2017.
Steiger, N. and Hakim, G.: Multi-timescale data assimilation for atmosphere–ocean state estimates, Clim. Past, 12, 1375–1388, https://doi.org/10.5194/cp-12-1375-2016, 2016.
Steiger, N. J., Hakim, G. J., Steig, E. J., Battisti, D. S., and Roe, G. H.: Assimilation of time-averaged pseudo-proxies for climate reconstruction, J. Climate, 27, 426–441, https://doi.org/10.1175/JCLI-D-12-00693.1, 2014.
Steiger, N. J., Steig, E. J., Dee, S. G., Roe, G. H., and Hakim, G. J.: Climate reconstruction using data assimilation of water-isotope ratios from ice cores, J. Geophys. Res.-Atmos., 122, 1545–1568, https://doi.org/10.1002/2016JD026011, 2017.
Stevenson, S., Otto-Bliesner, B., Fasullo, J., and Brady, E.: “El Nino Like” Hydroclimate Responses to Last Millennium Vol-canic Eruptions, J. Climate, 29, 2907–2921, 2016.
Tardif, R., Hakim, G., and Snyder, C.: Coupled atmosphere-ocean data assimilation experiments with a low-order model and CMIP5 model data, Clim. Dynam., 45, 1415–1427, https://doi.org/10.1007/s00382-014-2390-3, 2014.
Thompson, D. M., Ault, T. R., Evans, M. N., Cole, J. E., and Emile-Geay, J.: Comparison of observed and simulated tropical climate trends using a forward model of coralδ18O, Geophys. Res. Lett., 38, l14706, https://doi.org/10.1029/2011GL048224, 2011. Tierney, J. E., Russell, J. M., Huang, Y., Damsté, J. S. S.,
Hop-mans, E. C., and Cohen, A. S.: Northern hemisphere controls on tropical southeast African climate during the past 60,000 years, Science, 322, 252–255, 2008.
Tierney, J. E., Lewis, S. C., Cook, B. I., LeGrande, A. N., and Schmidt, G. A.: Model, proxy and isotopic perspectives on the East African Humid Period, Earth Planet. Sc. Lett., 307, 103– 112, 2011.
Tolwinski-Ward, S. E., Evans, M. N., Hughes, M. K., and An-chukaitis, K. J.: An efficient forward model of the climate controls on interannual variation in tree-ring width, Clim. Dy-nam., 36, 2419–2439, https://doi.org/10.1007/s00382-010-0945-5, 2011.
Tolwinski-Ward, S. E., Anchukaitis, K. J., and Evans, M. N.: Bayesian parameter estimation and interpretation for an inter-mediate model of tree-ring width, Clim. Past, 9, 1481–1493, https://doi.org/10.5194/cp-9-1481-2013, 2013.
Wang, J., Emile-Geay, J., Guillot, D., Smerdon, J. E., and Rajarat-nam, B.: Evaluating climate field reconstruction techniques using improved emulations of real-world conditions, Clim. Past, 10, 1– 19, https://doi.org/10.5194/cp-10-1-2014, 2014.
Wang, J., Emile-Geay, J., Guillot, D., McKay, N. P., and Rajarat-nam, B.: Fragility of reconstructed temperature patterns over the Common Era: Implications for model evaluation, Geophys. Res. Lett., 42, 7162–7170, https://doi.org/10.1002/2015GL065265, 2015.
Werner, J. P., Luterbacher, J., and Smerdon, J. E.: A pseudoproxy evaluation of Bayesian hierarchical modeling and canonical cor-relation analysis for climate field reconstructions over Europe, J. Climate, 26, 851–867, 2013.