https://doi.org/10.5194/se-10-59-2019
© Author(s) 2019. This work is distributed under the Creative Commons Attribution 4.0 License.
A multi-technology analysis of the 2017 North Korean nuclear test
Peter Gaebler1, Lars Ceranna1, Nima Nooshiri2, Andreas Barth3, Simone Cesca2, Michaela Frei1, Ilona Grünberg1, Gernot Hartmann1, Karl Koch1, Christoph Pilger1, J. Ole Ross1, and Torsten Dahm2
1BGR, Federal Institute for Geosciences and Natural Resources, Hannover, Germany 2GFZ, German Research Centre for Geosciences, Potsdam, Germany
3KIT, Karlsruhe Institute of Technology, Karlsruhe, Germany
Correspondence:Peter Gaebler ([email protected])
Received: 21 September 2018 – Discussion started: 1 October 2018
Revised: 11 December 2018 – Accepted: 16 December 2018 – Published: 15 January 2019
Abstract. On 3 September 2017 official channels of the Democratic People’s Republic of Korea announced the suc-cessful test of a thermonuclear device. Only seconds to min-utes after the alleged nuclear explosion at the Punggye-ri nuclear test site in the mountainous region in the country’s northeast at 03:30:02 (UTC), hundreds of seismic stations distributed all around the globe picked up strong and distinct signals associated with an explosion. Different seismological agencies reported body wave magnitudes of well above 6.0, consequently estimating the explosive yield of the device on the order of hundreds of kT TNT equivalent. The 2017 event can therefore be assessed as being multiple times larger in energy than the two preceding North Korean events in Jan-uary and September 2016.
This study provides a multi-technology analysis of the 2017 North Korean event and its aftermath using a wide ar-ray of geophysical methods. Seismological investigations lo-cate the event within the test site at a depth of approximately 0.6 km below the surface. The radiation and generation of P- and S-wave energy in the source region are significantly influenced by the topography of the Mt. Mantap massif. In-versions for the full moment tensor of the main event re-veal a dominant isotropic component accompanied by sig-nificant amounts of double couple and compensated linear vector dipole terms, confirming the explosive character of the event. The analysis of the source mechanism of an aftershock that occurred around 8 min after the test in the direct vicinity suggest a cavity collapse. Measurements at seismic stations of the International Monitoring System result in a body wave magnitude of 6.2, which translates to an yield estimate of around 400 kT TNT equivalent. The explosive yield is pos-sibly overestimated, since topography and depth phases both
tend to enhance the peak amplitudes of teleseismic P waves. Interferometric synthetic aperture radar analysis using data from the ALOS-2 satellite reveal strong surface deforma-tions in the epicenter region. Additional multispectral optical data from the Pleiades satellite show clear landslide activ-ity at the test site. The strong surface deformations generated large acoustic pressure peaks, which were observed as infra-sound signals with distinctive waveforms even at distances of 401 km. In the aftermath of the 2017 event, atmospheric traces of the fission product133Xe were detected at various locations in the wider region. While for133Xe measurements in September 2017, the Punggye-ri test site is disfavored as a source by means of atmospheric transport modeling, detec-tions in October 2017 at the International Monitoring System station RN58 in Russia indicate a potential delayed leakage of133Xe at the test site from the 2017 North Korean nuclear test.
1 Introduction
Sys-60 P. Gaebler et al.: Multi-technology analysis of the 2017 North Korean nuclear test
tem (IMS) was established by the CTBTO as part of a verifi-cation regime. The IMS features four different approaches for the monitoring of potential nuclear explosions. Three methods (seismology, infrasound, and hydroacoustics) are at-tributed to waveform technologies and have the purpose of detecting, localizing, and identifying suspicious events with an explosive source mechanism. The fourth approach fea-tures the monitoring of particulate radionuclides and noble gases in the atmosphere and potentially provides unambigu-ous evidence of the nuclear character of an explosion. To as-sess the connection between radionuclide detections and po-tential source events, atmospheric transport modeling (ATM) is applied. Grouping data from different IMS technologies that is attributed to the same critical event is referred to as data fusion. For further information on the CTBT, the IMS, and the German National Data Center, the reader is referred to Pilger et al. (2017) or CTBTO (2018).
Since the first known nuclear test, carried out by the Unites States in 1945, more than 2000 confirmed nuclear explosion tests were conducted by China, France, Great Britain, India, North Korea, Pakistan, Russia, and the United States. It is generally accepted that all six past explosions in North Ko-rea between 2006 and 2017 have been nuclear underground tests. This study therefore refers to the events in North Korea as nuclear tests, even though definitive proof may be miss-ing. North Korea is the only country breaking the de facto moratorium on nuclear tests. For detailed information on the first five North Korean tests, see for example Hartmann et al. (2017).
All past North Korean nuclear tests were conducted at the Punggye-ri test site in the vicinity of Mt. Mantap in the north-eastern part of the country. Following the geologic descrip-tion of the test site area provided by Coblentz and Pabian (2015) and Pabian and Coblentz (2017), Mt. Mantap is made up of two distinct geologic formations. The core of the moun-tain consists of igneous basement rock of either diorite or granite, while the top is capped by a thin layer of basaltic lava flows. The basement crystalline rock and the top layer of Mt. Mantap are separated by a nearly horizontal sequence of volcanic deposits with a thickness of around 200 m. The origin of these deposits is suspected to be volcanic ash from Mt. Paektu, a volcano located around 100 km northeast. Due to their loose consolidation, the volcanic deposits are softer then the basement rock or the basaltic layer and are therefore more susceptible to erosion. Furthermore, the volcanic layer is more exposed to erosional scars and landslides due to its steeper slope. The erosion of the volcanic layer can cause the overlaying basalt cap to break off at the scarp, which is vis-ible in larger piles below the volcanic layer where the slope of the mountain decreases slightly.
The official channels of North Korea announced the 2017 event as a successful test of a fusion bomb (Korean Cen-tral News Agency, 2017). This would be a major step in the nuclear program of North Korea. From a scientific point of view, therefore, the depth of the event, its strength in terms
of radiated high- and low-frequency seismic energy, the con-tribution of possible faulting or slope instability processes, the near-surface damage in the test area, and the proof of whether fission products are detected as atmospheric trac-ers are key questions to be answered. These questions are approached by an integrated study based on different seis-mological (Sect. 2), infrasound (Sect. 3), remote-sensing (Sect. 4), radionuclide monitoring (Sect. 5), and modeling techniques which complement each other. As there is no easy concept to verify and characterize nuclear explosions, espe-cially in a country where direct observations are difficult to assess, this study demonstrates and emphasizes the strength of an integrated multi-technology approach.
In this context, new methodical approaches are introduced to improve the depth estimate from teleseismic observations and to quantify uncertainties in the non-isotropic source com-ponent. The seismological study retrieves an independent ab-solute location based on a combination of seismological and remote-sensing data. The relative location between the six North Korean nuclear tests is obtained by means of waveform cross-correlation time lag data. The event depth is estimated for the first time by a joint inversion of source time func-tion (STF) and waveform composifunc-tion of direct and depth phases observed at small aperture, high-frequency arrays at teleseimsic distances. A full waveform moment tensor inver-sion (MTI) is applied and compared to results of previous explosions in North Korea. The source time overshoot and peak amplitude are compared to traditional body wave mag-nitude (mb) estimates. Additionally, the effect of topography on peak amplitudes is estimated by 2-D-waveform modeling to assess the possible range of explosive yield. Infrasound observations and modeling are used to understand the earth– atmosphere coupling and the propagation of infrasound from the North Korean test site. The analysis of satellite-based remote-sensing data is important to improve the absolute lo-cation of shallow sources as well as to quantify the secondary mass movement effects at the surface. Radionuclide moni-toring demonstrates the importance of ATM to avoid over-interpretation of variations in 133Xe concentrations. While radionuclide monitoring provides the only direct evidence of nuclear explosions, it is demonstrated by careful modeling how difficult it is to interpret such data and that early claims of causal anomalies have possibly been over-interpreted.
2 Seismological investigations 2.1 Epicenter location
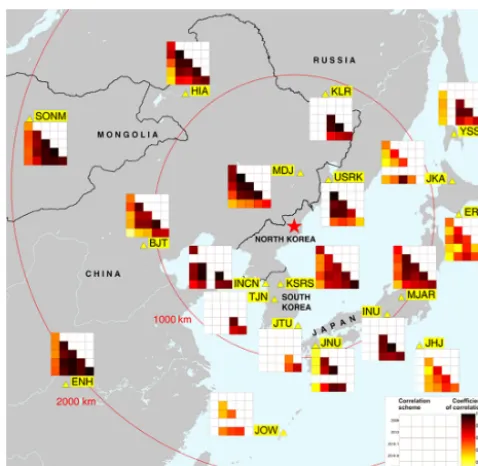
IMS stations are located at distances of 400 up to 2100 km (see Fig. 1a).
However, the incorporation of 25 additional seismic sta-tions at regional distances cannot significantly improve the absolute location estimate, as the closest station MDJ is still 372 km away from the test site. Due to these large source– receiver distances, a further improvement of the absolute location accuracy is limited. Nevertheless, relative location methods can be applied for a high-precision localization of the events (Zhang and Wen, 2013; Zhao et al., 2014, 2016; Gibbons et al., 2017). In this study a relative location pro-cedure based on the cross correlation of seismograms from 33 regional seismic stations for the six North Korean tests is applied. Seismograms for the past North Korean events significantly vary between the stations, due to propagation paths from source to the surrounding stations at different dis-tances and azimuths. However, the correlation of the seis-mograms of the six events for each individual station shows a good coherence between the corresponding signals, with the Pn phase being the most pronounced arrival in the wave-forms. These signals are correlated for each individual sta-tion, which has recorded at least two North Korean nuclear tests. The cross correlation between each pair of events is performed using normalization to 1.0 for the autocorrelation of each signal at zero lag. Maximum correlation values of 0.7 to 0.99 are obtained for stations of up to 1100 km dis-tance for the four tests in the years 2009, 2013, and 2016. Due to significant differences in explosive yield, and there-fore different source time durations, the 2006 and 2017 tests are slightly less correlated with the other tests. See Fig. 2 for the complete results of the cross-correlation analysis.
The estimation of time lags turned out to be reliable, when the maximum cross-correlation values exceeded a threshold of 0.4. With this constraint, a subset of 165 event pairs for 19 stations was selected, for which precise travel-time dif-ferences with an accuracy on the order of the sampling rate used of 0.025 s could be determined. Pn-phase onset times of all tests are aligned to the onset at the closest station MDJ and fixed as relative start time for the estimation of the cor-relation time lags at the other stations. A double-difference method (e.g., Waldhauser and Ellsworth, 2000) is applied to cross-correlation time lags and results suggest that the last five events are located within a radius of 400 m, while the 2006 test is located around 2 km further to the east (see Fig. 1b). The relative locations of the six tests can be asso-ciated with absolute coordinates as soon as the geographical coordinates of one of the tests are known. The geographic, absolute location of the January 2016 nuclear explosion is fixed by means of radar interferometry data to the location of the maximum surface deformation observed after the test (Hartmann et al., 2017; Wei, 2017). The absolute epicenter location of the 2017 test from relative location procedures is consequently determined to be 41.3007◦N, 129.0728◦E (Fig. 1b).
2.2 Estimation of hypocenter depth and seismic moment
The source depth is needed to estimate the explosion process and strength of the seismic source. However, constraining the depth of a shallow source is difficult from regional and tele-seismic data without a close station within a focal depth’s dis-tance from the source. The modeling of the wavelet consist-ing of a surface-reflected P phase, the so-called depth phase, and STF can potentially help in such a case. Such a wavelet modeling approach resembles the inverted and time-shifted STF and needs high-frequency waveforms above 1 Hz to re-solve the onset of the depth phase, and it may be difficult to perform this from single station recordings if the signal-to-noise ratio (SNR) is poor at teleseimsic distances. An ap-proach uncommon for nuclear test studies is used, which was established for the analysis of induced seismicity, where waveform beams are calculated at several small-aperture, short-period arrays to enhance the SNR (Fig. 3a).
The beam waveforms represent a superposition of direct and reflected waves. The depth of the explosion is esti-mated by comparing observed and synthetic beam wave-forms (Fig. 3d), which are calculated for the best moment tensor solution described in Sect. 2.3, a common STF and varying depths. The source time is represented as a compo-sition of multiple basis functions with unknown weighting coefficients, which are estimated in a least squares inversion with a smoothing constraint (Fig. 4). Ifu(t )is the seismo-gram (beam) at the array with coordinatesrr and from a seis-mic source with coordinatesrs, the P-wave train (i.e., P plus pP plus sP phase) at timetis represented by
u(t )=Mj kGj,k(rs,rr, t ) ·m(t ), (1) where·is a time convolution and where the summation con-vention is applied. Gj,k are the spatial derivatives of the Green’s function, where the comma before index,kindicates a spatial derivative with respect toxk. It is assumed that all moment tensor componentsMj khave the same time depen-dency, which is described as normalized moment function m(t )withm(t→ ∞)=1. The displacement in the far field is controlled by the time derivative ofm(t ), which is declared as moment rate functionm(t ). This explains that the far-field˙
body wave pulses from earthquakes are single-sided pulses (Dahm and Krüger, 2014). Since only the far-field wave field is considered, the Green’s functions in Eq. (1) are replaced by far-field Green’s functionsG(ff), andm(t )is replaced by
˙
m(t ). The inversion is set up form(t )˙ using a set ofN time-shifted triangular basis functionshl(t )(Fig. 4):
˙
m(t )=
N X
l=1
βlhl(t ), (2)
where βl is a weighting factor and each hl(t ) satisfies R
62 P. Gaebler et al.: Multi-technology analysis of the 2017 North Korean nuclear test
Figure 1. (a)Seismic stations of the International Monitoring System and other earthquake monitoring networks within a radius of 2100 km from the North Korean Punggye-ri nuclear test site. Stations that are used in the moment tensor analysis in Sect. 2.3 are marked with a small yellow dot.(b)Zoom into the Punggye-ri test site area. Numbered circles indicate the absolute locations of the six North Korean nuclear tests. The relative location error for each test is less than 100 m. The dashed line marks the profile used in Sect. 2.5 to study topographic influence of the Mt. Mantap on seismic energy generation and radiation from the test.
Hence, Eq. (1) is written as
u(t )=nMj kG(ff)j,k(t ) o
· h1(t ) h2(t ) . . . hN(t )
·
β1 β2 .. . βN
. (3)
The convolution in Eq. (3) can be written in discrete form, leading to an overdetermined matrix system for unknown weighting factors to be solved in a least squares sense us-ing theL2norm (Dahm and Krüger, 2014). If more than one array is available, the equations are added to the coefficient matrix to realize a joint inversion. Additionally, the STF in-version is stabilized by using a regularization with a rough-ness matrix. The STF is inverted for every single trial depth. The length of the STF is constrained to 1.5 s, where 0.5 s is considered before the arrival of the P wave. It should be noted that, with a shorter length of STF, the details of the STF with a complex structure are difficult to resolve. On the other hand, with longer length of the STF, i.e., a larger number of basis functions, the fitted curve oscillates wildly and gives a very poor representation of the model; this is known as over-fitting. The length of the STF mentioned before was chosen to reach a compromise, after examining the residual misfit in total signal variance computed for different lengths of source time function. In order to compensate for travel-time resid-uals occurring along the mantle ray, zero-lag Green’s func-tions are correlated with P-wave beams at every array and the travel-time corrections are considered before the
inver-sion. The source depth itself is estimated using a grid search approach, where the depth of the point source Green’s func-tions is sampled from 0 to 1500 m in 100 m steps. For every depth solution the residuals are estimated and stored for final evaluation.
Green’s functions are calculated using the code QSEIS (Wang, 1999), where source- and station-specific crustal models can be considered. AK135 (Kennett et al., 1995) is used for the mantle, while different crustal profiles for source and station regions are taken from CRUST 2.0 (Bassin et al., 2000). Intrinsic attenuation for P waves is set to 5000, since otherwise high frequencies are damped out at teleseismic dis-tances. The sampling frequency is 20 Hz. The grid search depth phase modeling has been applied previously to differ-ent cases of induced seismicity (Dahm et al., 2007) and the 2016 nuclear explosion (Cesca et al., 2017), but the simulta-neous STF inversion is implemented for the first time in this study.
Figure 2.Maximum correlation coefficients for the coherence of the Pn phase for all available pairs of nuclear tests at 18 stations at regional distances of up to 2100 km. Due to their similar size in ex-plosive yield, the four tests in the years 2009, 2013, and 2016 have a similar source mechanism and consequently show high maximum correlation coefficients between 0.70 and 0.99. The seismic signals for the 2006 and 2017 test are in general less correlated with the other tests due to the different source durations suspected for these two events. The 2006 and 2017 tests are the smallest and largest explosion, respectively.
and moment function, which show a clear double pulse and overshoot, respectively (Fig. 3c). Such an overshoot is not ex-pected for the rupture process of tectonic earthquakes, where the moment rate and moment functions of the P wave are single-sided pulses and monotonously increasing functions, respectively. For nuclear explosions, however, this feature is commonly observed. This can be explained by at least a par-tial collapse of the explosion cavity immediately after the ex-plosion. In this case, the final moment is only 23 % of the peak moment in Fig. 3c. The inversion of long-period waves led to a seismic moment M0 of 2.33×10¹⁷Nm, represent-ing the time after the overshoot. The peak seismic moment is thus estimated in the range ofM0,peak≈1.02×10¹⁸Nm. The associated low- and high-frequency moment magnitudes (Mw) areMw=5.55 andM
(peak)
w =5.97, respectively, and can explain the large difference between the long-periodMw and the high-frequencymbestimates which emerged during the magnitude estimation described in Sect. 2.4.
2.3 Moment tensor inversion of the test and the main aftershock
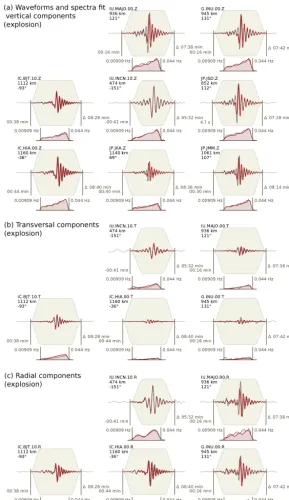
Seismic signals of the 2017 North Korean test show a great similarity to those generated by the previous four nuclear tests conducted in 2009, 2013, and 2016. Especially long-period waveforms with long-periods above 10 s recorded at re-gional distances show a high waveform similarity and a sub-stantially increased amplitude, revealing a very similar radi-ation pattern of all events and a larger moment release for the 2017 nuclear test. In recent years, MTIs have been performed for nuclear tests in North Korea, including those carried out in 2009, 2013, and 2016 (Ford et al., 2010; Barth, 2014; Vavry˘cuk and Kim, 2014; Cesca et al., 2017; Hartmann et al., 2017). All MTIs were performed by fitting low-frequency full waveform seismic data at regional distances, either in the time or in the frequency domain. The majority of these solutions revealed a significant positive isotropic component. For the 2013 nuclear test an extraordinarily high double cou-ple (DC) component was found, indicating differences in containment or near-source damaging effects (Barth, 2014; Vavry˘cuk and Kim, 2014). For the 2017 test the seismic mo-ment tensor is inverted by fitting the low-frequency ampli-tude spectra (epicentral distances up to 1200 km) and full dis-placement waveforms (epicentral distances up to 600 km) in the frequency range from 0.02 to 0.04 Hz following the ap-proach by Cesca et al. (2013, 2017). For the moment tensor optimization, the Grond algorithm (Heimann et al., 2018) is used, which searches the parameter space by random search first and later by an increasingly denser search around the best solutions. The algorithm finally resolves the full mo-ment tensor components, the centroid location, and centroid time and also provides information on model uncertainties and source parameters trade-offs. Full waveforms and their spectra are calculated assuming a layered crustal model pro-posed by Ford et al. (2010). Examples of full waveform dis-placement and amplitude spectra fits are shown in Fig. 5.
vari-64 P. Gaebler et al.: Multi-technology analysis of the 2017 North Korean nuclear test
Figure 3. (a)Setup of the depth analysis with the 2017 North Korean nuclear test marked as a red star and the four small-aperture, short-period arrays marked as bluish triangles. The epicentral distances to arrays IMAR, BCA, YKA, and TXAR are 48◦, 54◦, 65◦, and 94◦, respectively.(b)Residuals between observed and synthetic waveforms (L2norm) as a function of depth of the explosion.(c)Least squares source time function associated with the best-fit regularized solution. Solid and dashed lines are the normalized moment rate and moment function, respectively.(d)Observed (black) and synthetic (red) waveforms for the best-fit regularized solution at 600 m depth. The gray and green dashed lines indicate the theoretical arrival times of the P and pP phases, respectively. The traces are bandpass-filtered between 0.5 and 2.5 Hz.
ability among these type of solutions has been attributed to trade-offs among moment tensor components for very shal-low sources (Cesca et al., 2017; Cesca and Heimann, 2017). This range of moment tensor solutions includes alternative moment tensor configurations as proposed for previous nu-clear explosions in North Korea (e.g., Barth, 2014).
In the aftermath of the nuclear test, a seismic event took place in its direct vicinity around 8 min later. The estimated scalar moment andMware 1.88×10¹⁶Nm and 4.81, respec-tively, and thus the scalar moment is only∼8 % of the one of the nuclear test. The waveforms of the aftershock still show a sufficient SNR to perform an MTI. Waveform displacement and amplitude spectra fits of the MTI are shown in Fig. 7.
The inversion is based on spectral and waveform fits at stations located within 1000 km epicentral distance, filtered between 0.02 and 0.04 Hz. The calculated depth of the af-tershock is similar to the depth of the explosion. The best MTI solution suggests a dominant implosive source compo-nent (65 %), negative CLVD (29 %), and a DC compocompo-nent of 6 %. This source mechanism is compatible with a shallow collapse source or might hint at some kind of break-in pro-cess. An ensemble of well-fitting moment tensor solutions for this inversion is shown in Fig. 8.
2.4 Magnitude and yield estimation
ob-Figure 4. (a) Schematic sketch of five triangular basis functions
hl(t )with an equal weight of 1 and with a duration of 0.4 s each. The focal sphere symbols indicate that the orientation of the source mechanism is assumed to be constant during the rupture process. (b) Simulation of a complex moment rate function (blue line) by applying different weights tohland linear superposition.
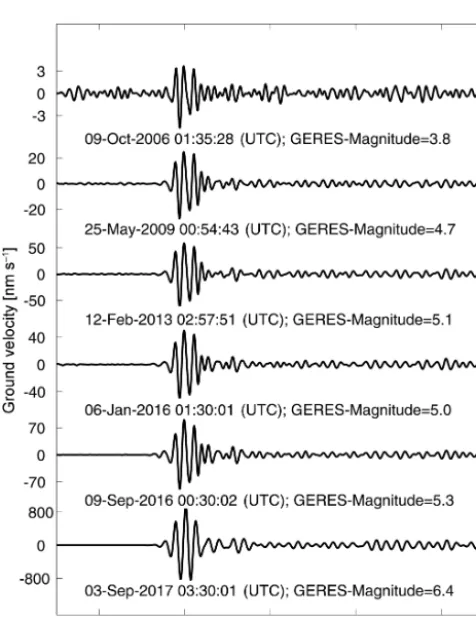
tain comparable results for the past six North Korean events, mb is calculated from waveform peak values measured at always the same 15 IMS seismic stations that recorded all six events. These stations (MKAR, INK, FINES, WRA, YKA, ASAR, AKASG, HFS, NOA, VRAC, GERES, STKA, DAVOX, NVAR, PDAR) cover the entire azimuthal range with a maximum gap of 121◦ and are located at distances between 3700 and 9000 km from the Punggye-ri test site. Exemplarily, the seismic signals at the German primary seis-mic station GERES are shown in Fig. 9. The high similar-ity between the six nuclear explosions stands out due to the short and simple P-wave train. The recordings differ only in their amplitudes. The resultant single station magnitude for GERES was used together with the corresponding magni-tudes of the other 14 stations involved to obtain reliable and comparable average magnitudes.
For the 2017 test ambof 6.2 is calculated, compared tomb values of 4.1 to 5.3 for the five preceding tests. In general it is not possible to state one single relation between magnitude and yield, as this relation depends on various factors, such as the geological setting at the source site, the efficiency of wave propagation from source to receiver, the depth of the explo-sion, and the coupling of the source to the underground. A number of empirical formulas of the typemb=A+Blog(Y ), withY being seismic yield in kT TNT equivalent andAand B being constants depending on the aforementioned factors, have been developed to relate yield andmb. These relations have been successfully used for yield calibration, for exam-ple at the Nevada test site (Murphy, 1981), in Kazakhstan (Ringdal et al., 1992), or in Nova Zemlya (Bowers et al., 2001). As no particular magnitude–yield relation has been approved so far for the North Korean test area, the latter relation by Bowers et al. (2001) is used in this study. The North Korean nuclear explosions were mainly conducted be-neath the Mt. Mantap complex, consisting of stratified vol-canics covering a basement of granite and diorite. In general, wet hard rock can be taken into account for these
geologi-cal conditions, when the yield is estimated on the basis of the seismic magnitude. Under these assumptions a yield of around 400 kT TNT equivalent is estimated for the Septem-ber 2017 test, clearly illustrating a steady increase in explo-sive strength of the nuclear tests (see Fig. 10).
2.5 Influence of the Mt. Mantap topography
Two-dimensional synthetic wave-field simulations are used to study the influence of topography of the Mt. Mantap com-plex on the propagation of P- and S-wave energy emitted by a point-like explosion source. A Chebyshev pseudo-spectral method (e.g., Tessmer et al., 1992) is used for modeling the elastic wave fields on a Cartesian 820×512 grid for an 8 km×5 km box inxandzdirection, respectively. No varia-tion in medium properties is assumed in theydirection. Fig-ure 11 shows the model configurations as well as the wave propagation for an explosion source at 0.6 km depth below the surface (see Sect. 2.2).
The source time function is taken from Glasstone and Dolan (1977, chapter 6), where the source duration is 0.15 s. The wave fieldV is separated in divergence (|∇ ·V|) and curl (|∇ ×V|) reflecting the P and SV energy, respectively. Moreover, the wave propagation is considered for one model without and two models with topography, whereas the to-pography is considered for a west–east profile along 41.3◦N crossing the Mt. Mantap massif (see Fig. 1b). The velocity model is chosen such that it reflects the petrology of the local geology as described by Coblentz and Pabian (2015). How-ever, strong lateral variations as thrust or normal faulting in the uppermost layers are not taken into account due to rea-sons of numerical stability. Instead lateral variations, which are based on an exponential perturbation with a correlation length of 100 m, are considered with differences in density, P-, and S-wave velocities of±3 %. Merely the last model ac-counts for erosion of the uppermost basaltic and volcanic lay-ers as well as an almost vertical dyke reflecting the transition between the granodiorites and the granite from west to east. Nevertheless, computing the P divergence and SV curl in a rectangular box shows large differences in the downward-propagating wave fields, where strong increases for both pP-and pS-wave amplitudes can be observed. The position pP-and the lateral extent of this box covers a slowness range from−9 to+9 s◦−1, which are typical slowness values for teleseismic P waves. For a source under Mt. Mantap, surface reflections are increased in their amplitudes by a factor of∼1.5 due to topography.
66 P. Gaebler et al.: Multi-technology analysis of the 2017 North Korean nuclear test
Figure 5.Full waveform displacement and amplitude spectra fits (gray and red lines denote observations and synthetics, respectively) are shown for the nuclear explosion for the vertical(a), transversal(b), and radial components(c). The top left side of each plot reports the trace component (network, station, location, and component codes), epicentral distance, and azimuth. Waveform plots report the starting time (relative to the origin time) and duration (in minutes and seconds) of the time window used (the gray background represents the applied taper), while spectra plots report the frequency range in Hz. For geographical locations of the stations used, see Fig. 1a.
shallower than 0.5 km and deeper than 1.7 km, respectively, energy focusing is less pronounced with amplifications in amplitude of 1.3 and less. Although only a two-dimensional model is considered, such simulations are also valid for the three-dimensional space because Mt. Mantap exhibits a high symmetry. In general, this numerical modeling gives
Figure 6.Best moment tensor decomposition (top) and source type plots (bottom) for the 2017 explosion. Top: the moment tensor de-compositions reports the focal sphere for the full moment tensor, and its isotropic and deviatoric components. The deviatoric compo-nent is further decomposed into CLVD and DC terms. The relative size of focal spheres scales with their relative magnitude. Bottom: the source type diagram after Hudson et al. (1989) is used to judge the moment tensor decomposition, illustrating the ensemble of best-fitting solutions. Figure shows both solutions based on all available data, as well as using data subsamples upon bootstrapping. The po-sition of each solution (circles, focal sphere for selected solutions) illustrates the moment tensor (MT) decomposition, while the focal spheres (shown for selected solutions only) illustrate the geometry of the DC term. The decomposition of the best solution is denoted by a blue square.
is generated in the source region due to topography effects above the source (see Sect. 2.3); (3) an overestimation of the yield of the explosion because P and pP phases are consid-ered as a single onset in teleseismic distances and in the in-vestigated frequency range for shallow sources, leading to an increase in maximum P-wave amplitude of approximately 1.3 and hence inmbof around 0.1; (4) no effect on differen-tial travel times between P and pP phases due to topography and therefore no effect on hypocenter depth estimation using depth phase modeling (see Sect. 2.2).
3 Infrasound observations
For a shallow event in the given magnitude range, the ob-servation of infrasound signals at distances of up to hun-dreds of kilometers is generally expected (Mutschlecner and Whitaker, 2005). Infrasound is subaudible sound below the human hearing threshold of 16 Hz and is the dedicated mon-itoring technology of the CTBTO for remotely detecting at-mospheric explosions. Furthermore, infrasound can be used
in civil and scientific applications such as the monitoring of volcanoes, meteoroids, ocean swell, and various other natural and anthropogenic activities (see Le Pichon et al., 2010 for a comprehensive overview). Infrasound signals are also gener-ated by strong underground or underwater sources when the generated waves couple into the atmosphere. The North Ko-rean tests between 2006 and 2016 were investigated and reg-istered by various infrasound arrays (Che et al., 2014; Assink et al., 2016; Park et al., 2018; Koch and Pilger, 2018). Detec-tions of the 2013 test by the IMS staDetec-tions I30JP in Japan and I45RU in Russia were part of the REB and thus confirmed the underground nuclear test as a source of infrasound waves. For the 2017 test, the station I45RU, located at a distance of 401 km from the test site, detected infrasound signatures from the nuclear test (see also Assink et al., 2018). Clear waveforms undoubtedly associated with the nuclear test were recorded and were again part of the REB. Figure 12a high-lights the waveform beam of the Russian four-element infra-sound array I45RU (denoted as the colocated seismic station USRK in Fig. 1a).
Coherent waveform signals can be observed and associ-ated with infrasound propagation from the nuclear test site arriving at I45RU after travel times of 1450 and 1520 s, cor-responding to celerities of 290 and 270 m s−1, respectively. Preceding waveform activity at around 1350 s (315 m s−1) can either be associated with infrasound radiation from an extended (near-)epicentral source region or the fast acoustic phase of an infrasonic forerunner (Evers and Haak, 2007). These values are in the pure acoustic range and indicate stratospheric ducting (Is2with two reflections and Is1f with one elongated reflection, turning heights of 40 to 55 km) and thermospheric ducting (It, turning heights above 100 km) (Drob et al., 2003). It is the first time that an underground nuclear test is strong enough to generate distinct and far-reaching pressure signatures that were clearly recorded at a remote IMS infrasound station after propagation through the thermosphere above 100 km altitude. The correspond-ing Progressive Multi-Channel Correlation (PMCC; Cansi, 1995) analysis of the signal content in terms of time vari-ation, frequency content, and back-azimuth direction is il-lustrated in Fig. 12b. The PMCC method draws rectangu-lar time–frequency windows wherever correlated signal en-ergy in three or more array elements is present. Color-coded back azimuths between 210 and 225◦(southwest) point to-wards the Punggye-ri nuclear test site with a true back az-imuth of 218◦. Effects from cross winds (west to northwest, strongest in the stratosphere) lead to the fact that the observed back azimuths are some degrees lower, especially within the stratospheric duct. The PMCC signatures with broadband frequency content from 0.2 to 4 Hz can thus be clearly as-sociated with the 2017 North Korean nuclear test.
68 P. Gaebler et al.: Multi-technology analysis of the 2017 North Korean nuclear test
Figure 7.Same as Fig. 5 but for the aftershock around 8 min after the test.
rays. A combination of European Centre for Medium-Range Weather Forecasts (ECMWF) analysis data and climato-logical profiles is implemented for temperature and wind model backgrounds including gravity wave perturbations (see Koch and Pilger, 2018, for further details on the meth-ods and the atmospheric profiles used). The eigen rays show that the stratospheric phases are about 170 and 70 s faster than the thermospheric phase (caused by a higher effective sound speed in the stratosphere and the longer wave path for the thermospheric phase). The signal attenuation, as ob-tained from parabolic-equation modeling, indicates that only a small portion of signal energy is ducted in the stratosphere caused by partial reflections from gravity wave variations in the stratospheric mean background. This leads to about a 4 to 5 dB higher attenuation in the stratospheric duct and thus stronger signal amplitudes in the thermospheric duct by a factor of 1.6 to 1.8, which corresponds to the observed
wave-forms. The presented infrasound signals clearly observed even at 401 km distance and with disadvantageous propaga-tion condipropaga-tions are indicative of a strong surface movement in the epicentral area (see Sect. 4) of the underground test gen-erating large acoustic pressure peaks as argued in Sect. 2.5. Apart from the strong epicentral surface movement, infra-sonic signatures were also identified from seismo-acoustic coupling and the assumed cavity collapse associated with the 8 min subsequent aftershock (see the Supplement to this pa-per for further information).
4 Remote-sensing studies
satel-Figure 8.Same as Fig. 6 but for the aftershock around 8 min after the underground test.
Figure 9.Beam seismograms calculated from the vertical compo-nents of the GERES array showing the P wave of the six North Korean nuclear explosions. The seismograms are normalized to the individual maximum amplitudes, for which the station magnitude is estimated.
Figure 10.Magnitude–yield relation curves for different geological settings. Numbered circles indicate the six North Korean nuclear tests. Gray background shading represents lower and upper bound-ary literature values for the different environments.
70 P. Gaebler et al.: Multi-technology analysis of the 2017 North Korean nuclear test
Figure 11.Snapshots obtained by and velocity model used for numerical simulations. P-wave velocities are indicated by shading according to the gray scale map (for S-wave velocities we assume avP/vSratio of 1.73), as well as logarithmically scaled divergence (P-wave energy) and curl (SV-wave energy) by bluish and greenish colors, respectively. The snapshots in(a)show the P- and SV-wave separated propagation for an explosion source without topography, the middle panels with topography across the North Korean test site for a west–east profile along 41.3◦N with Mt. Mantap in the middle. Panels in(c)are similar to those in(b)but with a more realistic geological setting, where erosion is accounted for. The time stamp of each snapshot is displayed in the upper left corner. The point source is beneath the center of Mt. Mantap at a depth of 0.6 km below the surface. The panel below the snapshots compares the summed average divergence and curl computed every 0.02 s in a rectangular box below the source for the case without (yellow) and the cases with (green and blue) topography. The downward-propagating wave field shows strongly increased amplitudes for pP and pS phases in both cases of topography.
(3) scattering effects (incoherent movement of scattering el-ements within the pixel; Gatelli et al., 1994).
Differential InSAR (DInSAR) processing was adjusted to the test site target area regarding the abovementioned con-straints. As the investigated area is located in a mountain-ous region, DInSAR processing is challenging due to factors such as limited visibility for SAR acquisition geometry, tro-pospheric phase contributions, and/or snow cover and
coher-Figure 12. (a)Waveform beam of the four-element infrasound array I45RU with corresponding celerity values. (b)Progressive Multi-Channel Correlation analysis in the same time frame for signal frequencies between 0.2 and 4 Hz. Information on back-azimuth direction is color coded. True back azimuth from test site to station is 218◦.(c)Propagation modeling using ray tracing with gray-shaded travel-time information for eigen rays from the test site to the station and color-coded attenuation information from parabolic-equation modeling. Is2and It denote the corresponding stratospheric and thermospheric arrivals after 1450 and 1520 s, respectively. Is1fshows the early signal detection and theoretical ray path for an infrasonic forerunner.
ence between these two times has a mean value of 0.6 for the investigated area. For areas that show surface deformation, the coherence values range from 0.2 to 0.8.
Figure 13 shows the surface deformation at the test site during the 2017 test restricted to pixels with coherence values greater than 0.25.
In the central part of the Mt. Mantap massive, coherence values dropped significantly below 0.25 due to very strong ground deformations (see also Wang et al., 2018). The recog-nition of the displacements is only possible in the line of sight in the direction towards or away from the sensor. Due to the incidence and look angle of the sensor measured with respect to the ground and north direction, respectively, it is not possible to fully resolve the amount of the vertical sur-face displacement caused by the 2017 nuclear test. During data acquisition on 29 August and 12 September 2017, the sensor had an incidence angle of 43◦and a look angle facing east–northeast. These angles combined with the topography of Mt. Mantap result in the maximum measurable percentage of vertical surface displacement. For the western flank of Mt. Mantap pointing towards the sensor with a slope of around 27◦, the percentage of resolvable surface displacement is
tem-72 P. Gaebler et al.: Multi-technology analysis of the 2017 North Korean nuclear test
Figure 13.Surface displacements from DInSAR analysis for the 2017 North Korean nuclear test in September 2017. Coherence threshold is set to 0.25. Data from the days 29 August and from 12 September 2017 are used. Arrows indicate slope direction and angle. Numbered circles indicate the epicenters of the tests from 2006 to 2017. Black solid box delineates an area of around 3×4 km2 in which the surface displacement is between−10 and 10 cm.
poral and spatial connection of the landslides to the test and aftershock origin time and epicenter locations.
Change detection analysis show numerous landslides acti-vated during the test and aftershocks. As a result of the pro-cessing of the ALOS-2 data, an area of around 3×4 km2can be delineated, where surface movement rates range between
−10 and 10 cm. For comparison, the area of the January 2016 North Korean nuclear test, which showed comparable surface movement rates, was in the range of 1.5×1.5 km2 (Hart-mann et al., 2017). This large difference clearly underlines the enormous power of the 2017 nuclear test. The strong sur-face deformations at the sursur-face observed for the 2017 test might lead to pathways and the subsequent release of ra-dionuclides, especially gaseous radionulcides such as133Xe, from the test site. Potential measurements of radionuclides are discussed in the following Sect. 5.
5 Radionuclide monitoring and atmospheric transport modeling
Measurements of radioactive fission products released into the atmosphere even at great distances can deliver defini-tive proof of the nuclear character of an explosion. To as-sess the consistency between measurements and potential source locations, the ATM method is applied (Becker et al.,
Figure 14.Change detection analysis via NDVI (Normalized Dif-ference Vegetation Index) from Pleiades data showing potential landslides (in purple patches) triggered by the 2017 nuclear test. Numbered circles indicate the epicenters of the tests from 2006 to 2017.
2007; Ross et al., 2017). For the ATM analysis of potential detections of radionuclides the Lagrangian particle disper-sion model HYSPLIT (National Oceanic and Atmospheric Administration – Air Resources Laboratory; Stein et al., 2015) is used. The ATM is operated with meteorological data from the US National Centers for Environmental Prediction (NCEP). For the prediction of potentially affected radionu-clide measurement stations, HYSPLIT is operated in forward mode with hypothetical releases. For the assessment of the potential source region of detected radioisotopes, the model runs in backward mode. Dispersion simulations of a potential immediate release after the explosion on 3 September 2017 show prevailing wind directions to the northeast (Fig. 15a).
Punggye-Figure 15. Atmospheric transport modeling results.(a)Forward dispersion modeling after 36 and 96 h for an immediate release on 3 September 2017.(b)Number of overlapping backward plumes for seven133Xe detecting samples in northeastern South Korea from 7– 10 September 2017 (fixed to 42 h transport time for each sample).(c)High-resolution forward dispersion modeling after 36 h for a delayed leakage on 4 October 2017.(d)Number of overlapping backward plumes for five133Xe detecting samples at RN58 Ussurysk during October 2017 (transport time fixed at maximum sensitivity to North Korean test site).
ri area has been mixed to the sample and the Xe-133 de-tected from this air sampling is relevant to the 6th nuclear test of DPRK” (Nuclear Safety and Security Commission, 2017) was interpreted by the media as a source attribution. Backward simulations for the samples collected at the north-eastern stationary measurement system at Geojin were per-formed using 500 000 model particles per sample and 0.5◦ GDAS (Global Data Assimilation System) meteorological data. Additive overlay of the source regions of seven station-ary 12 h samples with elevated133Xe from 7 to 10 Septem-ber 2017 points to the region where the Yongbyon North Ko-rean Scientific Research Center is located, as a likely coin-cident source (Fig. 15b), whereas the test site can be disre-garded as a common source for the seven samples. This
con-tradicts the suggestions in the media that the detected133Xe originated from the test explosion.
Continued forward simulations for hypothetical releases from the test site show that the station RN58 would have been repeatedly affected by the plumes during October. Fig-ure 15c shows as an example the dispersion after 36 h of a hypothetical 10 h release on 4 October 2017 using HYSPLIT with 0.25◦GFS (Global Forecast System) data and 1 million
sam-74 P. Gaebler et al.: Multi-technology analysis of the 2017 North Korean nuclear test
ples to being released from the test site. Figure 15d shows the overlap of the corresponding retro-plumes at a time of max-imum sensitivity to the test site. A leakage on the order of 1011Bq133Xe would have been sufficient to explain the de-tections at station RN58. Although the measurements and the ATM are consistent with delayed small releases from the test site in October, they cannot be unambiguously attributed to the North Korean test explosion.
6 Discussion
A combination of seismological analysis using a double-difference method and remote-sensing technologies results in an epicenter location of the 2017 test of 41.3007◦N, 129.0728◦E, clearly placing the event inside the North Ko-rean nuclear test site, at which all previous tests have been conducted. The epicenter location is confirmed by results from Wang et al. (2018), who estimated an epicenter location of 41.300◦N, 129.078◦E±50 m, which places the two epi-center solutions only∼400 to 500 m apart. On 24 May 2018 North Korea invited international media to witness the de-molition of the Punggye-ri test site. During a demonstration North Korean officials presented a map showing the relative locations of the six nuclear tests (CNN, 2018). Although the correctness of the information provided by the North Ko-rean government cannot be verified, comparisons indicate that the assumed locations fit the results from the dent relative location method reasonably well. Two indepen-dent methods showed that the 2017 North Korea event was very shallow. The full waveform moment tensor inversion in-dicates a centroid depth within the range of about 2 km but has a relatively poor resolution because of the long wave-length of low-pass-filtered data. The depth phase modeling of the P waveform was performed at 2.5 Hz and found a centroid depth between 400 and 800 m. According to the crustal profile at the source side, the expected P-wave wave-length is ∼1000 m, which indicates that the source depth is still resolved. This is supposedly the best absolute cen-troid depth estimate possible from seismological data far from the source. Depth estimations in this study are com-parable to results from Wang et al. (2018). The authors used numerical models to minimize the misfit between predicted and observed surface displacements and specified a depth of 450±100 m.
The explosive character of the 2017 event is confirmed by MTI analysis, which indicates a dominant isotropic source part of around 60 %. These results are supported by studies by Liu et al. (2018) and Han et al. (2017), who also revealed a dominant positive isotropic source part. Under the assump-tion of the magnitude–yield relaassump-tion following Bowers et al. (2001), the estimatedmbof 6.2 (see Sect. 2.4) for the event results in a yield of 400 kT TNT equivalent. This value is assumed to be an upper limit, as the following factors might lead to a yield overestimation. (1) Topography at the test site
(see Sect. 2.5) strongly influences the radiation of seismic energy from the source. This results in higher amplitudes of the pP phase. As the hypocenter location is very shallow, P and pP phases from the event arrive nearly simultaneously at distant receivers and superimpose at frequencies relevant for the estimation ofmb. This superimposition leads to an in-crease of approximately 1.3 in P-wave amplitude in the far field and consequently to an increase in mb of around 0.1. (2) Furthermore, in the standard calculations ofmb (Guten-berg, 1945a, b; Bormann, 2012), distant-dependent correc-tion curves, which are valid for a DC source, are applied. Gaebler and Ceranna (2017) state that the use of correction terms for a shallow explosion source can lead to an overes-timation ofmbof around 0.2. Taking both these effects into account, the originally estimated value formbof 6.2 had to be considered as an upper limit estimate and has to be cor-rected by a factor of up to 0.3. This correction leads to a lower estimate formb of 5.9, similar to M
(peak)
w that is es-timated from the source time function, which translates to an estimated yield of around 160 kT TNT equivalent. There-fore, indications are strong that yield might be overestimated, not only for the 2017 explosion but also for all five previous North Korean nuclear tests.
Following the main event, around 8 min later, a large af-tershock of local magnitudemL4.1 was detected. MTI anal-ysis of this event shows a clear negative isotropic part which leads to the conclusion that this event is caused by at least a partial collapse of the cavity formed by the main explosion. These findings are again supported Liu et al. (2018) and Han et al. (2017), who also find a clear negative isotropic source part for the aftershock. According to Liu et al. (2018), the aftershock can qualitatively be interpreted as a rapid destruc-tion of an explosion-generated cracked rock chimney due to cavity collapse. Following this strong aftershock, nine more earthquakes with local magnitudesmL ranging from 2.5 up to 3.2 were detected by the Korean Meteorological Agency (Korean Meterological Agency, 2018) in the region (41.2 to 41.4◦N, 129.0 to 129.2◦E) until April 2018. Aftershocks of such a magnitude range and quantity were not observed from the five previous tests from 2006 to 2016 but are not unusual for nuclear explosions of that size (Boucher et al., 1969).
geolog-ical background the deformation pattern can be interpreted as a (partial) uplift of the basement rocks in the western part. Eventually this is structurally controlled by the north–south trending reverse faults together with the unconformable cap-ping of stratified volcanic sequences. This interpretation is confirmed by multispectral optical data from the Pleiades satellite which shows that the layered tuffs are strongly af-fected by intensive landslide activities.
Overall, accounting for all these activities (surface defor-mations, the collapse event, aftershocks, landslides) it can be argued, that the internal structure beneath Mt. Mantap might be strongly stressed and shattered due to the last six tests and might be rendered useless for further test explosions (see also Wang et al., 2018).
Despite these strong activities and the enormous release of seismic energy from the event, no immediate release of radionuclides was measured by the IMS. This is a strong in-dication that no direct pathways from the cavity to the sur-face for the propagation of radionuclides were created during the test and the subsequent collapse-type aftershock. Only a few days after the 2017 event, South Korea announced na-tional measurements of 133Xe and proposed a connection with these observations to the test. However, backward ATM calculations performed in the context of this study disfavor the Punggye-ri test site as possible origin for133Xe but rather point to the Yongbyon nuclear complex as a most likely co-incident source region instead in September. Nevertheless, in October 2017 three peaks of 133Xe were detected at the IMS station RN58 in Ussurysk, Russia. Forward as well as backward ATM show directly connecting dispersion condi-tions and indicate the North Korean test site as a likely source for the133Xe detections. Nevertheless, other regional sources cannot be excluded, and it was not possible to definitely iden-tify the presence of 131mXe in the RN58 samples, which – in the correct isotropic ratio – would have increased the evidence of a nuclear explosion source (Kalinowski et al., 2010), as for example shown for the 2013 North Korean nu-clear explosion by Ringbom et al. (2014). According to cal-culations of concentration and sensitivity, a release at the test site on the order of a few 1011Bq would have been sufficient to cause and explain the detections at station RN58. This is also quantitatively consistent as the required source term ranges well below the remaining fission inventory even af-ter 6 to 10 half-lifes of133Xe (5.2 days) and a small leakage through mountain cracks. However, a direct number of the fission inventory is hard to estimate as the fission yield de-pends not only on the explosive yield but also on the type of nuclear device. Within the available data it is not possible to determine if nuclear fusion was involved in the process. The largest yield ever achieved by a boosted fission device was 720 kT TNT equivalent of the British Orange Herald in 1957. For this explosion an amount of 118 kg 235U was mounted (Arnold and Pyne, 2001). The explosive yield in this study of between 160 and 400 kT TNT equivalent is therefore still fully compatible with a fission-only device.
DInSAR results show a large area of strong displacement in the case of the 2017 test, and it is not possible to de-mark a definite surface location of the test epicenter from these measurements. However, retrieving a ground truth from DInSAR measurements from the January 2016 test, which showed a clear and distinct maximum of surface displace-ment, can help to provide an absolute epicenter location of the 2017 test. By combining remote sensing and relative lo-cations methods only the epicenter of the event can be es-timated. A third method (depth phase modeling) is required for the complete estimation of the 2017 test hypocenter. This method is further able to provide an explanation for the large difference inmb andMw, which has not been observed in this order for the previous tests. Furthermore while for pre-vious weaker tests radionuclide measurements were able to prove the nuclear character of the explosions (Ross et al., 2017), radionuclide measurements alone in September 2017 could have been misleading with regard to the source area. This examples clearly demonstrate that an integrated multi-technology and multi-methodology approach is essential for a reliable and comprehensive identification and characteriza-tion of a potential nuclear test.
7 Conclusions
Overall, the following main conclusions can be deduced from this study.
– The explosive character of the 3 September 2017 North Korean event is confirmed by MTI analysis.
– The yield of the event is estimated to be around 400 kT TNT equivalent with indications that this value should be considered as an upper limit and might be as low as 160 kT TNT equivalent. This overestimation can be ex-plained by the enhancement of peak amplitudes of tele-seismic P waves due to topography and depth phase ef-fects.
– The estimated yield of the nuclear device is certainly smaller than the largest documented yield ever achieved by a boosted fission device and is therefore still compat-ible with a fission-only device.
– Strong surface deformations (±10 cm) are observed in an area of 3×4 km2. Comparisons of affected surface area to the January 2016 test underline the enormous power of the 2017 nuclear test. Furthermore, multiple landslides as well as a number of aftershocks were ob-served in the aftermath of the test.
– The aftershock directly following the nuclear explosion has a similar depth as the test and can be characterized as a collapse of the cavity created by the test.
76 P. Gaebler et al.: Multi-technology analysis of the 2017 North Korean nuclear test
that a thermospheric propagation path of infrasound could be observed for an underground nuclear explo-sion.
– No immediate measurements of radionuclides related to the test in September were observable, but later oc-currences of radionuclides are consistent with a delayed leakage from the test site in October.
– The test site might have been strongly stressed and shat-tered and thus rendered useless for further test activities. The combination of the results from the different technolo-gies and methods yields a reliable estimation of hypocen-ter, magnitude, explosive energy, source mechanism, and an indication of delayed leakage of 133Xe from the test site. The cross-links between the different results complement each other in a consistent manner. The multi-technology and multi-methodology analysis presented in this study clearly indicates that the September 2017 North Korean event was in fact a nuclear test. Even in the phase of before its entry into force, the CTBTO verification regime has again demon-strated its readiness with respect to the recent nuclear test.
Data availability. The facilities of IRIS Data Services, and specif-ically the IRIS Data Management Center, were used for access to seismic waveforms, related metadata, and/or derived products used in this study. IRIS Data Services are funded through the Seismo-logical Facilities for the Advancement of Geoscience and Earth-Scope (SAGE) Proposal of the National Science Foundation under Cooperative Agreement EAR-1261681. Seismic, infrasound and ra-dionuclide data from stations of the IMS network (seismic, infra-sound, radionuclide) were obtained by the German NDC through the IDC of the CTBTO. ECMWF operational analysis data are used for infrasound propagation modeling. ATM using HYSPLIT is op-erated with GDAS and GFS meteorological data from the United States NCEP. The satellite from ALOS-2 was obtained by GAF AG; data from the Pleiades satellite were delivered by Airbus Defence and Space.
Supplement. The supplement related to this article is available online at: https://doi.org/10.5194/se-10-59-2019-supplement.
Author contributions. Authors contributions to the different sec-tions of this study, including data analysis and interpretation, prepa-ration of the figures and results, and writing, are as follows. Sec-tion 2.1 “Epicenter locaSec-tion” was done by GH and PG. SecSec-tion 2.2 “Estimation of hypocenter depth and seismic moment” was done by SC, TD, and NN. Section 2.3 “Moment tensor inversion of the test and the main aftershock” was done by AB, SC, and TD. Section 2.4 “Magnitude and yield estimation” was done by GH and PG. Sec-tion 2.5 “Influence of the Mt. Mantap topography” was done by LC and PG. Section 3 “Infrasound observations” was done by CP, KK, LC, and PG. Section 4 “Remote-sensing studies” was done by MF and IG. Section 5 “Radionuclide monitoring and atmospheric
trans-port modeling” was done by OR and PG. PG, LC, and TD devised and finalized the original manuscript.
Competing interests. The authors declare that they have no conflict of interest.
Acknowledgements. The critical and helpful comments by Stefanie Donner (BGR) and Patrick Hupe (BGR) are highly appreciated. Furthermore we highly appreciate comments by Michael Ritzwoller (CU), Jörg Renner (RUB), and Felix M. Schneider (GFZ) as well as by three anonymous reviewers. Nima Nooshiri acknowledges support from the German Federal Ministry of Education and Research in the context of the project SECURE (FKZ-03A0013A).
Edited by: Irene Bianchi
Reviewed by: Felix M. Schneider and one anonymous referee
References
Adam, N., Parizzi, A., Eineder, M., and Crosetto, M.: Prac-tical persistent scatterer processing validation in the course of the Terrafirma project, J. Appl. Geophys., 69, 59–65, https://doi.org/10.1016/j.jappgeo.2009.07.002, 2009.
Arnold, L. and Pyne, K.: The First Trial – Grap-ple, 131–150, Palgrave Macmillan UK, London, https://doi.org/10.1057/9780230599772_10, 2001.
Assink, J., Averbuch, G., Shani-Kadmiel, S., Smets, P., and Evers, L.: A Seismo-Acoustic Analysis of the 2017 North Korean Nuclear Test, Seismol. Res. Lett., 89, 2025– 2033,https://doi.org/10.1785/0220180137, 2018.
Assink, J. D., Averbuch, G., Smets, P. S. M., and Evers, L. G.: On the infrasound detected from the 2013 and 2016 DPRK’s underground nuclear tests, Geophys. Res. Lett., 43, 3526–3533, https://doi.org/10.1002/2016GL068497, 2016.
Barth, A.: Significant release of shear energy of the North Korean nuclear test on February 12, 2013, J. Seismol., 18, 605–615, https://doi.org/10.1007/s10950-014-9431-6, 2014.
Bassin, C., Laske, G., and Masters, G.: The Current Limits of Reso-lution for Surface Wave Tomography in North America, Eos, 81, 2000.
Becker, A., Wotawa, G., De Geer, L.-E., Seibert, P., Draxler, R. R., Sloan, C., D’Amours, R., Hort, M., Glaab, H., Heinrich, P., Grillon, Y., Shershakov, V., Katayama, K., Zhang, Y., Stewart, P., Hirtl, M., Jean, M., and Chen, P.: Global backtracking of anthropogenic radionuclides by means of a receptor oriented ensemble dispersion modelling system in support of Nuclear-Test-Ban Treaty verification, Atmos. Environ., 41, 4520–4534, https://doi.org/10.1016/j.atmosenv.2006.12.048, 2007.
Bormann, P.: New Manual of Seismological Observatory Practice (NMSOP-2), Deutsches GeoForschungszentrum GFZ, IASPEI, Potsdam, https://doi.org/10.2312/GFZ.NMSOP-2, 2012. Boucher, G., Ryall, A., and Jones, A. E.: Earthquakes
associ-ated with underground nuclear explosions, J. Geophys. Res., 74, 3808–3820, https://doi.org/10.1029/JB074i015p03808, 1969. Bowers, D., Marshall, P. D., and Douglas, A.: The level of
ar-ray to possible violations of the Comprehensive Test Ban in the Novaya Zemlya region, Geophys. J. Int., 146, 425–438, https://doi.org/10.1046/j.1365-246x.2001.01462.x, 2001. Cansi, Y.: An automatic seismic event processing for detection and
location: The P.M.C.C. Method, Geophys. Res. Lett., 22, 1021– 1024, https://doi.org/10.1029/95GL00468, 1995.
Cesca, S. and Heimann, S.: Moment Tensor Solutions – A Useful Tool for Seismotectonics, Challenges in regional moment tensor resolution and interpretation, Springer Natural Hazards, Cham, Switzerland, https://doi.org/10.1007/978-3-319-77359-9, 2017. Cesca, S., Rohr, A., and Dahm, T.: Discrimination of induced
seis-micity by full moment tensor inversion and decomposition, J. Seismol., 17, 147–163, 2013.
Cesca, S., Heimann, S., Kriegerowski, M., Saul, J., and Dahm, T.: Moment Tensor Inversion for Nuclear Explosions: What Can We Learn from the 6 January and 9 September 2016 Nuclear Tests, North Korea?, Seismol. Res. Lett., 88, 300, https://doi.org/10.1785/0220160139, 2017.
Che, I.-Y., Park, J., Kim, I., Kim, T. S., and Lee, H.-I.: Infrasound signals from the underground nuclear ex-plosions of North Korea, Geophys. J. Int., 198, 495–503, https://doi.org/10.1093/gji/ggu150, 2014.
CNN: North Korea blows up tunnels at Punggye-ri nuclear test site, avalable at: https://edition.cnn.com/2018/05/24/asia/ north-korea-nuclear-test-site-intl/index.html (10 January 2018), 2018.
Coblentz, D. and Pabian, F.: Revised Geologic Site Characterization of the North Korean Test Site at Punggye-ri, Science & Global Security, 23, 101–120, 2015.
CTBTO: Preparatory Commission for the Comprehensive Nuclear-Test-Ban Treaty Organization, available at: https://www.ctbto. org/ (last access: 10 January 2019), 2018.
Dahm, T. and Krüger, F.: New Manual of Seismological Observa-tory Practice (NMSOP-2), IASPEI, GFZ German Research Cen-tre for Geosciences, Potsdam, Moment tensor inversion and mo-ment tensor interpretation, Deutsches GeoForschungsZentrum GFZ, Potsdam, Germany, https://doi.org/10.2312/GFZ.NMSOP-2_IS_3.9, 2014.
Dahm, T., Küger, F., Stammler, K., Klinge, K., Kind, R., Wyle-galla, K., and Grasso, J.-R.: The 2004 Mw 4.4 Rotenburg, Northern Germany, Earthquake and Its Possible Relation-ship with Gas Recovery, B. Seismol. Soc. Am., 97, 691, https://doi.org/10.1785/0120050149, 2007.
Drob, D. P., Picone, J. M., and Garcés, M.: Global morphol-ogy of infrasound propagation, J. Geophys. Res., 108, 4680, https://doi.org/10.1029/2002JD003307, 2003.
Evers, L. G. and Haak, H. W.: Infrasonic forerunners: Excep-tionally fast acoustic phases, Geophys. Res. Lett., 34, l10806, https://doi.org/10.1029/2007GL029353, 2007.
Ford, S. R., Dreger, D. S., and Walter, W. R.: Network Sensitivity Solutions for Regional Moment-Tensor Inversions, B. Seismol. Soc. Am., 100, 1962, https://doi.org/10.1785/0120090140, 2010. Gaebler, P. J. and Ceranna, L.: Monitoring Compliance with the Comprehensive Nuclear-Test-Ban Treaty (CTBT), Contributions by the German National Data Center, The Seismic Network of the International Monitoring System (IMS), 69–90, Schweizer-bart Science Publishers, Stuttgart, Germany, 2017.
Gatelli, F., Monti Guamieri, A., Parizzi, F., Pasquali, P., Prati, C., and Rocca, F.: The Wavenumber Shift in SAR Interferometry, IEEE T. Geosci. Remote, 29, 855–865, 1994.
Gibbons, S. J., Pabian, F., Näsholm, S. P., Kværna, T., and Mykkeltveit, S.: Accurate relative location esti-mates for the North Korean nuclear tests using empiri-cal slowness corrections, Geophys. J. Int., 208, 101–117, https://doi.org/10.1093/gji/ggw379, 2017.
Glasstone, S. and Dolan, P. J.: The Effects of Nuclear Weapons, U.S. Government Printing Office, Washington, DC, 1977. Gleyzes, M. A., Perret, L., and Kubik, P.: Pleiades System
Ar-chitecture and Main Performances, Int. Arch. Photogramm. Remote Sens. Spatial Inf. Sci., XXXIX-B1, 537–542, https://doi.org/10.5194/isprsarchives-XXXIX-B1-537-2012, 2012.
Gutenberg, B.: Amplitudes of P, PP, and S and magnitude of shallow earthquakes*, B. Seismol. Soc. Am., 35, 57–69, 1945a. Gutenberg, B.: Magnitude determination for deep-focus
earth-quakes*, B. Seismol. Soc. Am., 35, 11–130, 1945b.
Han, L., Wu, Z., Jiang, C., and Liu, J.: Properties of three seis-mic events in September 2017 in the northern Korean Penin-sula from moment tensor inversion, Sci. Bull., 62, 1569–1571, https://doi.org/10.1016/j.scib.2017.11.007, 2017.
Hartmann, G., Barth, A., Ross, J. O., Grünberg, I., and Frei, M.: Monitoring Compliance with the Comprehensive Nuclear-Test-Ban Treaty (CTBT). Contributions by the German National Data Center, Verification of the North Korean Nuclear Explosions 2006, 2009, 2013, and 2016, 137–165, Schweizerbart Science Publishers, Stuttgart, Germany, 2017.
Heimann, S., Isken, M., Kühn, D., Sudhaus, H., Steinberg, A., Vasyura-Bathke, H., Daout, S., Cesca, S., and Dahm, T.: Grond – A probabilistic earthquake source inversion framework. V. 1.0., GFZ Data Services, https://doi.org/10.5880/GFZ.2.1.2018.003, 2018.
Hudson, J. A., Pearce, R. G., and Rogers, R. M.: Source type plot for inversion of the moment tensor, J. Geophys. Res.-Sol. Ea., 94, 765–774, https://doi.org/10.1029/JB094iB01p00765, 1989. Kalinowski, M., Axelsson, A., Bean, M., Blanchard, X., Bowyer,
T., Brachet, G., Hebel, S., McIntyre, J., Peters, J., Pistner, C., Raith, M., Ringbom, A., R. J. Saey, P., Schlosser, C., J. Stocki, T., Taffary, T., and Ungar, K.: Discrimination of Nuclear Explosions against Civilian Sources Based on Atmospheric Xenon Isotopic Activity Ratios, Pure Appl. Geophys., 167, 517–539, 2010. Kampes, B. M.: Radar Interferometry – Persistent
Scat-terer Technique, Springer Netherlands, Dordrecht, https://doi.org/10.1007/978-1-4020-4723-7, 2006.
Kennett, B. L. N., Engdahl, E. R., and Buland, R.: Con-straints on seismic velocities in the Earth from traveltimes, Geophys. J. Int., 122, 108–124, https://doi.org/10.1111/j.1365-246X.1995.tb03540.x, 1995.
Koch, K. and Pilger, C.: Infrasound observations from the site of past underground nuclear explosions in North Korea, Geophys. J. Int., 216, 182–200, https://doi.org/10.1093/gji/ggy381, 2018. Korean Central News Agency: DPRK Nuclear Weapons Institute on
Successful Test of H-bomb for ICBM, press release, Pyongyang, 3 September 2017, available at: http://www.kcna.kp/ (10 January 2019), 2017.
78 P. Gaebler et al.: Multi-technology analysis of the 2017 North Korean nuclear test
volcano/domesticlist.jsp?startTm=2017-09-01&endTm= 2018-12-13&startSize=999&endSize=999&startLat=41. 2&endLat=41.4&startLon=129&endLon=129.2&lat=&lon= &dist=&keyword=&x=36&y=11 (last access: 10 January 2019), 2018.
Le Pichon, A., Blanc, E., and Hauchecorne, A.: Infrasound Moni-toring for Atmospheric Studies, Springer, Dordrecht Heidelberg London New York, https://doi.org/10.1007/978-1-4020-9508-5, 2010.
Liu, J., Li, L., Zahradník, J., Sokos, E., Liu, C., and Tian, X.: North Korea’s 2017 Test and its Nontec-tonic Aftershock, Geophys. Res. Lett., 45, 3017–3025, https://doi.org/10.1002/2018GL077095, 2018.
Massonnet, D., Rossi, M., Carmona, C., Adragna, F., Peltzer, G., Feigl, K., and Rabaute, T.: The displacement field of the Landers earthquake mapped by radar interferometry, Nature, 364, 138– 142, https://doi.org/10.1038/364138a0, 1993.
Murphy, J. R.: Identification of Seismic Sources – Earthquake or Underground Explosion, P Wave Coupling of Under-ground Explosions in Various Geologic Media, 1201–205, Springer Netherlands, Dordrecht, https://doi.org/10.1007/978-94-009-8531-5, 1981.
Mutschlecner, J. P. and Whitaker, R. W.: Infrasound from earthquakes, J. Geophys. Res.-Atmos., 110, https://doi.org/10.1029/2004JD005067 2005.
Nuclear Safety and Security Commission: Press Release: Radionu-clide Detection After the 6th North Korea Nuclear Test, avail-able at: http://www.nssc.go.kr/_custom/nssc/_common/board/ download.jsp?attach_no=20247 (last access: 10 January 2019), 2017.
Pabian, F. and Coblentz, D.: Surface Disturbances at the Punggye-ri Nuclear Test Site: Another Indicator of Nuclear Testings?, Los Alamos National Laboratory, Report posted on 38north.org, final version issued 15 March 2017, available at: https://www.38north. org/2017/01/fpabiandcoblentz010617/ (last access: 10 January 2019), 2017.
Park, J., Che, I.-Y., Stump, B., Hayward, C., Dannemann, F., Jeong, S., Kwong, K., McComas, S., Oldham, H. R., Scales, M. M., and Wright, V.: Characteristics of infrasound signals from North Korean underground nuclear explosions on 2016 January 6 and September 9, Geophys. J. Int., 214, 1865–1885, 2018.
Pilger, C., Ceranna, L., and Bönnemann, C.: Monitoring Compli-ance with the Comprehensive Nuclear-Test-Ban Treaty (CTBT), Contributions by the German National Data Center, Schweizer-bart Science Publishers, Stuttgart, Germany, 2017.
Ringbom, A., Axelsson, A., Aldener, M., Auer, M., Bowyer, T., Fritioff, T., Hoffman, I., Khrustalev, K., Nikkinen, M., Popov, V., Popov, Y., Ungar, K., and Wotawa, G.: Ra-dioxenon detections in the CTBT international monitoring sys-tem likely related to the announced nuclear test in North Ko-rea on February 12, 2013, J. Environ. Radioactiv., 128, 47–63, https://doi.org/10.1016/j.jenvrad.2013.10.027, 2014.
Ringdal, F., Marshall, P. D., and Alewine, R. W.: Seismic yield determination of Soviet underground nuclear explosions at the Shagan River test site, Geophys. J. Int., 109, 65–77, https://doi.org/10.1111/j.1365-246X.1992.tb00079.x, 1992.
Ross, J. O., Bollhöfer, A., and Schlosser, C.: Monitoring Compli-ance with the Comprehensive Nuclear-Test-Ban Treaty (CTBT), Contributions by the German National Data Center, The IMS Radionuclide Network Supported by Atmospheric Transport Modelling (ATM), 123–136, Schweizerbart Science Publishers, Stuttgart, Germany, 2017.
Stein, A. F., Draxler, R. R., Rolph, G. D., Stunder, B. J. B., Cohen, M. D., and Ngan, F.: NOAA’s HYSPLIT Atmospheric Trans-port and Dispersion Modeling System, B. Am. Meteor. Soc., 96, 2059–2077, https://doi.org/10.1175/BAMS-D-14-00110.1, 2015.
Suzuki, S., Osawa, Y., Hatooka, Y., Kankaku, Y., and Watanabe, T.: Overview of Japan’s Advanced Land Observing Satellite-2 mission, Proceedings Volume 7474, Sensors, Systems, and Next-Generation Satellites XIII; 74740Q, SPIE Remote Sensing, 2009, Berlin, Germany, https://doi.org/10.1117/12.831340, 2009. Tessmer, E., Kosloff, D., and Behle, A.: Elastic wave
prop-agation simulation in the presence of surface topography, Geophys. J. Int., 108, 621–632, https://doi.org/10.1111/j.1365-246X.1992.tb04641.x, 1992.
Vavry˘cuk, V. and Kim, S. G.: Nonisotropic radiation of the 2013 North Korean nuclear explosion, Geophys. Res. Lett., 41, 7048– 7056, https://doi.org/10.1002/2014GL061265, 2014.
Waldhauser, F. and Ellsworth, W. L.: A Double-Difference Earth-quake Location Algorithm: Method and Application to the Northern Hayward Fault, California, B. Seismol. Soc. Am., 90, 1353–1368, https://doi.org/10.1785/0120000006, 2000. Wang, R.: A simple orthonormalization method for stable and
ef-ficient computation of Green’s functions, B. Seismol. Soc. Am., 89, 733–741, 1999.
Wang, T., Shi, Q., Nikkhoo, M., Wei, S., Barbot, S., Dreger, D., Bürgmann, R., Motagh, M., and Chen, Q.-F.: The rise, col-lapse, and compaction of Mt. Mantap from the 3 Septem-ber 2017 North Korean nuclear test, Science, 361, 166–170, https://doi.org/10.1126/science.aar7230, 2018.
Wei, M.: Location and source characteristics of the 2016 January 6 North Korean nuclear test constrained by InSAR, Geophys. J. Int., 209, 762–769, https://doi.org/10.1093/gji/ggx053, 2017. Zhang, M. and Wen, L.: High-precision location and yield of North
Korea’s 2013 nuclear test, Geophys. Res. Lett., 40, 2941–2946, https://doi.org/10.1002/grl.50607, 2013.
Zhao, L., Xie, X., Wang, W., and Yao, Z.: The 12 February 2013 North Korean Underground Nuclear Test, Seismol. Res. Lett., 85, 130–134, https://doi.org/10.1785/0220130103, 2014.