Clim. Past, 9, 735–747, 2013 www.clim-past.net/9/735/2013/ doi:10.5194/cp-9-735-2013
© Author(s) 2013. CC Attribution 3.0 License.
EGU Journal Logos (RGB)
Advances in
Geosciences
Open Access
Natural Hazards
and Earth System
Sciences
Open AccessAnnales
Geophysicae
Open AccessNonlinear Processes
in Geophysics
Open AccessAtmospheric
Chemistry
and Physics
Open AccessAtmospheric
Chemistry
and Physics
Open Access DiscussionsAtmospheric
Measurement
Techniques
Open AccessAtmospheric
Measurement
Techniques
Open Access DiscussionsBiogeosciences
Open Access Open Access
Biogeosciences
DiscussionsClimate
of the Past
Open Access Open Access
Climate
of the Past
Discussions
Earth System
Dynamics
Open Access Open Access
Earth System
Dynamics
DiscussionsGeoscientific
Instrumentation
Methods and
Data Systems
Open Access
Geoscientific
Instrumentation
Methods and
Data Systems
Open Access DiscussionsGeoscientific
Model Development
Open Access Open Access
Geoscientific
Model Development
DiscussionsHydrology and
Earth System
Sciences
Open AccessHydrology and
Earth System
Sciences
Open Access DiscussionsOcean Science
Open Access Open Access
Ocean Science
Discussions
Solid Earth
Open Access Open Access
Solid Earth
Discussions
The Cryosphere
Open Access Open Access
The Cryosphere
Discussions
Natural Hazards
and Earth System
Sciences
Open Access
Discussions
Modeling the climatic implications and indicative senses of the
Guliya
δ
18
O-temperature proxy record to the ocean–atmosphere
system during the past 130 ka
D. Xiao1, P. Zhao1,2, Y. Wang3, and X. Zhou1,2
1Chinese Academy of Meteorological Sciences, Beijing 100081, China 2State Key Laboratory of Severe Weather, Beijing 100081, China
3State Key Laboratory of Marine Geology, Tongji University, Shanghai 200092, China
Correspondence to: P. Zhao ([email protected])
Received: 29 March 2012 – Published in Clim. Past Discuss.: 22 May 2012 Revised: 20 February 2013 – Accepted: 5 March 2013 – Published: 15 March 2013
Abstract. Using an intermediate-complexity UVic Earth
System Climate Model (UVic Model), the geographical and seasonal implications and indicative senses of the Guliya temperature proxy found in the Guliyaδ18O ice core record (hereinafter, the Guliyaδ18O-temperature proxy record) are investigated under time-dependent orbital and CO2forcings
with an acceleration factor of 50 over the past 130 ka. The re-sults reveal that the simulated August–September Guliya sur-face air temperature (SAT) reproduces the 21-ka precession and 43-ka obliquity cycles of the Guliyaδ18O-temperature proxy record, showing an in-phase variation with the latter. Moreover, the Guliyaδ18O-temperature proxy record may be also an indicator of the August–September Northern Hemi-spheric (NH) SAT. Corresponding to the difference between the extreme warm and cold phases of the precession cycle in the Guliya August–September SAT, there are two anoma-lous patterns in SAT and sea surface temperature (SST). The first anomalous pattern shows increases of SAT and SST to-ward the Arctic, which is possibly associated with an in-crease of the NH incoming solar radiation that is caused by the in-phase superposition between the precession and obliq-uity cycles. The second anomalous pattern shows increases of SAT and SST toward the equator, which is possibly due to a decrease of incoming solar radiation over the NH polar that results from the anti-phase counteraction between the pre-cession and obliquity cycles. The summer (winter) Guliya and NH temperatures are higher (lower) in the warm phases of the August–September Guliya than in their cold phases. Moreover, in August–September, the Guliya SAT is closely
related to the North Atlantic SST, in which the Guliya pre-cipitation might act as a “bridge” linking the Guliya SAT and the North Atlantic SST.
1 Introduction
Compared to other proxy data, ice core records offer long-time-scale, continuous, and high-resolution climatic and en-vironmental records of many informational parameters (Yao and Wang, 1997). Among the long-term ice core records, the Guliya ice cap, located in a northern subtropical region, is the largest (with a total area of 376.1 km2), the highest (with an elevation of 6700 m), and the thickest (with an aver-age thickness of approximately 200 m and a maximum thick-ness of approximately 350 m) ice body found in the middle and low latitudes of the Northern Hemisphere (NH) (Yao et al., 1994, 2000). In 1992, Chinese and American sci-entists drilled into the Guliya glacier in the North Tibetan Plateau at 81.5◦E, 35.2◦N and retrieved three ice cores with
736 D. Xiao et al.: Modeling the climatic implications of temperature proxy record
al., 1996a). The scientists found that moisture source is iden-tified as a major factor in the spatial distribution ofδ18O, but air temperature determines the temporal fluctuations ofδ18O at the meteorological stations at the northern Tibetan Plateau. Therefore, the Guliyaδ18O-temperature proxy record is of-ten considered to be representative of the temperature of the Tibetan Plateau (Yao et al., 1995, 1996a), which witnessed significant warm and cold periods over the past 130 ka, ei-ther in the interglacial stage or in the glacial stage. The alter-nation of these warm and cold periods indicated an obvious 21-ka cycle (Yao et al., 1997). The Guliyaδ18O-temperature proxy record has been used to investigate the features of the Younger Dryas and Heinrich events and to compare with the Arctic and Antarctic records (Yang et al., 1997), and has also been used as a temperature index to investigate tem-poral structures over many periods including the orbital and sub-orbital scales, the millennial scale, the century scale, the decadal scale, and others (Yao et al., 1996b, 1997, 2001; Shi et al., 1999). Therefore, Guliya ice cores offered a new way to understand the environmental changes of the third Pole– Tibet Plateau and is also helpful for understanding the effects of climate changes in the middle and low latitudes.
In the context of the Milankovitch astronomic climate the-ory (Milankovitch, 1969), the latitudinal and seasonal distri-butions of incoming solar radiation induced by the astronom-ical parameters (precession, obliquity, and eccentricity) are the most probable driving forces for the orbital-scale climate changes and glacial cycles. For example, Yao et al. (1997) examined the relationship between June incoming solar radi-ation at 60◦N and the Guliyaδ18O-temperature proxy record and found that the appearance of 21-ka cycles in the Guliya
δ18O-temperature proxy record indicates a close connection of Guliyaδ18O-temperature proxy record with the astronom-ical parameters. The former led to the latter approximately one-quarter phase of the precession cycle (5 ka), which in-dicated the effect of incoming solar radiation on the Guliya
δ18O-temperature proxy record. Due to the seasonal and lat-itudinal asymmetries of incoming solar radiation induced by the precessional motion (Milankovitch, 1969; Berger, 1978), the Guliya δ18O-temperature proxy record possibly con-tains climate varying signals in particular seasons and lat-itudes and the variations of these astronomical parameters possibly exert influences on variability of the Guliyaδ18 O-temperature proxy record (Yao et al., 1997).
Although the Guliya δ18O-temperature proxy record, which is used to indicate the local temperature, has been ex-tensively investigated, the seasonal and spatial climate ranges represented by the Guliya δ18O-temperature proxy record and the climatic relationship on longer timescales between the Guliyaδ18O-temperature proxy record and the ocean– atmosphere systems remain unclear (Zhang et al., 1995; Yao et al., 1996a). For example, does the Guliya δ18 O-temperature proxy record represent the O-temperature of any one season? How are the spatial patterns of differences be-tween the extreme warm and cold phases of the precession
cycle in the Guliya SAT and what are the associated rea-sons? Are the large-scale ocean and atmosphere systems re-lated to variability of the Guliya δ18O-temperature proxy record? If yes, what is the possible reason in the model re-sult for this link? With these questions in mind, we em-ploy an intermediate-complexity coupled ocean–atmosphere climate model to understand the geographical and seasonal implications and the indicative properties of the Guliya
δ18O-temperature proxy record with respect to the ocean– atmosphere systems and to discuss the possible reasons.
The rest of this paper is organized as follows. The model and methods are described in Sect. 2. A comparison between
δ18O-temperature proxy record and the simulated SAT in Guliya is investigated in Sect. 3 to determine in which sea-son the simulated Guliya SAT is consistent with the Guliya
δ18O-temperature proxy record. The indicative senses of the Guliya SAT to the simulated ocean–atmosphere system in August–September are explored in Sect. 4. The relation be-tween Guliyaδ18O-temperature proxy record and August– September ocean–atmosphere system and possible reasons are discussed in Sect. 5. A summary and a discussion are presented in Sect. 6.
2 Model and methods
This study employs version 2.9 of the UVic Earth Sys-tem Climate Model (UVic Model) with a resolution of 3.6◦ in longitude and 1.8◦ in latitude. The UVic Model is an intermediate-complexity coupled atmosphere-ocean model (Weaver et al., 2001) in which the atmospheric model com-prises a single-layer energy–moisture balance model and the ocean component utilizes version 2.2 of the GFDL Modular Ocean Model with 19 vertical levels. The UVic Model can capture several major features of global surface temperature and precipitation and has been widely used in paleoclimate research (Weaver et al., 2001; Matthews et al., 2004; Stouffer et al., 2006; Weber et al., 2007; Fyke et al., 2011). Moreover, the UVic Model can also reproduce variations of temperature in China and the NH during the past millennium (Xiao et al., 2012).
D. Xiao et al.: Modeling the climatic implications of temperature proxy record 737
Copernicus Publications
Bahnhofsallee 1e 37081 Göttingen Germany
Martin Rasmussen (Managing Director) Nadine Deisel (Head of Production/Promotion)
Contact
[email protected] http://publications.copernicus.org Phone +49-551-900339-50 Fax +49-551-900339-70
Legal Body
Copernicus Gesellschaft mbH Based in Göttingen Registered in HRB 131 298 County Court Göttingen Tax Office FA Göttingen USt-IdNr. DE216566440
Page 2/15
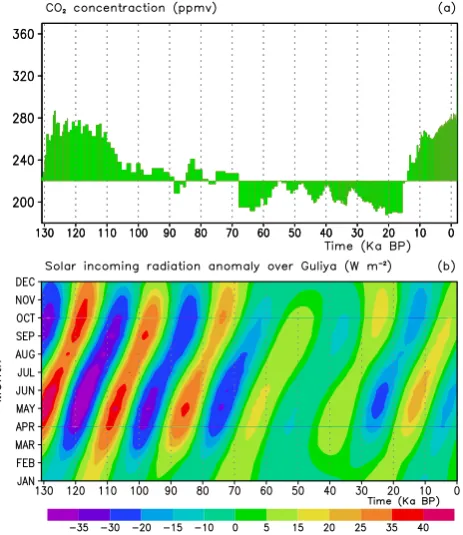
Fig. 1. (a) CO2 concentration and (b) annual cycles of incoming solar radiation
anomaly relative to the climatological mean over the past 130 ka. The abscissa is
time before the present, and the ordinate in (b) is the month of a year.
Fig. 1. (a) CO2concentration and (b) annual cycles of incoming
solar radiation anomaly relative to the climatological mean over the past 130 ka. The abscissa is time before the present, and the ordinate in (b) is the month of a year.
simulations (Jackson and Broccoli, 2003; Timm and Tim-mermann, 2007; Timmermann et al., 2007; Kutzbach et al., 2008). Lorenz and Lohmann (2004) showed that acceleration factors of 10 and 100 yield similar results. Timm and Tim-mermann (2007) compared advantages and disadvantages of the acceleration technique and found out that a large devia-tion of the accelerated simuladevia-tion from the non-accelerated simulation mainly occurs in the southern parts of the South-ern Hemisphere (SH) oceans, in regions of deep-water for-mation, large thermal inertia, and below the thermocline, while the deviation is small in SAT and surface sea temper-ature (SST). In the present study, we focus on the indicative senses of the Guliyaδ18O-temperature proxy record in the middle and low latitudes.
In our simulation the used time-dependent astronomical forcing (due to changes in longitude of perihelion, axial tilt and eccentricity) is calculated according to Berger (1978). The CO2reconstructions (Fig. 1a), obtained from a
combi-nation with several reconstructions (Inderm¨uhle et al., 1999, 2000; Petit et al., 1999; Smith et al., 2000), shows an obvious glacial cycle with higher CO2 concentration during 130.8–
68 ka BP and 15–present, and lower CO2concentration
be-tween them. The UVic Model has first been spun up for 200 model years. Then we accelerate the astronomical and CO2
forcings by a factor of 50, i.e., the astronomical parameters and CO2concentration are advanced by 50 yr at the end of
each year in the simulation. We use the acceleration factor of 50 because of the limitation of our computer resources. Cer-tainly, the less the acceleration factor is, the better the accel-erated simulation is. The others climate forcings, such as ice sheets and solar insolation variability (solar constant), which are absent during the majority of the past 130 ka, are set to the constants at the year 2000 AD throughout the entire sim-ulation. The accelerated simulation runs from 130.8 ka BP to the present. The 2616 time samples (corresponding to the pe-riod from 130.8 ka BP to the present) of the model output are analyzed in this study.
The modeled SAT over the Guliya region is an average over 80–85◦E, 33–38◦N. During the past 130.8 ka, because there are 2616 model years in this simulation with an accel-eration factor of 50 and 1162 samples in the Guliyaδ18 O-temperature proxy record obtained from Yao et al. (1997), they are both linearly interpolated into the 1308 sample sizes (at the same temporal grids for a sample correspond-ing to each hundred years) to offset their temporal resolu-tion difference when they are compared. It needs to be noted that the simulated variables are not smoothed in this study, which look likely very smooth because the variability of the model itself is much less than the variability due to the or-bital forcing. The time series of simulated Guliya August– September SAT (see Sect. 3), which is much more even than the Guliyaδ18O-temperature proxy record, is generally equal to an approximately 51-yr moving mean of the Guliyaδ18 O-temperature proxy record. However, for the 51-yr moving mean time series over 1308 yr, the effective free degree de-creases and the significant critical value of correlation co-efficient increases. Therefore, a Monte Carlo Simulation is employed to give a more strict critical value of the correla-tion coefficient between two time series with 1308 samples both after the 51-yr moving mean, which is 0.26 (0.37, 0.47) at the 95 % (99 %, 99.9 %) confidence level. The monthly mean SAT from the Climate Research Unit (CRU) analysis with a horizontal resolution of 0.5×0.5◦during 1901–2009 (Mitchell and Jones, 2005) is used to compare the annual cy-cles between the CRU analysis data and the simulated SAT in Guliya.
Correlation and composite analyses are applied to exam-ine the relationships between pairs of variables. Lagging and leading correlations and a squared wavelet coherence analy-sis (Grinsted et al., 2004) are employed to examine the phase relationships between different variables. A power spectrum analysis is performed to display the orbital periods of the Guliya δ18O-temperature proxy record using the REDFIT software in MATLAB (Schulz and Mudelsee, 2002).
3 A comparison betweenδ18O-temperature proxy
record and the simulated SAT in Guliya
738 D. Xiao et al.: Modeling the climatic implications of temperature proxy record
Copernicus Publications
Bahnhofsallee 1e 37081 Göttingen Germany
Martin Rasmussen (Managing Director) Nadine Deisel (Head of Production/Promotion)
Contact
[email protected] http://publications.copernicus.org Phone +49-551-900339-50 Fax +49-551-900339-70
Legal Body
Copernicus Gesellschaft mbH Based in Göttingen Registered in HRB 131 298 County Court Göttingen Tax Office FA Göttingen USt-IdNr. DE216566440
Page 3/15
Fig. 2. Correlation coefficients (open squares) between the Guliya δ18O -
temperature proxy record and the simulated Guliya monthly mean SAT with the
1308 samples. The horizontal short-dashed and long-dashed lines indicate the
95% and 99% confidence levels, respectively.
Fig. 2. Correlation coefficients (open squares) between the Guliya
δ18O-temperature proxy record and the simulated Guliya monthly mean SAT with the 1308 samples. The horizontal short-dashed and long-dashed lines indicate the 95 and 99 % confidence levels, respectively.
directly related to precession (Yao et al., 1997). However, the incoming solar radiation, as a forcing of the Guliyaδ18 O-temperature proxy record, differs between the twelve months of the year due to precessional motion (Milankovitch, 1969; Berger, 1978). Thus, we first examine the annual cycle of the Guliya incoming solar radiation. Figure 1b shows the an-nual cycle of the Guliya incoming solar radiation anomaly in the past 130 ka. In this figure the annual cycle of the Guliya incoming solar radiation anomaly exhibits approximately eleven vertical belts toward the right, with a varying range of approximately 75 W m−2, and the largest variability of in-coming solar radiation generally occurs in May. Moreover, the incoming solar radiation anomaly also shows a weaken-ing trend over the past 130 ka and is much weaker from 60 ka BP to the present, which might be due to a smaller varia-tion of precessional movaria-tion during this period (Figure not shown) that is modulated by a smaller eccentricity accord-ing to the astronomic climate theory (Milankovitch, 1969; Berger, 1978).
Corresponding to the variation of incoming solar radiation over the Guliya region, the annual cycle of the Guliya SAT anomaly also exhibits the similar pattern (Figure not shown), which is one month later compared to that of the incoming solar radiation anomaly. This delayed response of SAT to in-coming solar radiation in the Guliya region indicates a pos-sible forcing of the latter on the former in the past 130 ka. Then, are the incoming solar radiation and SAT anomalies in the Guliya region indicated by the Guliyaδ18O-temperature proxy record?
Because the phase of the precession cycle of June in-coming solar radiation at 60◦N is approximately one-quarter phase ahead of that in Guliyaδ18O-temperature proxy record (Yao et al., 1997), the variability of the Guliya δ18 O-temperature proxy record is possibly synchronous with the variation of the simulated Guliya SAT in a certain month that lags to the June incoming solar radiation. Here we examine the relationship between the annual Guliyaδ18O-temperature
Copernicus Publications
Bahnhofsallee 1e 37081 Göttingen Germany
Martin Rasmussen (Managing Director) Nadine Deisel (Head of Production/Promotion)
Contact
[email protected] http://publications.copernicus.org Phone +49-551-900339-50 Fax +49-551-900339-70
Legal Body Copernicus Gesellschaft mbH Based in Göttingen Registered in HRB 131 298 County Court Göttingen Tax Office FA Göttingen USt-IdNr. DE216566440
Page 4/15
Fig. 3. Time series of the simulated Guliya August–September SAT (red line, left
ordinate) and the Guliya δ18O - temperature proxy record (green line, right
ordinate). The correlation coefficient (R) between them is 0.55, significant at the
99.9% confidence level.
Fig. 3. Time series of the simulated Guliya August–September SAT
(red line; left ordinate) and the Guliya δ18O-temperature proxy record (green line; right ordinate). The correlation coefficient (R) between them is 0.55, significant at the 99.9 % confidence level.
proxy record and the simulated Guliya SAT from January to December. Figure 2 presents the correlation coefficients between the Guliyaδ18O-temperature proxy record and the simulated Guliya monthly mean SAT from January to De-cember, respectively. In this figure the correlation coefficient gradually increases from January to August and decreases from September to December, and there are positive corre-lation coefficients of 0.53 in August and 0.50 in Septem-ber (both significant at the 99.9 % confidence level), 0.35 in July (significant at the 95% confidence level), and not significant correlation coefficients (not exceeding the 95 % confidence level) in the others months. This result implies that the Guliyaδ18O-temperature proxy record closely con-nects to the simulated SAT in August and September be-cause the correlation coefficient between the Guliyaδ18 O-temperature proxy record and the simulated Guliya SAT is higher in August–September than in July–September. Other
D. Xiao et al.: Modeling the climatic implications of temperature proxy record 739
Fig. 4. Power spectrum of the non-smoothed Guliya δ18
O-temperature proxy record with 1308 samples.
proxy record, respectively. The correlation analysis exhibits a positive correlation coefficient of 0.55 between the Guliya
δ18O-temperature proxy record and the simulated August– September SAT, significant at the 99.9 % confidence level. In brief the simulated August–September Guliya SAT is well correlated to the Guliyaδ18O-temperature proxy record, and generally captures the 21-ka precession cycles of the Guliya
δ18O-temperature proxy record.
To understand whether the simulated August–September SAT captures the varying periods of the δ18O-temperature proxy record in Guliya, we perform a power spectrum anal-ysis (Fig. 4). The result reveals three periods of the Guliya
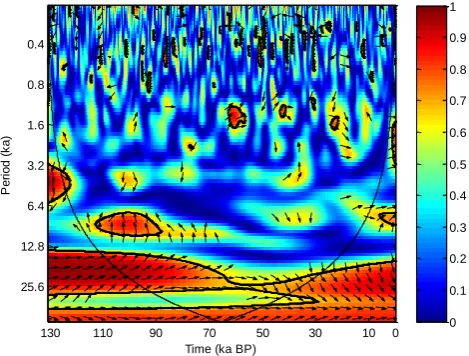
δ18O-temperature proxy record. The first is at 43.6 ka (signif-icant at the 99 % confidence level), the second is at 20.762 ka (significant at the 99 % confidence level), and the third is at 10.634 ka (a peak of red noise) (Fig. 4). It is evident that the first two periods correspond to the periods of the obliquity and the precession, respectively, which indicates the possible controls of obliquity variation and precessional motion on the Guliyaδ18O-temperature proxy record over the past 130 ka. The similar periods (42.857, 21.799, and 10.714 ka) are also detected in the simulated Guliya August–September SAT (figure not shown) and the precession cycle in both the sim-ulated Guliya August–September SAT and the Guliyaδ18 O-temperature proxy record is more obvious than the obliquity cycle. Moreover, we also analyze the squared wavelet co-herence between the Guliyaδ18O-temperature proxy record and the simulated August–September Guliya SAT (Fig. 5). In this figure, the arrows at the period of 21-ka preces-sion generally point rightward and upward before 60 ka BP and afterwards point rightward and downward, and the ar-rows at the period of 43-ka obliquity point rightward dur-ing the entire 130 ka. These results show the arrows toward the right generally, indicating an in-phase relationship be-tween the Guliya δ18O-temperature proxy record and the
Copernicus Publications
Bahnhofsallee 1e 37081 Göttingen Germany
Martin Rasmussen (Managing Director) Nadine Deisel (Head of Production/Promotion)
Contact
[email protected] http://publications.copernicus.org Phone +49-551-900339-50 Fax +49-551-900339-70
Legal Body
Copernicus Gesellschaft mbH Based in Göttingen Registered in HRB 131 298 County Court Göttingen Tax Office FA Göttingen USt-IdNr. DE216566440
Page 6/15
Time (ka BP)
P
e
ri
o
d
(
k
a
)
130 110 90 70 50 30 10 0
0.4
0.8
1.6
3.2
6.4
12.8
25.6
0 0.1 0.2 0.3 0.4 0.5 0.6 0.7 0.8 0.9 1
Fig. 5. Squared wavelet coherence between the simulated August–September
Guliya SAT and the Guliya δ18O - temperature proxy record. The 5% significance
level against red noise is shown as a thick line. The arrow points rightward for an
in-phase relationship and points leftwards for an anti-phase relationship.
Fig. 5. Squared wavelet coherence between the simulated August–
September Guliya SAT and the Guliya δ18O-temperature proxy record. The 5 % significance level against red noise is shown as a thick line. The arrow points rightward for an in-phase relationship and points leftwards for an anti-phase relationship.
simulated local August–September SAT at the periods of 21-ka precession and 43-21-ka obliquity, further supporting the re-sult from Fig. 3.
The foregoing analyses show that the Guliya δ18 O-temperature proxy record mainly reflects the variability of the local August–September SAT in the simulation under the CO2 and orbital forcings. The consistency in periods
(21-ka precession and 43-(21-ka obliquity cycles) and phase between the simulated August–September Guliya SAT and the Guliya
δ18O-temperature proxy record also demonstrates the relia-bility of the simulated August–September Guliya SAT.
4 Indicative senses of Guliya SAT to the simulated ocean–atmosphere system in August–September
740 D. Xiao et al.: Modeling the climatic implications of temperature proxy record
Copernicus Publications Bahnhofsallee 1e 37081 Göttingen Germany
Martin Rasmussen (Managing Director) Nadine Deisel (Head of Production/Promotion)
Contact
[email protected] http://publications.copernicus.org Phone +49-551-900339-50 Fax +49-551-900339-70
Legal Body
Copernicus Gesellschaft mbH Based in Göttingen Registered in HRB 131 298 County Court Göttingen Tax Office FA Göttingen USt-IdNr. DE216566440
Page 7/15
Fig. 6
. Composite differences in the simulated August–September SAT between
the extreme warm and cold phases (the former minus the latter) of the five
precession cycles in the Guliya August–September SAT, in which the times of the
extreme warm and cold phases are indicated above each panel. The shaded areas
represent the values significant at the 95% confidence level.
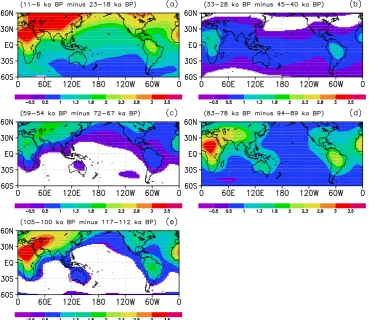
Fig. 6. Composite differences in the simulated August–September SAT between the mean values of the extreme warm and cold phases (the
former minus the latter) of the five precession cycles in the Guliya August–September SAT, in which the times of the extreme warm and cold phases are indicated above each panel. The shaded areas represent the values significant at the 95 % confidence level.
4.1 Indicative sense to the simulated August–September SAT
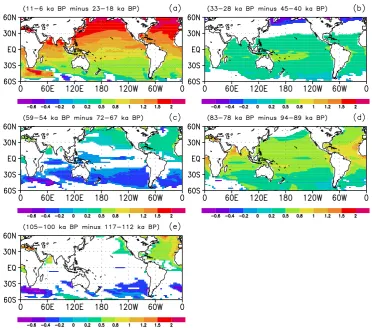
Figure 6a displays the composite difference of the simu-lated August–September SAT between the mean values of 11–6 ka BP and 23–18 ka BP (the former minus the latter), which corresponds to a difference between the extreme warm phase and the extreme cold phase of the last precession cy-cle in the simulated August–September Guliya SAT. Com-pared with the cold phase in 23–18 ka BP, the mean SAT in the warm phase during 11–6 ka BP is significantly warmer over the NH, and large temperature anomalies occur over the Asian and African continents, with a maximum value of approximately 3.2◦C. The temperature anomalies over the SH and the ocean are weaker than those over the NH and the land. The anomalies generally increase toward the Arc-tic because the orbital forcing impacts greater effects at the poles. A similar anomalous pattern also occurs between the mean values of 59–54 and 72–67 ka BP (Fig. 6c), and be-tween these of 105–100 and 117–112 ka BP (Fig. 6e); that is, there are higher (lower) temperature anomalies over the NH (SH) when the August–September Guliya SAT is higher.
However, another anomalous pattern in SAT also occurs between the high and low Guliya August–September SAT cases. Figure 6b presents the composite difference in SAT be-tween the mean values of the extreme warm and cold phases of the penultimate precession cycle in the simulated August– September Guliya SAT. In this figure the SAT anomalies generally show an increase toward the equator, and relative to that of 45–40 ka BP, the mean SAT in 33–28 ka BP was warmer over the majority of regions except the NH high lat-itudes, with anomalous warm centers approximately 1.2◦C in Africa and South America. A similar anomalous pattern is also observed in Fig. 6d. This result reveals an alternation (with an approximately 43-ka cycle) of two anomalous SAT patterns between the warm and cool phases of the five pre-cession cycles in the Guliya August–September SAT. Then, why do these two anomalous SAT patterns occur and alter-nate with a period of approximately 43 ka?
D. Xiao et al.: Modeling the climatic implications of temperature proxy record 741
Copernicus Publications
Bahnhofsallee 1e 37081 Göttingen Germany
Martin Rasmussen (Managing Director) Nadine Deisel (Head of Production/Promotion)
Contact
[email protected] http://publications.copernicus.org Phone +49-551-900339-50 Fax +49-551-900339-70
Legal Body
Copernicus Gesellschaft mbH Based in Göttingen Registered in HRB 131 298 County Court Göttingen Tax Office FA Göttingen USt-IdNr. DE216566440
Page 8/15
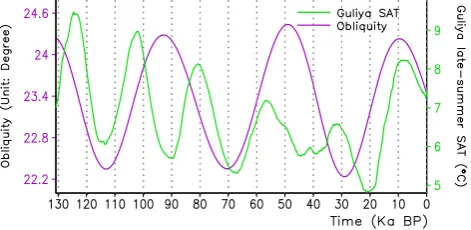
Fig. 7. Simulated August–September Guliya SAT (green; right ordinate) and
obliquity (purple; left ordinate) in the past 130 ka.
Fig. 7. Simulated August–September Guliya SAT (green; right
or-dinate) and obliquity (purple; left oror-dinate) in the past 130 ka.
in latitudes (Berger et al., 1993). Thus, the two anomalous patterns of SAT are associated with not only the precession cycle but also the obliquity cycle. To understand the contri-butions of the precession and obliquity variations to these two anomalous patterns, following Yin and Berger (2010, 2012), we examine the temporal evolutions of the obliquity and the simulated Guliya SAT (indicating the local influence of precession). Figure 7 shows the temporal curves for the obliquity and the simulated August–September Guliya SAT during the past 130 ka. For the first type of the anomalous SAT pattern (shown in Fig. 6a, c, and e), the precession minima (maxima) in the simulated Guliya SAT is more or less synchronous with the obliquity minima (maxima), which strengthens the August–September incoming solar radiation in the NH. For the second type of the anomalous SAT pat-tern (shown in Fig. 6b and d), there is a general anti-phase relationship between the precession minima (maxima) in the simulated Guliya SAT and the obliquity maxima (minima), which weakens the incoming solar radiation in the NH high latitudes. It is evident that the first anomalous SAT pattern may result from the in-phase superposition between the pre-cession and obliquity cycles and the second anomalous SAT pattern may be due to the anti-phase counteraction between the precession and obliquity cycles. The alternation of these two anomalous SAT patterns with approximately 43-ka cy-cles may be associated with the obliquity cycle. Thus, the simulated Guliya SAT may indicate the in-phase and anti-phase varying features of SAT in 21-ka precession and 43-ka obliquity cycles.
4.2 Indicative sense to annual cycles in Guliya and NH
In this section we investigate the differences of annual cycle in the simulated Guliya SAT between the extreme warm and cold phases of the five 21-ka precession cycles in the simu-lated Guliya August–September SAT. Firstly, a comparison of the Guliya SAT annual cycle between a mean value of 100-yr CRU analysis dataset and that of the last 1000-yr or 100-yr in this simulation (equal to last twenty or two model years) shows the similar variations with warm temperature in
June–July and cold temperature in December–January, iden-tifying the performance of the UVic Model in describing the annual cycle of SAT, but which does not mean that the simulated SAT annual cycle under the orbital and CO2
forc-ings is generally consistent with that of the CRU data under the real forcings including the ice sheets. Figure 8 presents the annual cycle of the modeled Guliya SAT in the extreme warm and cold phases and their differences. In the figure, the annual cycle shows the similar features for each extreme warm phase and each extreme cold phase of the five preces-sion cycles in Guliya SAT, with the highest temperature in June and July and the lowest temperature in December and January. Compared with the extreme cold phase, the Guliya SAT in the extreme warm phase is generally higher in the warm season (May–September) and lower in the cold sea-son (October–April) (Fig. 8a, c–e), which indicates a larger seasonal variation in the extreme warm phase than in the extreme cold phase. For example, the annual range of July (January) temperature between the extreme warm and cold phases varied from 0.5◦C (0◦C) (Fig. 8b) to 3.5◦C (2.5◦C) (Fig. 8e). This result exhibits a larger temperature difference between the extreme warm and cold phases in summer than in winter. Moreover, it is also seen from Fig. 8 that the dif-ference of the annual cycle in the Guliya SAT between the extreme warm and cold phases of the five precession cy-cles in the August–September Guliya SAT shows the similar feature, which suggests the little influence of the obliquity cycle on the annual cycle of the Guliya SAT. Our analysis further reveals the similarly varying feature of the simulated NH temperature. Therefore, the warm-season (cold-season) Guliya and NH temperatures are higher (lower) in the ex-treme warm phases of these precession cycles in the Guliya SAT than in the extreme cold phases.
4.3 Indicative sense to the simulated August–September SST
742 D. Xiao et al.: Modeling the climatic implications of temperature proxy record
Fig. 8. Annual cycles of the Guliya SAT in the extreme warm (closed circles) and cold phases (open squares) of the August–September
Guliya SAT and their difference (warm phase minus cold phase: open circle). The times of the extreme warm and cold phases are indicated in each panel.
incoming solar radiation in the NH, while the second anoma-lous SST pattern is induced by the anti-phase counteraction between the precession and obliquity cycles, which decreases the August–September incoming solar radiation over the NH high latitudes.
5 Relation between the Guliyaδ18O-temperature proxy record and the simulated ocean–atmosphere
system and possible reasons
It is seen from Sect. 3 that the Guliya δ18O-temperature proxy record may reflect the variation of the local August– September SAT. Here we further focus on the relationship between the Guliyaδ18O-temperature proxy record and the
D. Xiao et al.: Modeling the climatic implications of temperature proxy record 743
Copernicus Publications Bahnhofsallee 1e 37081 Göttingen Germany
Martin Rasmussen (Managing Director) Nadine Deisel (Head of Production/Promotion)
Contact
[email protected] http://publications.copernicus.org Phone +49-551-900339-50 Fax +49-551-900339-70
Legal Body
Copernicus Gesellschaft mbH Based in Göttingen Registered in HRB 131 298 County Court Göttingen Tax Office FA Göttingen USt-IdNr. DE216566440
Page 11/15
Fig. 9
. Same as in Fig. 6 but for SST.
Fig. 9. Same as in Fig. 6, but for SST.
Figure 11 further presents the correlation coefficients be-tween the Guliya δ18O-temperature proxy record and the August–September SST over the past 130 ka. In this figure, significant positive correlation coefficients mainly appear in the North Atlantic, the Bering Sea, the Bay of Alaska, and the Arctic region to the north of Europe, with the maximum correlation coefficient exceeding 0.5 in the North Atlantic. Some geological evidence also supports this simulation in the Atlantic. For example, the correlation coefficient between the reconstructed equatorial Atlantic SST at 2◦300N, 9◦230E (Weldeab et al., 2007) and Guliyaδ18O-temperature proxy record is 0.18 (significant at the 90 % confidence level), gen-erally consistent with that (0.3, significant at the 95 % con-fidence level) in Fig. 11. Similarly, the correlation coeffi-cient between the Guliyaδ18O-temperature proxy record and the reconstructed summer North Atlantic SST at 55◦90N,
14◦20W (Oppo et al., 2006) is 0.43, also similar to that (0.4)
in Fig. 11. Both of the comparisons with the reconstructed Atlantic SST support the reliability of our model result in the Atlantic. These results also suggest a close link between the Guliyaδ18O-temperature proxy record and the Atlantic SST in the past 130 ka. Figure 12a shows the leading and lagging correlation coefficients between the simulated Guliya SAT and the North Atlantic SST in August–September. It is seen
from this figure that the maximum positive correlation oc-curs near 2.3 ka, which indicates that the simulated Guliya August–September SAT lags the simulated North Atlantic August–September SST by 2.3 ka (equal to 46 model years with an acceleration factor of 50). Then, what are possible reasons responsible for this link? One possible explanation is given below.
744 D. Xiao et al.: Modeling the climatic implications of temperature proxy record
Copernicus Publications
Bahnhofsallee 1e 37081 Göttingen Germany
Martin Rasmussen (Managing Director) Nadine Deisel (Head of Production/Promotion)
Contact
[email protected] http://publications.copernicus.org Phone +49-551-900339-50 Fax +49-551-900339-70
Legal Body
Copernicus Gesellschaft mbH Based in Göttingen Registered in HRB 131 298 County Court Göttingen Tax Office FA Göttingen USt-IdNr. DE216566440
Page 12/15
Fig. 10. Correlation coefficients between the Guliya δ18O - temperature proxy
record and the simulated August–September SAT with the 1308 samples. The
shading indicates the correlation coefficients significant at the 95% confidence
level.
Fig. 10. Correlation coefficients between the Guliya δ18
O-temperature proxy record and the simulated August–September SAT with the 1308 samples. The shading indicates the correlation coefficients significant at the 95 % confidence level.
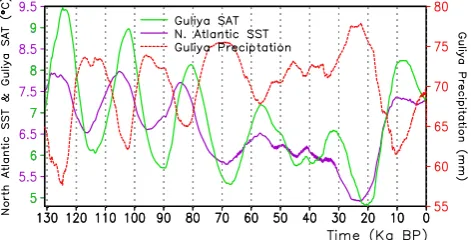
fifth peaks (valleys) and the sixth peak of the Guliya SAT lag those of the Guliya precipitation, which lag those of the North Atlantic SST. The similar link may also be indicated in the present climate. For example, the summer North Atlantic SST modulates the Asian precipitation by influencing the Europe–Asia atmosphere circulation on decadal timescales illustrated by modern reanalysis data and simulations (Sut-ton and Hodson, 2005; Dong et al., 2006; Wang et al., 2009; Feliks et al., 2011). When such physical phenomenon be-tween the North Atlantic SST and Asian precipitation on decadal timescale is consistent with that in UVic Model on a longer timescale, the mechanism in the decadal physical phe-nomenon may take effect on a longer timescale. Therefore, the anomalous signal from the North Atlantic SST might af-fect the Guliya SAT and then be kept in the Guliya precipita-tion record. Such an effect may lead to a close link between the Guliya SAT and the North Atlantic SST, in which the Guliya precipitation may act as a “bridge” linking the North Atlantic SST and the Guliya SAT.
6 Summary and discussion
We employ the UVic Model with the accelerated orbital and CO2 forcings by a factor of 50 to examine the
cli-mate implications and indicative nature of the Guliyaδ18 O-temperature proxy record to the ocean and atmosphere sys-tems over the past 130 ka. The result shows that the simu-lated August–September Guliya temperature, which is highly related to the Guliyaδ18O-temperature proxy record, gen-erally captures the major varying features and periods (in-cluding the 43-ka obliquity and 21-ka precession cycles) of the Guliya δ18O-temperature proxy record. Therefore, the Guliyaδ18O-temperature proxy record possibly indicates the local August–September SAT. Meanwhile, the Guliyaδ18 O-temperature proxy record may also indicate the simulated NH SAT in these months.
Copernicus Publications
Bahnhofsallee 1e 37081 Göttingen Germany
Martin Rasmussen (Managing Director) Nadine Deisel (Head of Production/Promotion)
Contact
[email protected] http://publications.copernicus.org Phone +49-551-900339-50 Fax +49-551-900339-70
Legal Body
Copernicus Gesellschaft mbH Based in Göttingen Registered in HRB 131 298 County Court Göttingen Tax Office FA Göttingen USt-IdNr. DE216566440
Page 13/15
Fig. 11. Same as in Fig. 10 but for the correlation between the Guliya δ18O -
temperature proxy record and the simulated August–September SST.
Fig. 11. Same as in Fig. 10, but for the correlation between the
Guliyaδ18O-temperature proxy record and the simulated August– September SST.
Copernicus Publications
Bahnhofsallee 1e 37081 Göttingen Germany
Martin Rasmussen (Managing Director) Nadine Deisel (Head of Production/Promotion)
Contact
[email protected] http://publications.copernicus.org Phone +49-551-900339-50 Fax +49-551-900339-70
Legal Body Copernicus Gesellschaft mbH Based in Göttingen Registered in HRB 131 298 County Court Göttingen Tax Office FA Göttingen USt-IdNr. DE216566440
Page 14/15
Fig. 12. Leading and lagging correlation coefficients (solid lines) between the
simulated Guliya August–September SAT and (a) the North Atlantic (30°W–30°E,
60°–75°N) August–September SST and (b) the Guliya August–September
precipitation. The horizontal short-dashed lines represent the 95% confidence
level.
Fig. 12. Leading and lagging correlation coefficients (solid lines)
between the simulated Guliya August–September SAT and (a) the North Atlantic (30◦W–30◦E, 60◦–75◦N) August–September SST and (b) the Guliya August–September precipitation. The horizontal short-dashed lines represent the 95 % confidence level.
D. Xiao et al.: Modeling the climatic implications of temperature proxy record 745
Copernicus Publications
Bahnhofsallee 1e 37081 Göttingen Germany
Martin Rasmussen (Managing Director) Nadine Deisel (Head of Production/Promotion)
Contact
[email protected] http://publications.copernicus.org Phone +49-551-900339-50 Fax +49-551-900339-70
Legal Body
Copernicus Gesellschaft mbH Based in Göttingen Registered in HRB 131 298 County Court Göttingen Tax Office FA Göttingen USt-IdNr. DE216566440
Page 15/15
Fig. 13. The simulated August–September Guliya SAT (green; left ordinate),
North Atlantic SST (30°W–30°E, 60°–75°N) (purple; left ordinate) and
precipitation (red; right ordinate).
Fig. 13. The simulated August–September Guliya SAT (green;
left ordinate), North Atlantic SST (30◦W–30◦E, 60◦–75◦N) (pur-ple; left ordinate) and precipitation (red; right ordinate).
The simulated Guliya temperature is closely related to the simulated North Atlantic SST in August–September, and lags the North Atlantic SST by approximately 46 model years (equal to 2.3 ka) and lags the simulated Guliya precip-itation by 38 model years (equal to 1.9 ka) with an acceler-ation factor of 50. This result suggests a possible effect of the North Atlantic SST on the Guliya temperature, in which precipitation in Guliya is possibly a “bridge” connecting the local temperature with the North Atlantic SST.
Our simulations also show that the results under both the orbital and CO2forcings have not been changed essentially
with those only under the orbital forcing, which shows that the incoming solar radiation may be a main forcing to varia-tions of the Guliyaδ18O-temperature proxy record. It is noted that the influence of ice sheet changes is also important to the climatic variations over the past 130 ka. In this study, how-ever, ice sheets do not vary throughout the entire simulation due to the absence of the ice sheet reconstructions during the 130–21 ka BP. It is possible that our simulated results using 2000 AD ice sheet conditions may approach the inter-glacial climate, which might induce a bias in the correlation between the Guliyaδ18O-temperature proxy record and SST (shown in Fig. 11) when ice sheet changes are considered in the simulation. Thus, in the future, investigation needs to be done on the climate changes under the ice sheet forcing when the ice sheet reconstructions over the past 130 ka are available. Recently, the simulated ice sheet changes were also employed as the ice sheet forcing in the past 120 ka (Smith and Gregory, 2012). Moreover, in this study, we show a link between the simulated North Atlantic SST and Guliya SAT in August–September and give a possible explanation. How-ever, the UVic Model with a single-layer atmosphere model and with a relative high acceleration factor in this simulation, which could not well exhibit atmospheric vertical circulation features, is not suitable for the analyses of the complex atmo-sphere processes. Thus, studies from more complex coupled ocean–land–atmosphere models and lower acceleration fac-tors are required in the future to reproduce this phenomenon and investigate the more detailed atmospheric processes.
Acknowledgements. We thank constructive comments from
anony-mous reviewers, and Tandong Yao for providing the Guliya ice core data and Ge Liu for using the software in MATLAB. This work was supported by the Special Foundation for National Science and Technology Major Project of China (2011FY120300), the key project of the NSFC (40894050), National Programs for Science and Technology (CHINARE2012-04-04), and the Basic Research Fund of CAMS.
Edited by: H. Renssen
References
Berger, A.: Long-term variations in daily insolation and quaternary climate changes, J. Atmos. Sci., 35, 2362–2367, 1978.
Berger, A., Loutre, M.-F., and Tricot, C.: Insolation and Earth’s orbital periods, J. Geophys. Res., 98, 10341–10362, doi:10.1029/93JD00222, 1993.
Dong, B., Sutton, R. T., and Scaife, A. A.: Multidecadal modula-tion of El Ni˜no-Southern Oscillamodula-tion (ENSO) variance by At-lantic Ocean sea surface temperatures, Geophys. Res. Lett., 33, L08705, doi:10.1029/2006GL025766, 2006.
Feliks, Y. M., Ghil, M., and Robertson, A. W.: The atmospheric circulation over the North Atlantic as induced by the SST field, J. Climate, 24, 522–542, 2011.
Fyke, J. G., Weaver, A. J., Pollard, D., Eby, M., Carter, L., and Mackintosh, A.: A new coupled ice sheet/climate model: de-scription and sensitivity to model physics under Eemian, Last Glacial Maximum, late Holocene and modern climate condi-tions, Geosci. Model Dev., 4, 117–136, doi:10.5194/gmd-4-117-2011, 2011.
Grinsted, A., Moore, J. C., and Jevrejeva, S.: Application of the cross wavelet transform and wavelet coherence to geophysical time series, Nonlinear Proc. Geoph., 11, 561–566, 2004. Hewitt, C. and Mitchell, J.: A fully coupled general circulation
model simulation of the climate of the mid-Holocene, Geophys. Res. Lett., 25, 361–364, 1998.
Inderm¨uhle, A., Stocker, T. F., Joos, F., Fische, H., Smith, H. J., Wahlen, M., Deck, B., Mastroianni, D., Tschumi, J., Blunier, T., Meyer, R., and Stauffer, B.: Holocene Carbon-cycle Dynamics Based on CO2Trapped in Ice at Taylor Dome, Antarctica,
Na-ture, 398, 121–126, 1999.
Inderm¨uhle, A., Monnin, E., Stauffer, B., Stocker, T. F., and Wahlen, M.: Atmospheric CO2concentration from 60 to 20 Kyr BP from the Taylor Dome Ice Core, Antarctica, Geophys. Res. Lett., 27, 735–738, 2000.
Jackson, C. S. and Broccoli, A. J.: Orbital forcing of Arctic climate: mechanisms of climate response and implications for continental glaciation, Clim. Dynam., 21, 539–557, 2003.
Kutzbach, J. E.: Monsoon climate of the early Holocene: Climate experiment with the Earth’s orbital parameters for 9000 years ago, Science, 214, 59–61, 1981.
Kutzbach, J. E., Liu, X. D., and Liu, Z. Y.: Simulation of the evolu-tionary response of global summer monsoons to orbital forcing over the past 280,000 years, Clim. Dynam., 30, 567–579, 2008. Li, Z. Q., Sun, J. Y., Hou, S. G., Tian, L. D., and Liu, B. Z.:
746 D. Xiao et al.: Modeling the climatic implications of temperature proxy record
Liu, Z., Wang, Y., Gallimore, R., Notaro, M., and Prentice, I. C.: On the cause of abrupt vegetation collapse in North Africa during the Holocene: climate variability vs. vegetation feedback, Geophys. Res. Lett., 33, L22709, doi:10.1029/2006GL028062, 2006. Lorenz, S. J. and Lohmann, G.: Accelerated technique for
Mi-lankovitch type forcing in a coupled atmosphere-ocean circula-tion model: method and applicacircula-tion for the Holocene, Clim. Dy-nam., 23, 727–743, 2004.
Matthews, H. D., Weaver, A. J., Meissner, K. J., Gillett, N. P., and Eby, M.: Natural and anthropogenic climate change: Incorporat-ing historical land cover change, vegetation dynamics and the global carbon cycle, Clim. Dynam., 22, 461–479, 2004. Milankovitch, M.: Canon of insolation and the ice-age problem
(Beograd Koniglidh Serbische Akademie, 1941), English trans-lation by the Israel program for scientific transtrans-lations, US depart-ment of Commerce and National Science Foundation, Washing-ton D C, 633 pp., 1969.
Mitchell, T. D. and Jones, P. D.: An improved method of con-structing a database of monthly climate observations and as-sociated high-resolution grids, Int. J. Climatol., 25, 693–712, doi:10.1002/joc.1181, 2005.
Montoya, M., von Storch, H., and Crowley, T.: Climate simulation for 125,000 years ago with a coupled ocean-atmosphere general-circulation model, J. Climate, 13, 1057–1072, 2000.
Oppo, D. W., McManus, J. F., and Cullen, J. L.: Evo-lution and demise of the Last Interglacial warmth in the North Atlantic, Quaternary Sci. Rev., 25, 3268–3277, doi:10.1016/j.quascirev.2006.07.006, 2006.
Petit, J. R., Jouzel, J., Raynaud, D., Barkov, N. I., Barnola, J.-M., Basile, I., Benders, M., Chappellaz, J., Davis, M., Delayque, G., Delmotte, M., Kotlyakov, V. M., Legrand, M., Lipenkov, V. Y., Lorius, C., P´epin, L., Ritz, C., Saltzman, E., and Stievenard, M.: Climate and atmospheric history of the past 420,000 years from the Vostok ice core, Antarctica, Nature, 399, 429–436, 1999. Reichart, G. J., Lourens, L. J., and Zachariasse, W. J.: Temporal
variability in the northern Arabian Sea oxygen minimum zone (OMZ) during the last 225,000 years, Paleoceanography, 13, 607–621, doi:10.1029/98PA02203, 1998.
Schulz, M. and Mudelsee, M.: REDFIT: Estimating red-noise spec-tra directly from unevenly spaced paleoclimatic time series, Comput. Geosci., 28, 421–426, 2002.
Shi, Y. F., Yao, T. D., and Yang, B.: Decadal climatic variations recorded in Guliya ice core and comparison with the historical documentary data from East China during the last 2000 years, Sci. China (Series D), 29, 79–86, 1999.
Short, D. A., Mengel, J. G., and Crowley, T. J.: Filtering of Mi-lankovitch cycles by Earth’s geography, Quaternary Res., 35, 157–173, 1991.
Smith, J., Fischer, H., Wahlen, M., Mastroianni, D., and Deck, B.: Dual Modes of the Carbon Cycle Since the Last Glacial Maxi-mum, Nature, 400, 248–250, 2000.
Smith, R. S. and Gregory, J.: The last glacial cycle: transient simulations with an AOGCM, Clim. Dynam., 38, 1545–1559, doi:10.1007/s00382-011-1283-y, 2012.
Stouffer, R. J., Yin, J., Gregory, J. M., Dixon, K. W., Spelman, M. J., Hurlin, W., Weaver, A. J., Eby, M., Flato, G. M., Hasumi, H., Hu, A., Jungclause, J. H., kamenkovich, I. V., Levermann, A., Montoya, M., Murakami, S., Nawrath, S., Oka, A., Peltier, W. R., Robitaille, D. Y., Sokolov, A., Vettoretti, G., and Weber, S.
L.: Investigating the causes of the response of the thermohaline circulation to past and future climate changes, J. Climate, 19, 1365–1387, 2006.
Sutton, R. T. and Hodson, D. L. R.: Atlantic Ocean forcing of North American and European summer climate, Science, 309, 115– 118, 2005.
Timm, O. and Timmermann, A.: Simulation of the Last 21 000 Years Using Accelerated Transient Boundary Conditions, J. Cli-mate, 20, 4377–4401, 2007.
Timmermann, A., Lorenz, S. J., An, S. I., Clement, A., and Xie, S. P.: The effect of orbital forcing on the mean climate and variability of the tropical Pacific, J. Climate, 20, 4147–4159, doi:10.1175/jcli4240.1, 2007.
Wang, Y., Li, S., and Luo, D.: Seasonal response of Asian mon-soonal climate to the Atlantic Multidecadal Oscillation, J. Geo-phys. Res., 114, D02112, doi:10.1029/2008JD010929, 2009. Weaver, A. J., Eby, M., Wiebe, E. C., Bitz, C. M., Duffy, P. B.,
Ewen, T. L., Fanning, A. F., Holland, M. M., MacFadyen, A., Matthews, H. D., Meissner, K. J., Saenko, O., Schmittner, A., Wang, H., and Yoshimori, M.: The UVic Earth System Climate Model: Model description, climatology, and applications to past, present and future climates, Atmos. Ocean, 39, 1–68, 2001. Weber, S. L., Drijfhout, S. S., Abe-Ouchi, A., Crucifix, M., Eby, M.,
Ganopolski, A., Murakami, S., Otto-Bliesner, B., and Peltier, W. R.: The modern and glacial overturning circulation in the Atlantic ocean in PMIP coupled model simulations, Clim. Past, 3, 51–64, doi:10.5194/cp-3-51-2007, 2007.
Weldeab, S., Lea, D. W., Schneider, R. R., and Ander-sen, N.: 155,000 Years of West African Monsoon and Ocean Thermal Evolution, Science, 316, 1303–1307, doi:10.1126/science.1140461, 2007.
Xiao, D., Zhou, X., and Zhao, P.: Numerical simulation study of temperature change over East China in the past millennium, Sci. China Earth Sci., 55, 1504–1517, doi:10.1007/s11430-012-4422-3, 2012.
Yang, Z. H., Yao, T. D., Huang, C. L., and Sun, W. Z.: Younger Drays record in the Guliya ice core, China Sci. Bull., 42, 1975– 1978, 1997.
Yao, T. D. and Wang, N. L.: Past, now and future of the ice core study, Chin. Sci. Bull., 42, 225–230, 1997.
Yao, T. D., Jiao, K. Q., Li, Z. Q., Shi, W. L., Li, Y. F., Liu, J. S., Huang, C. L., and Xie, C.: Climatic and environmental records in Guliya Ice Cap, Sci. China (Series D), 37, 766–773, 1994. Yao, T. D., Thompson, L. G., and Jiao, K. Q.: Recent warming as
recorded in the Qinghai-Tibetan cryosphere, Ann. Glaciol., 21, 196–200, 1995.
Yao, T. D., Lonnie, G., Thompson, E. M., Yang, Z., Zhang, X., and Lin, P. N.: Climatological significance ofδ18O in the north Ti-betan ice cores, J. Geophys. Res., 101, 29531–29537, 1996a. Yao, T. D., Qin, D. H., Tian, L. D., Jiao, K. Q., Yang, Z. H., and Xie,
C.: Variations in temperature and preipitation in the past 2000 years on the Xizang (Tibet) Plateau–Guliya ice core record, Sci. China (Series D), 26, 348–353, 1996b.
D. Xiao et al.: Modeling the climatic implications of temperature proxy record 747
Yao, T. D., Wang, N. L., and Shi, Y. F.: Climate and entironmen-tal changes recorded in the ice cores, in: Glaciers and Their Environments in China – the Present, Past and Future, edited by: Shi, Y. F., Science Press, Beijing, 411, 285–319, 2000.
Yao, T. D., Xu, B. Q., and Pu, J. C.: Climatic changes on orbital and sub-orbital time scale recorded by the Guliya ice core in Tibetan plateau, Sci. China (Series D), 31, 287–294, 2001.
Yin, Q. Z. and Berger, A.: Insolation and CO2contribution to the
interglacial climate before and after the Mid-Brunhes Event, Nat. Geosci., 3, 243–246, 2010.
Yin, Q. Z. and Berger, A.: Individual contribution of insolation and CO2to the interglacial climates of the past 800,000 years, Clim.
Dynam., 38, 709–724, 2012.