Drink. Water Eng. Sci., 4, 1–8, 2011 www.drink-water-eng-sci.net/4/1/2011/ doi:10.5194/dwes-4-1-2011
©Author(s) 2011. CC Attribution 3.0 License.
Geo- and Space
Sciences
Open
Access
Advances
in
Science & Research
Open Access ProceedingsDrinking Water
Engineering and Science Open Access
Open
Access
Earth System
Science
Data
Drinking Water
Engineering and Science
Discussions
O
pen
Acc
es
s
Open
Access
Earth System
Science
Data
D
iscussions
Metals releases and disinfection byproduct formation in
domestic wells following shock chlorination
M. Walker and J. Newman
University of Nevada, Department of Natural Resources and Environmental Science, MS 370/FA 132, 1664 N. Virginia Street, Reno, NV 89557, USA
Received: 11 May 2010 – Published in Drink. Water Eng. Sci. Discuss.: 4 June 2010 Revised: 23 November 2010 – Accepted: 28 November 2010 – Published: 4 January 2011
Abstract. Shock chlorination is used for rapid disinfection to control pathogens and nuisance bacteria in
do-mestic wells. A typical shock chlorination procedure involves adding sodium hypochlorite in liquid bleach solutions to achieve concentrations of free chlorine of up to 200 mg L−1in the standing water of a well. The
change in pH and oxidation potential may bring trace metals from aquifer materials into solution and chlorine may react with dissolved organic carbon to form disinfection byproducts. We carried out experiments with four wells to observe and determine the persistence of increased concentrations of metals and disinfection byproducts. Water samples from shock chlorinated wells were analyzed for Pb, Cu, As, radionuclides and disinfection byproducts (haloacetic acids and trihalomethanes), immediately prior to treatment, after sufficient treatment time with chlorine had elapsed, and at intervals determined by the number of casing volumes purged, for up to four times the well casing volume.
Elevated concentrations of lead and copper dissipated in proportion to free chlorine (measured semi-quantitatively) during the purging process. Trihalomethanes and haloacetic acids were formed in wells during disinfection. In one of two wells tested, disinfection byproducts dissipated in proportion to free chlorine during purging. However, one well retained disinfection byproducts and free chlorine after 4 WV had been purged. Although metals returned to background concentrations in this well, disinfection byproducts remained ele-vated, though below the MCL. This may have been due to well construction characteristics and interactions with aquifer materials. Simple chlorine test strips may be a useful method for indicating when purging is adequate to remove metals and disinfection by-products mobilized and formed by shock chlorination.
1 Introduction
Shock chlorination is an in-situ method for disinfecting wa-ter wells contaminated with pathogens and nuisance bacte-ria. Much guidance is available for treatment of domestic wells (e.g. Schnieders, 2005; Driscoll, 1986) and http://www. unce.unr.edu/publications/files/nr/2006/FS0668.pdf, last ac-cessed April 2010). The guidelines recommend CT val-ues (free chlorine concentrations×resting time of the so-lution) that are very high relative to those used for pub-lic water supply treatment, which is appropriate given that treatments occur sporadically, usually in response to per-ceived problems with water or the health of those who con-sume water from a well. The procedure typically involves
Correspondence to: M. Walker
(mwalker@cabnr.unr.edu)
adding sodium hypochlorite solution directly to a well fol-lowed by mixing and a resting period of 12–24 h. The chlorinated water must be purged prior to resuming use. Recommendations for the amount of purging vary signifi-cantly, with Schnieders (2005) recommending 10–20 well volumes, and University of Ohio Cooperative Extension and others recommending purging until water no longer smells of chlorine (http://ohioline.osu.edu/aex-fact/0318.html, http:
to purging prior to treatment, to replace water stored in the casing with water from the surrounding saturated formations. Well diameter, case material, depth to water from the land surface and well depth were recorded at each site. The screened interval length was obtained from well logs available on the Nevada Division of Water Resources (http://water.nv.gov/, last accessed April 2010).
US fish and wildlife Well dia Case DTW from WD from Screened interval Static vol. service site designation material land surface land surface length
(year finished) cm (in) m (ft) m (ft) m (ft) l (gal)
182 (1975) 15 (6) PVC 3.4 (11.1) 9.4 (31.0) 4.6–7.9 (15.0–26.0) 110.6 (29.2) 167N (1996) 15 (6) Steel 2.4 (8.0) 9.0 (29.6) 8.2–9.1 (27.0–30.0) 120.0 (31.7) 51 (1994) 15 (6) Steel 1.7 (5.5) 20.4 (67) 18.9–20.4(62.0–67.0) 171.2 (45.2) 142 (1993) 15 (6) Steel 3.6 (11.8) 8.1 (26.7) 6.4–7.9 (21.0–26.0) 84.8 (22.4)
US fish and wildlife pH Temperature Conductivity Oxidation-reduction Bleach added Treatment
service site designation potential duration
◦
C mS cm−1 mV l (gal) (h)
182 8.50 14.9 0.740 not taken 1.0 (0.3) 20 h
167N 7.14 16.9 0.345 114 1.1 (0.3) 15 h
51 7.27 15.57 0.454 270 1.5 (0.4) 24 h
142 7.67 16.86 2.093 −123 0.7 (0.2) 17 h
The odor threshold for chlorine gas in air is approximately 0.3 mg L−1 (Amoore and Hautala, 1983). The relationship
between the amount of chlorine degassing from a solution and the amount that can be detected by smell varies, depend-ing upon the individual sensitivity and the degassdepend-ing rate, which is in turn related to mixing dynamics within a water body, contact time, temperature of water, and changes in tem-perature and barometric pressure. Because of these several factors, guidelines about purging based on scent are subjec-tive and the consistency and efficacy of application may vary considerably between people.
Aqueous chlorine (as hypochlorite ion and hypochlorous acid) cleaves carbon-carbon bonds in organic molecules to form two classes disinfection byproducts (DBPs), haloacetic acids (HAAs) and trihalomethanes (THMs) (Westerhoff et al., 2004). HAAs and THMs include carcinogenic or-ganic compounds and have Maximum Contaminant Lev-els (MCLs) of 0.060 mg L−1 for HAA5 (the sum of
con-centrations of monochloroacetic acid, dichloroacetic acid, trichloroacetic acid, monobromoacetic acid and dibro-moacetic acid) and 0.080 mg L−1 for total THM, as
spec-ified in the Stage 1 Disinfectants/Disinfection Byprod-ucts Rule (40 CFR, Parts 9, 141 and 142) (http://water. epa.gov/drink/contaminants/index.cfm#Byproducts, last ac-cessed August 2010). Trihalomethanes include chloroform, bromodichloromethane, dibromochloromethane, and bromo-form.
Shock chlorination may also increase the concentrations of lead and other trace elements following treatment (Seiler, 2006) and change arsenic concentrations (Gotkowitz et al.,
2008). Both lead and arsenic have toxicological effects, with an Action Level and Maximum Contaminant Level of
<15µg L−1and 10µg L−1, respectively.
This paper describes the changes in concentration of Pb, Cu, As, U, gross-α and gross-β radiation, HAA5, THM, and free chlorine (semi-quantitatively measured) from shock chlorination of four domestic water wells. The study also sought to demonstrate that simple test strips for semi-quantitative measurement of concentration of free chlorine (used for pool and spa maintenance) indicates when purg-ing has returned concentrations of metals and disinfection byproducts to pre-treatment background levels. Test strips may be a better indicator than the scent of water that post-treatment purging is complete, because they provide a semi-quantitative indicator of total chlorine concentrations.
2 Methods and materials
2.1 Study site
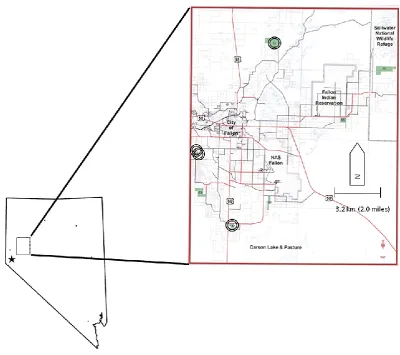
Figure 1.Location of study area, with locations of test wells indicated in circles.
construction and had well logs available through the Nevada State Engineer’s office. Second, because they were no longer in service we did not run the risk of exposing people to metals or disinfection by-products released or created by shock chlorination. Well logs for each indicated that the exteriors of screened intervals on the casing were packed with gravel for wells 182 (PVC-cased), 167N (steel-cased) and 142 (steel-cased). The construction log for well 51 (steel-cased) contained incomplete information about how the screened interval was finished. The wells pumped wa-ter from a stratum of Quawa-ternary valley-fill sands in the in-land terminus of the Carson River from depths of less than 15 m (50 ft) from the land surface. Infiltration from irriga-tion and the Carson River has been identified as the main source of recharge (Glancy, 1986). Although the groundwa-ter system in the Lahontan Valley is nominally comprised of three geochemically separated systems (shallow (<15.2 m (50 ft) from the land surface); intermediate (15.2–<152.4 m (50–<152.4 ft); deep (≥152.4 m (≥500 ft)), aquifer material composition, yields and chemistry vary highly throughout the region (Glancy, 1986). Water in the aquifer has high but spatially variable concentrations of arsenic (as much
as 2100 mg L−1 (Walker et al., 2005)) and uranium (as
much as 290 mg L−1 (http://www.atsdr.cdc.gov/HAC/PHA/
fallonleukemia2/fln p1.html, last accessed April 2010) from contact with sediments and from long-term evapoconcentra-tion (Welch and Lico, 1998). Depth to water (DTW) in the four wells ranged from 1.7 to 5.5 m (5.5 to 18.0 ft) with total well depth ranging from 8.0 to 9.5 m (26.7 to 31.0 ft) (Ta-ble 1).
2.2 Well treatment and purging
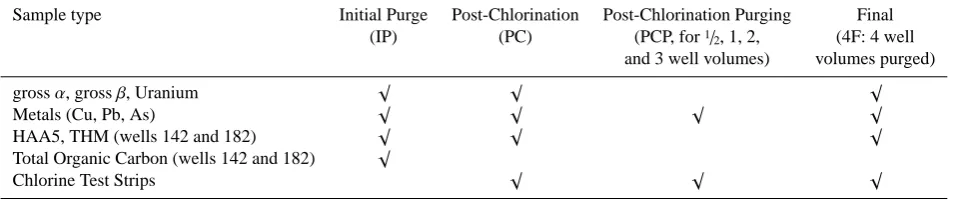
A1/2horsepower portable jet pump fitted with a 7.6 m (25 ft)
(IP) (PC) (PCP, for1/
2, 1, 2, (4F: 4 well
and 3 well volumes) volumes purged)
grossα, grossβ, Uranium √ √ √
Metals (Cu, Pb, As) √ √ √ √
HAA5, THM (wells 142 and 182) √ √ √
Total Organic Carbon (wells 142 and 182) √
Chlorine Test Strips √ √ √
a YSI model 556MPS (Yellow Springs Instruments, Yel-low Springs OH), for real-time measurement of tempera-ture (T (◦C)), pH, oxidation-reduction potential (ORP (mV)),
and conductivity (C (mS cm−1)). The multi-probe was
cali-brated immediately prior to each stage of field trials, using pH 4.00, 7.00 and 10.00 standards (Fisher Scientific Buff er-Pac, Cat# SB105), a conductivity standard (1000 mS cm−1 at 25◦C (Yellow Springs Instrument Co. Cat #3167) and an oxidation-reduction potential reference solution (Equipco Inc., part #3682500).
Prior to conducting trials, each well was purged of stag-nant water at a rate of 9.5 to 18.9 liters per minute (2.5 to 5.0 gpm) until temperature, pH, ORP, and conductivity read-ings stabilized (<5% variation in continuous readings), then purged an additional four times the well’s standing volume of water. The standing well volume (WV) was estimated as WV=H×A, with H as the measured height of the water
col-umn in the well after the level stabilized following pump-ing and A as the cross sectional area of the interior of the well casing. Using this as a basis for purging following treat-ment differs from the dynamic well volume, which represents the steady state water level achieved during pumping. This differs from the static water level due to drawdown during pumping. The water levels used as a reference in this paper are standing well volumes (WV), which do not reflect the influence of pumping. Pre-chlorination (designated as IP) water samples for all wells were collected for As, Cu, Pb, U, gross-αand gross-βradiation, total organic carbon, and for a steel-cased well and a PVC-cased well, water samples were collected for HAA5 and THM analyses. Table 1 presents IP conditions in each well.
2.3 Shock chlorination
Following initial purging, each well was chlorinated to an es-timated 200 mg L−1as total Cl using household bleach
(un-scented, regular strength Clorox®labeled as containing 6% sodium hypochlorite (NaOCl), which is 64.6% Cl by mass) by adding 8.9 ml (0.3 fl oz) bleach per liter (0.26 gallons) of well volume (Table 1). Pump discharge was circulated back into the well casing for 15 min to disperse bleach into
solu-Table 3.Methods used for sample analysis. “EPA” refers to a stan-dard analytic method published by the US Environmental Protec-tion Agency (available at http://www.epa.gov/sam/index.htm, last accessed April 2010), used by the Nevada State Health Laboratory. “SM” refers to standard method 5310 C (Persulfate-ultraviolet or Heated Persulfate Oxidation Method), published in Standard Meth-ods for the Examination of Examination of Water and Wastewater (Clesceri et al., 1998). Total Organic Carbon samples were analyzed using a Shimadzu Spectrophotometer at the University of Nevada.
Analyte Method Analytic detection limits (mg L−1)
Copper EPA 200.7 0.020, 0.050 Arsenic, Lead, Uranium EPA 200.8 0.003, 0.002, 0.002 grossα, grossβ EPA 900.0 3 pCi L−1
THM EPA 524.2 0.005
HAA5 SM 6251B 0.001
TOC SM 5310C 1.0*
* The analytic detection limit is based on linear regression analysis of the calibra-tion curve, conducted with three replicates each of 4 standards, ranging from 0.274– 20.270 mg L−1.
tion. Wells were re-capped for a resting period of at least twelve hours.
2.4 Sampling
Immediately prior to and during purging temperature, pH, oxidation-reduction potential, and conductivity were mea-sured. Immediately prior to purging post-chlorination (PC) samples from all wells were tested for As, Cu, Pb, U, and gross-αand gross-βradiation. Samples from two wells (142 and 182) were tested for disinfection byproducts (HAA5 and THM). All metals and disinfection by-products samples were collected using a PTFE dip bailer.
Post chlorination purging samples were collected for As, Cu, and Pb at intervals defined by the volume of water purged from each well, including1/2, 1, 2, 3, and 4×WV (designated
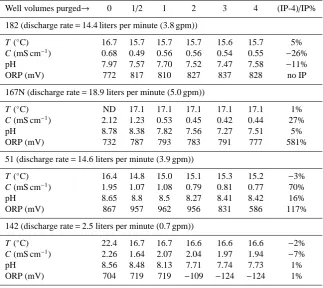
Table 4.Physical and chemical characteristics of water in test wells observed during post-chlorination purging (T : temperature, C: conduc-tivity, ORP: oxidation-reduction potential, ND: not measured). Final column displays the percentage difference between values at IP (prior to chlorination) and post-chlorination, with 4 well volumes purged.
Well volumes purged→ 0 1/2 1 2 3 4 (IP-4)/IP%
182 (discharge rate=14.4 liters per minute (3.8 gpm))
T (◦C) 16.7 15.7 15.7 15.7 15.6 15.7 5%
C (mS cm−1) 0.68 0.49 0.56 0.56 0.54 0.55 −26%
pH 7.97 7.57 7.70 7.52 7.47 7.58 −11%
ORP (mV) 772 817 810 827 837 828 no IP
167N (discharge rate=18.9 liters per minute (5.0 gpm))
T (◦
C) ND 17.1 17.1 17.1 17.1 17.1 1%
C (mS cm−1) 2.12 1.23 0.53 0.45 0.42 0.44 27%
pH 8.78 8.38 7.82 7.56 7.27 7.51 5%
ORP (mV) 732 787 793 783 791 777 581%
51 (discharge rate=14.6 liters per minute (3.9 gpm))
T (◦
C) 16.4 14.8 15.0 15.1 15.3 15.2 −3%
C (mS cm−1) 1.95 1.07 1.08 0.79 0.81 0.77 70%
pH 8.65 8.8 8.5 8.27 8.41 8.42 16%
ORP (mV) 867 957 962 956 831 586 117%
142 (discharge rate=2.5 liters per minute (0.7 gpm))
T (◦
C) 22.4 16.7 16.7 16.6 16.6 16.6 −2%
C (mS cm−1) 2.26 1.64 2.07 2.04 1.97 1.94 −7%
pH 8.56 8.48 8.13 7.71 7.74 7.73 1%
ORP (mV) 704 719 719 −109 −124 −124 1%
All samples were unfiltered. Samples were collected, im-mediately placed in a portable cooler with blue ice to avoid exposure to sunlight and changes in temperature and sub-mitted within 24 h to the Nevada State Health Laboratory (University of Nevada School of Medicine, Reno, NV – a certified drinking water analysis laboratory) for analysis (Ta-ble 3). Samples for arsenic, copper, lead and uranium were collected in 500 ml high density polyethylene bottles with 5.0 ml of 15% nitric acid as a preservative in containers pro-vided by the laboratory. After sample collection, the final concentration of nitric acid was 0.15% nitric acid.
2.5 Chlorine test strips
Free chlorine was measured semi-quantitatively with test strips for swimming pool and spa maintenance (Arch Chem-icals, Inc. – HTH line). The test strips indicated free chlo-rine concentrations in ranges rather than absolute numbers, similar to pH indicator strips. In order to determine the range, a user dips the strip in a solution and compares col-ors appearing in segregated rectangles with a key. The ranges reported include undetectable (indicated as 0 on the test strip), >0–1 mg L−1, >1–2 mg L−1, >2–3 mg L−1, >3–
5 mg L−1,>5–10 mg L−1and>10 mg L−1. We tested the
ac-curacy of the strips using dilutions of sodium hypochlorite solution and determined that they were adequate for distin-guishing between the classes noted above (data not shown).
3 Results and discussion
3.1 Conductivity, pH, oxidation-reduction potential and temperature
Post-chlorination conductivity measurements were elevated from initial values, and returned to near initial values follow-ing purgfollow-ing 4 WV (Table 4). pH rose in wells 167N and 51 and decreased slightly in wells 182 and 42. Increases in pH conform to observations that concentrations of chlorine of 200 mg L−1can be expected to increase pH by up to two units
to results of internal laboratory quality control assessments and chemical quality of water samples.
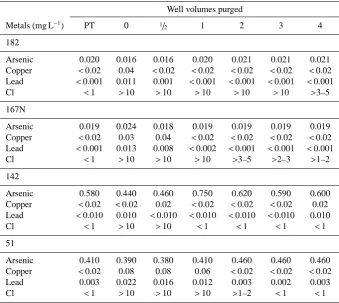
Well volumes purged
Metals (mg L−1) PT 0 1/
2 1 2 3 4
182
Arsenic 0.020 0.016 0.016 0.020 0.021 0.021 0.021 Copper <0.02 0.04 <0.02 <0.02 <0.02 <0.02 <0.02 Lead <0.001 0.011 0.001 <0.001 <0.001 <0.001 <0.001 Cl <1 >10 >10 >10 >10 >10 >3–5
167N
Arsenic 0.019 0.024 0.018 0.019 0.019 0.019 0.019 Copper <0.02 0.03 0.04 <0.02 <0.02 <0.02 <0.02 Lead <0.001 0.013 0.008 <0.002 <0.001 <0.001 <0.001 Cl <1 >10 >10 >10 >3–5 >2–3 >1–2
142
Arsenic 0.580 0.440 0.460 0.750 0.620 0.590 0.600 Copper <0.02 <0.02 0.02 <0.02 <0.02 <0.02 0.02 Lead <0.010 0.010 <0.010 <0.010 <0.010 <0.010 0.010 Cl <1 >10 >10 <1 <1 <1 <1
51
Arsenic 0.410 0.390 0.380 0.410 0.460 0.460 0.460 Copper <0.02 0.08 0.08 0.06 <0.02 <0.02 <0.02
Lead 0.003 0.022 0.016 0.012 0.003 0.002 0.003
Cl <1 >10 >10 >10 >1–2 <1 <1
levels, though temperature and pH were<16% of starting values. This suggests that the oxidizing effects of chlorina-tion led to short-term changes in the immediate vicinity of the well screen or that were stagnant zones within the well, which would have required more purging to eliminate.
3.2 Chlorine concentration
Decreases of free chlorine concentration were hypothesized to be an indicator of purging of mobilized trace metals and disinfection byproducts. The concentration of free chlorine decreased in wells 51, 167N and 142 to>1–2 ppm free chlo-rine after 4 WV were pumped (Table 5). Site 182 required that 5 WV be purged before free chlorine decreased to>3– 5 ppm (data not shown).
3.3 Mobilization of trace metals
Concentrations of lead and copper in well water increased following shock chlorination, which corresponds with results reported by Seiler (2006). Lead concentrations increased up to thirteen-fold and copper concentrations increased up
to four-fold following treatment. Concentrations of both de-creased to initial levels within 2 WV of purging. The return to background levels corresponded with the decline in free chlorine to>3–5 mg L−1(Table 5).
All wells contained arsenic in concentrations that ex-ceeded the MCL (0.010 mg L−1) prior to treatment. The
de-cline in arsenic concentration in the chlorine solution prior to purging was similar to results reported by Gotkowitz et al. (2008) and would be expected with the observed changes pH and oxidation-reduction potential. However, the decline was followed by an increase in arsenic above background levels during pumping. After 4 WV, water from one well returned to initial arsenic concentrations, while the others re-mained 3–12% higher than initial concentrations.
3.4 Uranium and radionuclides
Table 6. Uranium, gross-αand gross-β results for three stages of treatment: IP (prior to chlorination), PC (post chlorination but prior to purging) and 4 WV (after purging 4 well vol-umes). The Maximum Contaminant Levels for uranium,
gross-α and gross-β are 30µg L−1, 15 pCi L−1 and 4 mrem yr−1,
re-spectively, (see http://www.epa.gov/safewater/radionuclides/pdfs/ qrg radionuclides.pdf, last accessed April 2010).
182 IP PC 4 WV
Uranium,µg L−1 32 22 35
gross-α, pCi L−1 18 21 24
gross-β, pCi L−1 18 14 20
167N
Uranium,µg L−1 13 13 13
gross-α, pCi L−1 8 15 12
gross-β, pCi L−1 19 17 19
142
Uranium,µg L−1 560 620 580
gross-α, pCi L−1 120 92 127
gross-β, pCi L−1 173 168 158
51
Uranium,µg L−1 4 29 9
gross-α, pCi L−1 13 43 16
gross-β, pCi L−1 6 8 5
WV. Gross-αconcentrations changed from the IP to PC sam-pling steps, increasing in wells 51 and 167N, decreasing in well 142 and remaining approximately the same in well 182. Gross-βconcentrations remained approximately the same in all wells at each sampling stage, with concentrations appear-ing to decrease slightly between the IP and 4 WV samplappear-ings. The maximum change in gross-βconcentrations was approx-imately−9% in well 142.
3.5 Total organic carbon and disinfection byproducts
Total organic carbon (TOC) concentrations in wells 182 and 142, collected prior to treatment, are shown in Table 7. Wa-ter from wells obtained afWa-ter treatment, but prior to purg-ing contained concentrations of THM up to ten times the MCL (Table 7). Following purging of 4 WV, concentra-tions in well 142 decreased to below the detection limit, indicating that the increase in concentration was temporary and could be remediated by purging 4 WV after treatment. Well 182 retained disinfection byproducts and free chlorine, with the concentration of free chlorine (indicated by test strips)>10 mg L−1after purging 4 WV. Testing for free chlo-rine at the fifth well volume purged indicated a concentration of>3–5 ppm.
Table 7.Total Organic Carbon (TOC) concentrations following ini-tial purging of test wells (IP), and HAA5 and THM concentrations following IP, post chlorination (PC) and after 4 well volumes (WV) had been purged.
Site TOC HAA5 THM
(IP) (IP,PC,4 WV) (IP,PC,4 WV) mg L−1 µg L−1 µg L−1
182 3.9 <1.0, 101.0, 128.0 <0.5, 43.7, 70.1 142 15.1 <1.0, 394.0,<1.0 <0.5, 747.0,<0.5
4 Conclusions
This study confirmed temporary mobilization and changes in concentration of trace metals from shock chlorination treat-ment, as previously reported by Seiler (2006) and Gotkowitz et al. (2008). It also demonstrated that disinfection byprod-ucts can be formed and can persist beyond 3 WV of purg-ing. The concentration of disinfection byproducts exceeded drinking water MCLs in the two wells tested. In one well, concentrations decreased to below the detection limits for HAA5 and THM with purging. In the other, concentrations of disinfection byproducts remained elevated, with final con-centrations of THM and HAA5 at highest levels after purging 4 WV. Metals, though mobilized by shock chlorination, de-creased to near pre-treatment background levels after 4 WV were purged in all wells.
observed. In order to maintain a steady discharge rate from well 142, the pumping rate was <20% of the purging rate used in well 182, even though lift distances from the wa-ter table to the surface were slightly less for well 142 than well 182. This suggests that the saturated formations in the screened intervals pumped for well 142 were less permeable than those in well 182, which in turn suggests that aquifer materials may have been composed of fine-textured soils in-cluding silts and clays. In the absence of significant advec-tive mixing, formation of disinfection byproducts beyond the immediate well volume would be limited to chemical disper-sion. In well 182, however, it is likely that a larger volume of aquifer material was exposed to chlorine. This hypothesis is, in part, supported by the persistent indication of oxidizing conditions in water withdrawn after purging 4 WV. A prior study in the region (Fram et al., 2005) demonstrated that free chlorine released significant amounts of carbon from aquifer materials. They concluded that carbon was likely released from clay minerals in proportion to the amount of available chlorine in solution. This suggests that aquifer material and interactions with high concentrations of available chlorine were a potential source of precursors to HAA5 and THM formation.
The mixing procedure used to disperse chlorine through-out the entire well volume was unlikely to have created a gradient that would advect chlorine into aquifer materials, but chemical diffusion through the well screen may have taken place during the resting phase. Given the differences in screened intervals, this may have led to accumulation of DBPS’s in aquifer materials in contact with the screened in-terval of well 182, which could have required more thor-ough purging to remove than those in contact with the shorter screened interval in well 142. Although purging appeared to be adequate based on number of well volumes removed and stability of temperature and pH, test strips indicated the presence of free chlorine. Consequently, the chemical re-actions that led to metals releases and DBP formation may have been due to chemical diffusion during the resting time following introduction of bleach and likely due to reactions with aquifer materials and gravel packing in the immediate vicinity of the screened interval of the well casing.
Publications about shock chlorination recommend purging varying numbers of standing well volumes post treatment, before returning a well to service. Guidance also is based on detecting the scent of chlorine in water. Without meter-ing equipment most domestic well owners have no accurate means of determining when pumping is sufficient to remove a specific number of well volumes. Also, determining the sufficiency of purging by scent is subjective and may not be consistent, especially with respect to avoiding exposure to metals and disinfection byproducts. The use of chlorine test strips shows promise as a simple and accurate means of
de-ficials and informal educators (including county-based edu-cators of Cooperative Extension), who provide advice about proper procedures for shock chlorination, especially when well owners cannot measure discharge rates and discharge volumes.
Acknowledgements. This material is based upon work sup-ported by the National Institute of Food and Agriculture, US Department of Agriculture, under Agreement No. 2009-51130-06048. Any opinions, findings, conclusions, or recommendations expressed in this publication are those of the author(s) and do not necessarily reflect the view of the US Department of Agriculture.
Edited by: J. Verberk
References
Amoore, J. E. and Hautala, E.: Odor as an ald to chemical safety: Odor thresholds compared with threshold limit values and volatilities for 214 industrial chemicals in air and water dilution, J. Appl. Toxicol., 3(6), 272–290, 1983.
Clesceri, L., Greenberg, A., and Eaton, A. (Eds): Standard Meth-ods for Examination of Water and Wastewater. American Public Health Association, Washington, D.C., 1325 pp., 1999. Driscoll, F. G.: Groundwater and Wells, 2nd ed., Johnson Division,
St. Paul, MN, 1108 pp., 1986.
Fram, M. S., Maurer, D. K., and Lico, M. S.: Potential for formation of disinfection by-products from storage of chlorinated surface water in the basalt aquifer near Fallon, Nevada, US Geological Survey, Carson City, NV, 23 pp., 2005.
Glancy, P.: Geohydrology of the Basalt and Unconsolidated Sedi-mentary Aquifers in the Fallon Area, Churchill County, Nevada, Institution, Alexandria, Va., US Geological Survey Water Supply Paper 2263, 60 pp., 1986.
Gotkowitz, M., Ellickson, K., Clary, A., Bowman, G., Standridge, J., and Sonzogni, W.: Effect of well disinfection on arsenic in ground water, Ground Water Monit. R., 28(2), 60–67, 2008. Schnieders, J. H.: Use of Chlorine to Disinfect Water Wells, Water
Well Journal, 7, 52–53, 2005.
Seiler, R. L.: Mobilization of lead and other trace elements follow-ing shock chlorination of wells, Sci. Total Environ., 367(2–3), 757–768, 2006.
Walker, M. J., Benson, M., and Shaw, W. D.: Significance of private water supply wells as a route of exposure to aqueous arsenic, J. Water Health, 3(3), 305–312, 2005.
Welch, A. H. and Lico, M. S.: Factors controlling As and U in shallow ground water, southern Carson Desert, Nevada, Appl. Geochem., 13(4), 521–539, 1998.