https://doi.org/10.5194/tc-11-2491-2017
© Author(s) 2017. This work is distributed under the Creative Commons Attribution 3.0 License.
Dark ice dynamics of the south-west Greenland Ice Sheet
Andrew J. Tedstone1, Jonathan L. Bamber1, Joseph M. Cook2, Christopher J. Williamson1, Xavier Fettweis3, Andrew J. Hodson2,4, and Martyn Tranter1
1Bristol Glaciology Centre, School of Geographical Sciences, University of Bristol, Bristol, UK 2Department of Geography, University of Sheffield, Winter Street, Sheffield, UK
3Laboratory of Climatology, Department of Geography, University of Liège, Liège, Belgium 4Arctic Geology, University Centre in Svalbard, Longyearbyen, Norway
Correspondence to:Andrew J. Tedstone (a.j.tedstone@bristol.ac.uk)
Received: 28 April 2017 – Discussion started: 19 May 2017
Revised: 17 August 2017 – Accepted: 23 September 2017 – Published: 3 November 2017
Abstract. Runoff from the Greenland Ice Sheet (GrIS) has increased in recent years due largely to changes in atmo-spheric circulation and atmoatmo-spheric warming. Albedo reduc-tions resulting from these changes have amplified surface melting. Some of the largest declines in GrIS albedo have occurred in the ablation zone of the south-west sector and are associated with the development of “dark” ice surfaces. Field observations at local scales reveal that a variety of light-absorbing impurities (LAIs) can be present on the surface, ranging from inorganic particulates to cryoconite materials and ice algae. Meanwhile, satellite observations show that the areal extent of dark ice has varied significantly between recent successive melt seasons. However, the processes that drive such large interannual variability in dark ice extent re-main essentially unconstrained. At present we are therefore unable to project how the albedo of bare ice sectors of the GrIS will evolve in the future, causing uncertainty in the pro-jected sea level contribution from the GrIS over the coming decades.
Here we use MODIS satellite imagery to examine dark ice dynamics on the south-west GrIS each year from 2000 to 2016. We quantify dark ice in terms of its annual ex-tent, duration, intensity and timing of first appearance. Not only does dark ice extent vary significantly between years but so too does its duration (from 0 to >80 % of June–July– August, JJA), intensity and the timing of its first appearance. Comparison of dark ice dynamics with potential meteoro-logical drivers from the regional climate model MAR re-veals that the JJA sensible heat flux, the number of positive
minimum-air-temperature days and the timing of bare ice ap-pearance are significant interannual synoptic controls.
We use these findings to identify the surface processes which are most likely to explain recent dark ice dynamics. We suggest that whilst the spatial distribution of dark ice is best explained by outcropping of particulates from ablating ice, these particulates alone do not drive dark ice dynam-ics. Instead, they may enable the growth of pigmented ice algal assemblages which cause visible surface darkening, but only when the climatological prerequisites of liquid meltwa-ter presence and sufficient photosynthetically active radiation fluxes are met. Further field studies are required to fully con-strain the processes by which ice algae growth proceeds and the apparent dependency of algae growth on melt-out partic-ulates.
1 Introduction
increased surface runoff, with only 32 % of the total loss in this period attributable to solid ice discharge (Enderlin et al., 2014). It is therefore essential to understand the processes which control surface melting in order to be able to quantify the contribution of the GrIS to sea level rise over the coming century.
Surface albedo plays an important role in modulating the surface melt caused by incoming shortwave radiation. A lower albedo permits more absorption of shortwave radia-tion, which in turn leads to enhanced ice melting, and so albedo is the dominant factor governing surface melt vari-ability in the ablation area (Box et al., 2012). The effective albedo of the GrIS is controlled by external factors includ-ing solar zenith angle, atmospheric composition and cloud cover, as well as the inherent optical properties of the sur-face. For both snow-covered and bare ice surfaces these in-herent optical properties are modified by (a) ice grain meta-morphism, (b) meltwater on the surface or in interstitial pores and (c) light-absorbing impurities (LAIs), including biologi-cal and mineralogibiologi-cal substances (Gardner and Sharp, 2010), each of which generally lead to reduced albedo.
Declines in GrIS bare ice albedo have an immediate impact on runoff from the GrIS and hence the surface mass balance (SMB). Decreases in the SMB since 1991 are predominantly due to enhanced runoff from low-lying (<2000 m a.s.l.) bare ice parts of the ice sheet (van den Broeke et al., 2016). Since around 2000 the surface albedo of several sectors of the GrIS has often been significantly lower each summer than was observed during the 1990s (He et al., 2013). GrIS summer albedo showed a negative trend during 2000–2012, with the largest decreases observed in western Greenland (Stroeve et al., 2013). Some of the de-cline in albedo can be attributed to increases in bare ice ex-tent. The GrIS-wide bare ice ablation zone extent increased by 7158 km2 per year on average from 2000 to 2014, al-though with substantial interannual variability of between 5 % (89 975 km2) and 16 % (279 075 km2) of the ice sheet surface (Shimada et al., 2016).
In the ablation zone of the south-west GrIS, albedo low-ered by as much as 18 % from 2000 to 2011 (Box et al., 2012). The south-west has seen the greatest increase in bare ice extent, by on average 5.8 % per year, with a mean ex-tent of 56 603 km2during 2000–2014 (Shimada et al., 2016). However, increasing bare ice extent alone is insufficient to explain the declining albedo. Remotely sensed optical im-agery for this sector shows a band of relatively darker ice within the bare ice ablation zone which recurred annually in the same location over the period 2001–2007, beginning 20–30 km inland from the ice sheet margin and extending up to∼50 km wide, which has been postulated to be caused by LAIs (Wientjes and Oerlemans, 2010). LAIs on snow/ice surfaces reduce reflectance the most in the visible part of the solar spectrum (Warren, 1984; Painter et al., 2001; Bøggild et al., 2010), and this effect enabled Shimada et al. (2016) to quantify the interannual extent of dark ice – both
GrIS-wide and for the south-west sector – by applying an empir-ically derived reflectance threshold to the 620–670 nm band of MODIS satellite imagery acquired in July each year. They found that dark ice extent varied substantially between years, both GrIS-wide (from 3575 to 26 975 km2) and in the south-west (from 575 to 15 025 km2).
There are a range of possible causes of dark ice on the GrIS. One consists of outcropping particulates in ablating ice. Wientjes et al. (2012) acquired shallow ice cores from the south-west sector in which they found dust that they dated to the Late Holocene. They therefore suggested that the dust was deposited in the accumulation zone and flowed with the ice down to the ablation zone, causing darkening of the sur-face as the ancient ice melts. However, they were not able to measure absolute concentrations of dust in their ice cores to compare to non-dark regions of the ice sheet. Meanwhile, Shimada et al. (2016) found a statistically significant corre-lation (r=0.69) between July dark ice extent and air tem-perature (and hence surface melt rates, potentially deposit-ing more particles from the ancient ice on the surface) in the south-west sector, but did not identify the responsible com-ponent of the surface energy balance.
relative to dispersed cryoconite by sequestering the low-albedo cryoconite from the ice surface at depth, resulting in a hemispheric albedo increase that will be further enhanced by specular reflection when covered by a reflective layer of meltwater (Bøggild et al., 2010). Occasional stripping events associated with high ambient air temperatures have been ob-served in the McMurdo Dry Valleys, Antarctica, resulting in cryoconite hole melt-out, the redistribution of cryoconite ag-gregates over the ice surface and subsequent formation of new holes (MacDonell and Fitzsimons, 2008). Similarly, in the south-west ablation zone of the GrIS, Chandler et al. (2015) observed that in warm, cloudy conditions some cry-oconite holes melted out and release debris, but with little corresponding reduction in cryoconite hole coverage and set against an overall increasing trend in cryoconite hole cover-age as the 2015 melt season progressed.
Distinct from the assemblages of microorganisms associ-ated with cryoconite holes, ice algae can bloom in the upper few centimetres of bare melting ice. Abundant assemblages of ice algal communities have been reported on bare ice in both west (Uetake et al., 2010; Yallop et al., 2012) and east Greenland (Lutz et al., 2014). Ice algae produce specialist pigments which absorb UV and visible wavelengths, pro-tecting the photosynthetic apparatus from excessive radiation (Dieser et al., 2010; Yallop et al., 2012; Remias et al., 2012). These pigments may be a significant source of darkening to GrIS surface ice (Yallop et al., 2012; Lutz et al., 2014).
The influence of cryoconite, cryoconite hole processes and/or ice algal assemblages on the substantial interannual variability apparent in dark ice extent of the GrIS is currently unknown. Whilst Shimada et al. (2016) proposed cryoconite sequestration into cryoconite holes as the mechanism under-lying the negative correlation (r= −0.52) between ice-sheet-wide July dark ice extent and shortwave radiation, this re-lationship did not hold when examined for the south-west sector alone. Additionally, although opposed pyranometer measurements (300–1100 nm) demonstrated that local algal bloom patches on snow had lower albedo at these wave-lengths than snow without visible blooms (Lutz et al., 2014), broadband albedo measurements relevant for energy balance have not been isolated from grain evolution, meltwater pond-ing and abiotic impurities.
In this study we aim to identify the “top-down” controls of significant variability in dark ice extent between succes-sive melt seasons in the south-west of the GrIS. We first characterise the interannual dark ice dynamics of the south-west GrIS using visible satellite imagery to quantify dark ice in terms of its extent, duration, intensity and the timing of its appearance each year. We then examine the extent to which interannual variations in dark ice dynamics are con-trolled by prevailing seasonal meteorological and climato-logical conditions and how they could drive surface dark-ening through three potential processes: (1) inorganic par-ticulate deposition or redistribution, (2) cryoconite hole pro-cesses and (3) growth of ice algal assemblages.
2 Data and methods
2.1 Identification of dark ice
We used the MOD09GA Daily Land Surface Reflectance Collection 6 product, which is derived from data acquired by the MODIS sensor on board NASA’s Terra satellite, to map bare and dark ice. Collection 6 products include im-proved calibration algorithms to correct for MODIS sensor degradation on Terra (Lyapustin et al., 2014) which was re-sponsible for an apparent decline in GrIS dry snow albedo over the last decade or so (Polashenski et al., 2015; Casey et al., 2017). We used the clouds discrimination layer of the MOD10A1 Daily Snow Albedo Collection 6 product to iden-tify and discard pixels covered by cloud. Our full time series encompasses daily observations between May and Septem-ber from 2000 to 2016 but here we concentrate mainly on observations made during JJA.
Both MODIS Level-2 products are delivered on a sinu-soidal grid at 500 m nominal resolution which exhibits sig-nificant distortion over the GrIS and prevents simple compar-ison with meteorological fields output by the regional climate model Modèle Atmosphérique Régional (MAR) (Sect. 2.5). We therefore first re-projected the MODIS data to the po-lar stereographic projection using nearest-neighbour resam-pling, yielding a spatial resolution of ∼600 m×600 m. When undertaking comparisons with MAR outputs, cloud-free MODIS data were binned into 7.5 km2pixels to match MAR’s resolution.
We detected bare ice and then dark ice within bare ice areas by applying thresholds to reflectance val-ues (R) (Shimada et al., 2016). For bare ice we adopted
R841−876 nm<0.6. To detect dark bare ice we used
R620−670 nm<0.45. Pilot field spectra acquired in July 2016 indicate that this slightly higher threshold – compared with
R620−670 nm<0.4 used by Shimada et al. (2016) – captures dark ice more accurately (Appendix A). However, we note that we do not know precisely what this dark ice threshold represents physically. The red band (620–670 nm) sits within the visible wavelengths and is therefore affected mostly by LAIs rather than grain evolution or water ponding, which mostly affect the near-infrared wavelengths (700–1100 nm). However, we caveat that other mechanisms can also reduce the reflectance across the entire solar spectrum, including in the red waveband. These include reduction in volume-scattering due to wind or water “polishing” the ice surface, infilling of interstitial air spaces with meltwater and “trap-ping” by roughness features such as crevasses. Nevertheless, by combining these thresholds we are able to distinguish at first order between clean and dark (LAI-laden) ice surfaces. 2.2 Selection of common area
Figure 1.DDon the south-west GrIS each summer from 2000 to 2016, expressed as a percentage of the total daily cloud-free observations made during June–July–August (JJA). Each year is labelled withDE. In each year, pixels that are dark for fewer than 5 days are not shown. Bottom-right panel: common area of dark ice used for interannual comparisons.
calculating interannual statistics. We chose this approach over defining different areas of dark ice for each year because then the spatial sampling area would have changed dramati-cally from one year to the next, whereas we are mainly inter-ested in the primary drivers of interannual variability in dark ice dynamics.
To define the common area, first, in each year, we iden-tified the pixels which were flagged as dark on at least 10 days during June–July–August (JJA). Then, we retained only those pixels which went dark in at least 4 years of our time series. Finally, we removed all dark pixels which oc-curred within ∼1 km of the ice sheet margin as defined by the Greenland Ice Mapping Project (GIMP; Howat et al., 2014) in order to remove errant pixels consisting of mixed land and ice cover which remained after applying the GIMP ice area mask. The common area is depicted in Fig. 1 and covers∼10 400 km2.
2.3 Metrics of dark ice dynamics
We derived four metrics to characterise spatiotemporal vari-ations in dark ice. First, annual extent (DE) corresponds to the extent (in km2) covered by the pixels within the common area which were dark for at least 5 days in each year. Second, annual duration (DD) was defined at each pixel in the
com-mon area as the percentage of daily cloud-free observations made in each JJA period which were classified as dark and is thereby normalised for cloud cover. Third, intensity (DI) was defined as the mean daily reflectance over 620–670 nm of all cloud-free pixels in the common area and annual in-tensity (DI) as the JJA mean ofDI. A lower value ofDI or
DItherefore means that dark ice intensity was greater.DIis on a continuous scale and so is independent of the stringent dark ice presence threshold defined in Sect. 2.1. Only days in which at least 50 % of the common area was cloud-free were included in the calculation, and only the cloud-free pix-els within the common area were used. Fourth, normalised darkness (DN) was expressed as
DN=
DD
DI·100
(1) and therefore provides a combined indicator of both the du-ration and intensity of dark ice presence.
2.4 Timing of bare ice and dark ice appearance At each pixel and for each year we identified the date on which (a) bare ice emerged from underneath the melted snowpack (tB) and (b) dark ice appeared (tD), if at all. In both cases we used a 7-day rolling window on the relevant time series of reflectance at each pixel. Each year, we iden-tified the first rolling window at each pixel that contained at least 3 days of bare or dark ice (not necessarily consecutive) and 0 days of non-bare or non-dark ice, which therefore per-mitted up to 4 days of cloud cover in the window. We then selected the first day of bare or dark ice appearance from within the chosen window. This windowing strategy enabled us to minimise the likelihood of false-positive identification of bare and dark ice appearance dates which would have oc-curred if only looking at daily observations in isolation and also allowed us to ameliorate for cloud cover.
Finally, we calculated the median and interquartile range (25th and 75th percentile) of the day of year of bare ice ap-pearance for the common area each year (teB) from the pixel-level data.
2.5 Meteorological and climatological data
We performed simulations of meteorological conditions over the GrIS using version 3.6.2 of MAR, a regional climate model (Fettweis et al., 2017). The model was run on an equal-area 7.5 km×7.5 km resolution grid for the whole of Greenland and was forced at its boundaries every 6 h by ECMWF ERA-Interim reanalysis data (Dee et al., 2011). For comparison with dark ice dynamics we downsampled the MODIS-defined common area to MAR’s resolution. We calculated mean shortwave-down (SW↓0), longwave-down (LW↓0) and sensible heat flux (SHF0) anomalies (posi-tive when into the ice sheet surface) in the common area for each JJA relative to 1981–2000. We also calculated the mean daily snow depth in the common area from April to August each year, total snowfall (from teB to 31 August) and total rainfall (during JJA).
We characterised near-surface air temperatures in two ways. First, we defined the mean air temperature during JJA asT. Second, we defined the number of days in each JJA pe-riod in which the common area’s dailyminimumnear-surface air temperature exceeded 0◦C asP
(T >0).
As introduced previously, cryoconite holes form and tend to be sustained under SW↓dominant conditions. Conversely, this suggests that they are likely to melt out, depositing cry-oconite onto the ice surface, if the surface energy balance shifts to LW↓ or SHF dominant conditions. We therefore characterised the conditions which could cause melt-out of cryoconite holes as the “melt-out flux” (MOF) using
SWnet=SW↓ ·(1−α), (2)
LWnet=LW↓ −LW↑, (3)
MOF=SHF+LWnet−SWnet, (4)
whereαwas the daily mean MOD10A1 albedo over the com-mon area (only on days with <50 % cloud cover) and LW↑
was 315.6 W m−2for melting ice surfaces as defined by Cuf-fey and Paterson (2010). SHF is positive when into the ice sheet surface. MOF corresponds to the mean JJA MOF.
We used the monthly Greenland Blocking Index (GBI) (Hanna et al., 2016) to consider the role of the synoptic atmospheric circulation in dark ice dynamics. The GBI is the mean 500 hPa geopotential height for the 60–80◦N, 20– 80◦W region and therefore provides a measure of the extent of high-pressure blocking over Greenland. We calculated the mean GBI for each JJA period.
3 Results
3.1 Characteristics of dark ice dynamics
Shimada et al. (2016) identified a general trend of increas-ingDEover time but also saw thatDEon the south-west GrIS varied dramatically between years. We found similar charac-teristics in our expanded time series (Fig. 1).DEranged from almost no dark ice identified (2000, 2001 and 2015) to wide, contiguous areas of dark ice stretching from 65.5 to 69◦N (2007, 2010, 2011, 2012, 2014 and 2016).
There was substantial interannual variability inDDduring JJA. Generally, whenDE was high,DD was also high, es-pecially in 2010, 2012 and 2016. Moreover, the extension of our time series relative to Shimada et al. (2016) which only examined July to encompass June through August revealed relatively largeDEandDDin 2005, 2007, 2008, 2009, 2011 and 2014.
Examination ofDI(Fig. 2) shows that most dark ice pres-ence was concentrated into the months of July and August. In some years (2010 and 2016) more significant darkening of the ice sheet surface was observed as early as mid-June. In years when substantial darkening occurred there was a time lag betweenetBand the first widespread occurrence of dark ice of∼10–15 days, although in some cases (e.g. 2010) this may be attributable to the large interquartile range in date of bare ice appearance (Fig. 2).DItended to increase over the season. Variability inDI at daily to weekly timescales was minimal compared to the magnitude of variability over in-terannual timescales. Dark ice usually persisted until the on-set of anti-cyclonic, cloudy conditions (Fig. 2, days shaded grey) and snowfall during late August and September, which buried the bare ice surface under snowpack for the winter period.
Figure 2.DIin the common area during May to September from 2000 to 2016. Only days on which at least 50 % of the common area is cloud-free are shown. Black squares denote days on which the average dark ice intensity,DI, of the cloud-free common area was<0.45. Black triangles denote the date of snow clearing,teB. Horizontal black bars denote the interquartile range of the day of year of bare ice
appearance.
Moreover, DI values at end of one melt season were gen-erally significantly different to those in the period afterteBthe following year (Fig. 2).
We used tD to calculate cumulative DE in the common area through the summer (Fig. 3, red lines). In several years
DEwas very small (2000, 2001, 2003, 2015). In years when medium DEoccurred (e.g. 2005, 2006, 2008, 2009, 2013), dark ice appeared step-wise through July and into August. This step-wise appearance also occurred in the highDEyears of 2007 and 2010. In contrast, the widespread expansion of
DEin 2011, 2012, 2014 and 2016 occurred rapidly over just a few days in July. In particular, we found 28 large, single-day expansions in dark ice extent in our time series (defined as
>520 km2, equivalent to∼5 % of the common area). These large changes cannot be explained by gaps in our time se-ries owing to cloud cover: the median number of preceding days when cloud cover was>50 % was 0, and the mean com-mon area covered by cloud in the preceding 7 days was 34 %. There tended to be minimal further dark ice expansion in Au-gust. As shown byDE(Fig. 1) andDI(Fig. 2), the extent and intensity of dark ice tended to persist for the rest of the sum-mer season (Figs. 1 and 2).
3.2 Controls on dark ice presence
In years whenDEwas higher thenDD(Fig. 1) andtD(Fig. 3) tended to be spatially invariant across the common area. This suggests that the driver(s) of dark ice presence is (are) syn-optic, governing dark ice dynamics over the whole common area. We therefore used meteorological and climatological variables representative of the common area to examine their potential impact upon dark ice dynamics.
3.2.1 Snow
Snow can control dark ice dynamics in at least two major ways: (a) the thickness of the snowpack from the preceding winter will, in combination with air temperatures, controlteB; and (b) snowfall that occurs during the melt season will at least temporarily obscure the bare ice surface.
Figure 3 shows the mean snowpack depth and tB from April through to August each year. In the years of longestDD and greatestDI(2007, 2010, 2012, 2016) bare ice appeared by roughly mid-June according to both MODIS and MAR, compared to other years when bare ice did not appear until early to mid-July.
0 0.5 1 1.5 0 0.5 1 1.5 0 0.5 1 1.5
Apr May Jun Jul Aug Oct
0 0.5 1 1.5
2000 2001 2002 2003
0 4 8 12
2004
2005 2006 2007 2008
0 4 8 12
2009
2010 2011 2012 2013
0 4 8 12 2014 2015 0 4 8 2016
Mean snow depth (m)
C um ul at iv e sa rk ic e ex te nt ( x 10 k m ) 3 2
Month of year Apr May Jun Jul Aug Oct
Apr May Jun Jul Aug Oct Apr May Jun Jul Aug Oct Apr May Jun Jul Aug Oct
Figure 3.Average snow depth (blue) and cumulative dark ice extent,DE(red), in common area during April to August each from 2000 to 2016. Vertical bars (grey) denoteteB; horizontal bars (grey) denote the interquartile range of the day of year of bare ice appearance.
-20 -10 0 10 20 W m 2 (a)
LW 0 SW 0 SHF0
0 40 80 120 160 m m W .E . yr 1 Snow Rain
2000 2002 2004 2006 2008 2010 2012 2014 2016 Year -400 -300 -200 -100 0 M O F (W m 2) (c) 0 0.4 0.8 1.2 1.6 DN (b)
Figure 4.JJA meteorology andDNfrom 2000 to 2016.(a)SW↓0, LW↓0and SHF0(see Sect. 2.5).(b)Normalised darkness (DN), total snow inputs fromteBuntil 31 August and rain inputs during JJA.
(c)MOF,±3σ(see Sect. 2.5).
3.2.2 Atmospheric energy fluxes
SW↓0was consistently positive from 2007 onwards but con-tinued to show substantial interannual variability (Fig. 4a).
There was no statistically significant relationship between JJA SW↓0 andDN. Unlike SW↓0, from 2000 to 2007 LW↓ anomalies were consistently positive and then after 2007 the sign became more variable, with both positive and negative anomalies occurring (Fig. 4a). Like SW↓0there was no sta-tistically significant relationship withDN.
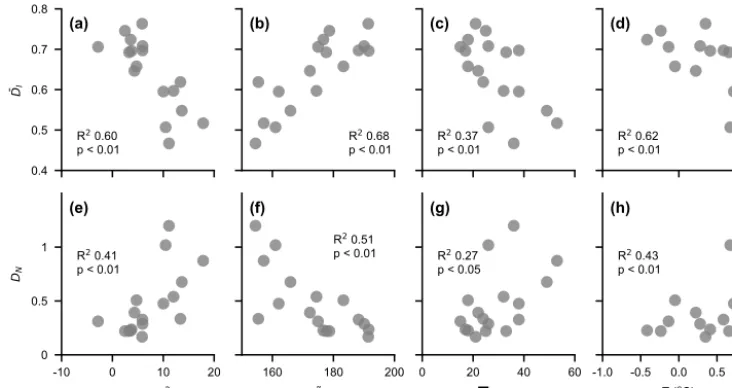
SHF0was consistently positive throughout the time series. There was a significant positive correlation between SHF0 andDN(R2=0.41,p <0.01; Fig. 5e).
We examined the likelihood for cryoconite hole melt-out (causing redistribution of cryoconite materials onto the ice sheet surface) using MOF (Fig. 4c), which is suggestive of the energy balance conditions that are needed to melt cry-oconite holes out of their weathering crust. Positive MOF signifies that longwave and sensible heat fluxes dominate the energy balance, which could cause spatially “even” surface melting as opposed to spatially heterogeneous melting per-mitted by stronger absorption of SW↓where cryoconite ma-terial is present. MOF was negative in all years, and all days within 3σ of the mean were also negative, which suggests that the positive MOF conditions required for the widespread melt-out of cryoconite holes were seldom (if ever) met.
As liquid meltwater constitutes a prerequisite for algal growth, we assessed the likelihood of continuous liquid melt-water presence on the ice surface over each 24 h cycle us-ing P(T >0). We found a positive correlation between P
(T >0) and DI (R2=0.37, p <0.05; Fig. 5c) and to a lesser extent withDN(R2=0.27,p <0.05; Fig. 5g). Greater P
0.4 0.5 0.6 0.7 0.8
DI
(a)
R2 0.60 p < 0.01
(b)
R2 0.68 p < 0.01
(c)
R2 0.37 p < 0.01
(d)
R2 0.62 p < 0.01
-10 0 10 20
SHF0 (W m2) 0
0.5 1
DN
(e)
R2 0.41 p < 0.01
160 180 200
tB
(f)
R2 0.51 p < 0.01
0 20 40 60
T > 0
(g)
R2 0.27 p < 0.05
-1.0 -0.5 0.0 0.5 1.0 T (oC)
(h)
R2 0.43 p < 0.01
Figure 5.Relationships between meteorological indicators and dark ice intensity,DI(upper panels), and normalised darkness,DN(lower panels).
p <0.01). Moreover, we found that single days of large dark ice area expansion were associated with a median of 3 days of continuous (24 h) melting, compared to 0 days for the rest of the time series. These sudden increases in dark ice extent were associated with higher absolute sensible heat fluxes, with a mean of 57±24 W m−2, equivalent to 96 % more sensible heat than the SHF mean in the period from the start of dark ice expansion until a maximumDE of 90 % of the common area. Over daily timescales, higher SHF was associ-ated with warmer near-surface air temperatures (R2=0.54,
p <0.01) but more strongly with higher near-surface wind speeds (R2=0.67,p <0.01). Days on which the minimum air temperature was greater than 0◦C had mean wind speeds of 6.5±1.8 m s−1±1σcompared to 4.9±1.3 m s−1±1σon days when the minimum air temperature was 0◦C or less.
Last, we examined whether dark ice dynamics have any relationship with the GBI. We found a positive correlation between the JJA GBI andDN(R2=0.46,p <0.05). 3.2.3 Rainfall
Rainfall can occur in the ablation zone of the GrIS dur-ing summer. Limited observations from elsewhere in the cryosphere indicate that whilst the direct melt impact of rain-fall upon melt rates is generally limited, rain can affect melt indirectly by increasing the liquid water content of the ice surface, reducing its albedo (Hock, 2005). Total JJA rain-fall in this sector ranged from 30 mm w.e. to as much as 140 mm w.e. (Fig. 4b). However, there was no statistically significant relationship between JJA total rainfall andDN.
Eyewitnesses on the ice sheet surface have observed that the generally widespread porous surface weathering crust, typically on the order of 20–30 cm deep, can be stripped down towards the underlying high-density bare ice
dur-ing rainfall events (potentially dispersdur-ing cryoconite mate-rial from cryoconite holes). However, they also observed that it tends to thicken again within days due primarily to renewed subsurface melt by incoming shortwave radiation (Cook et al., 2017a). We therefore also examined the impact of each JJA rainfall event uponDI. We selected all rainfall (and snowfall) events of>1 mm w.e. day−1across our com-mon area in our time series. Then, we calculated the change inDIusing the closest observations immediately before and after the rainfall event. We found no systematic change inDI caused by rainfall events: in some casesDIincreased while in other cases it decreased. This was the case whether or not mixed rainfall and snowfall events were excluded from anal-ysis, although we note that MAR may not adequately dis-criminate between rainfall and snowfall over ice surfaces.
4 Discussion
At outlined in Sect. 1, a number of processes have been pro-posed to explain the dark ice dynamics on the south-west of the GrIS. Our characterisation of dark ice in terms ofDE,
DD,DIandtD, when combined with analysis of the prevail-ing meteorological conditions estimated by MAR, allows us to consider the extent to which each proposed process fits with our observations of dark ice dynamics.
4.1 Variability driven by inorganic particulate deposition or redistribution
that there is no relationship between albedo reductions and the number of fires occurring over North America and Eura-sia or with modelled atmospheric aerosol fluxes (Tedesco et al., 2016). Measurements of black carbon in snow on the present-day surface of the GrIS (as opposed to in ice cores) have been made in the north-west (Aoki et al., 2014; Po-lashenski et al., 2015) and high in the accumulation zone (Hegg et al., 2010; Doherty et al., 2013). However, at only a few ppb, these measurements of black carbon are insuffi-cient to explain the substantial reduction in reflectance in the south-west (see Warren, 2013).
Atmospheric deposition events would presumably have to occur in only years of highDNin order to explain the spa-tiotemporal patterns in dark ice that we observed. In dark years, DI increased gradually over the summer and so we postulate that deposition would need to occur over at least several days afteretB. More problematic is that maximumDE is relatively invariant and begins ca. 20 km inland rather than at the margin, whereas atmospheric deposition would pre-sumably occur over a more dispersed area.
The well-defined geometry of the dark-ice area between years lends support to the hypothesis that the dark-ice area is caused by surface deposition of particulates previously trapped in the ablating ice (Wientjes and Oerlemans, 2010; Wientjes et al., 2012). Warmer air temperatures in darker years (R2=0.43,p <0.01; Fig. 5d and h) support the idea that more material is deposited on the surface from melted ancient ice in these years, contributing to darkening and pos-sibly acting as a positive feedback mechanism. However, our dynamics observations suggest that particulates from ancient ice are not the primary source of darkening. First, there is more variability inDEandDD than we would expect if to-tal summer ablation alone determined darkening by control-ling the corresponding quantity of particulates being released from ancient ice.DEwas negligible in several years (Fig. 1), yet melting in this area occurred in all years (e.g. van den Broeke et al., 2011; van As et al., 2016). Second, particulates are unlikely to be dispersed homogeneously through the ice column and so the concentration of particulates emerging at the surface will change non-linearly with respect to the ice-melt rate. This could explain whyDEis negligible in several high-melt years. However, the wavy patterns of surface dark-ening at decametre scales observed by Wientjes and Oerle-mans (2010) are indicative of dispersion of previously well-defined particulate horizons by vertical shear due to ice flow, which suggests that particulates from ancient ice were de-posited in each summer of our time series. Third and most critically, in order to explain non-dark years such as 2013 and 2015, the particulate material responsible for substan-tial darkening during 2010–2012 and 2014 would have to be evacuated from the ice-sheet surface at the end of summer to explain both dark ice that summer and the lack of dark ice the year after. More broadly, we did not find a year-on-year increase inDIthat we would expect if particulates from an-cient ice were accumulating at the ice-sheet surface (Fig. 2).
We also found that in years of highDN the onset of high
DIwas delayed by∼10–15 days afterteB(Fig. 2). This may be attributable to remaining snow patches or superimposed ice formation, although the prevalence of the latter process on the GrIS remains poorly understood (Larose et al., 2013; Chandler et al., 2015). Nevertheless, if particulate materials were still present on the surface from the previous melt sea-son we would expect highDIalmost immediately after bare ice appearance.
Overall, our observations provide little support to the hy-pothesis that particulate deposition causes surface darkening. We are unable to identify a mechanism by which the ice-surface mass flux of particulate material could change over timescales commensurate with dark ice dynamics.
4.2 Variability driven by cryoconite hole processes Shimada et al. (2016) hypothesised that the opposing pro-cesses of cryoconite hole formation (under SW↓ dominant conditions) versus melt-out (under LW↓ dominant condi-tions) could explain interannual variability inDE.
There are several noteworthy limitations to investigating cryoconite hole processes from satellite observations. First, cryoconite hole processes occur over decimetre scales and so we may not be able to capture their variability using 500 m MODIS imagery. Second, the reflectance of ice surfaces with cryoconite holes varies strongly as a function of viewing angle (Bøggild et al., 2010), and so observations made by MODIS – which has a “push-broom” scanning assembly – will vary depending on how near to nadir the angular instan-taneous field of view (IFOV) is. This is likely to impact the broadband albedo value from MOD10A1 used to calculate SWnetas part of MOF in a way that is not currently known.
We also looked at intra-annual variations in dark ice dy-namics when considering the potential for variability to be driven by cryoconite hole processes. Field observations of cryoconite hole morphology show that cryoconite holes form within the ice weathering crust over timescales of a few days (Cook et al., 2016). However, in dark years,tDwas relatively synchronous across the common area. Importantly,DIthen increased as the season continued, suggesting that episodic cryoconite hole flushing and reformation is unlikely. This is supported by field observations made in the south-west abla-tion zone of the GrIS by Chandler et al. (2015), who found that cryoconite hole coverage increased over the course of the 2015 melt season despite transiently warm, cloudy con-ditions experienced during July that caused some holes to melt out and release their debris. Moreover, the lack of en-ergy available for cryoconite hole melt-out over seasonal timescales (Fig. 4c) suggests that variability in the areal ex-tent of cryoconite holes forced by changes in the dominant component(s) of the surface energy balance cannot explain dark ice dynamics. Our only evidence in support of cry-oconite hole processes is that large single-day increases in dark ice extent were associated with higher absolute SHF, which could cause transient hole-flushing events during the melt season. However, the rest of our evidence strongly sug-gests that cryoconite hole processes are not responsible for interannual dark ice dynamics.
4.3 Variability driven by ice algal assemblages
Last, we examined evidence for the role of ice algal assem-blages as the principal driver of dark ice dynamics. In ad-dition to typical light-harvesting pigments characteristic of green microalgae (Remias et al., 2009), ice algae produce a unique UV-VIS absorbing purpurogallin pigment that pre-sumably affords protection from the significant radiation ex-perienced in GrIS surface habitats (Remias et al., 2012). Given this pigmentation, ice algal blooms are known to im-pact visible reflectance at local (metre) scales (Yallop et al., 2012; Lutz et al., 2014). Knowledge of the regulation of temporal and spatial patterns in ice algal biomass (and thus pigmentation) in surface habitats is limited (Yallop et al., 2012; Chandler et al., 2015), but the fundamental prerequi-sites for algal life are known, including liquid water, nutrient resources and photosynthetically active radiation (PAR; 400– 700 nm).
The significant positive relationship identified between P
(T >0) and DI (R2=0.37, p <0.01; Fig. 5g) supports the role of ice algae in ice sheet darkening, as do the single-day increases in DE of >5 % of the common area, which were generally preceded by several days of continuous pos-itive air temperatures; both of these observations are indica-tive of liquid meltwater presence. Ice algae require liquid water in order to grow, and ice surfaces are reservoirs of potentially viable propagules that can become active when they encounter sufficient liquid water of appropriate
chem-istry (Webster-Brown et al., 2015). Minimum air tempera-tures above 0◦C required for the presence of liquid water
will facilitate growth of ice algae. As blooming progresses, the relationship between liquid water availability and algal proliferation may be strengthened by the establishment of a positive feedback loop via albedo reduction. For example, blooms of snow algae have been shown to result in surface albedo reduction, increased heat retention at the snow sur-face and thus enhanced melting and liquid water availability for continued algal growth (Lutz et al., 2016). Climatically, enhanced liquid meltwater presence in dark years – espe-cially continuing through the night when SW↓tends to zero – is also partially attributable to increased SHF0, with a posi-tive correlation observed between SHF0andDN(R2=0.41,
p <0.01; Fig. 5e) in our study. Thus a combination of greater P
(T >0) and higher SHF0 may regulate interannual liquid water availability in ways critical to ice algae growth, thereby governing whether or not dark ice appears.
e
tBhas a first-order impact on whether the common area is dark in any given year, with later appearance associated with lowerDE (Fig. 5b and f). etBwill significantly impact PAR availability at the ice surface. If bare ice appears in early to mid-June, it will receive PAR over several complete diurnal cycles, unlike in years when bare ice does not appear until July. Although ice algae likely experience excessive irradi-ance over the ablation season, as evidenced by their produc-tion of “sunscreen” pigments (Remias et al., 2012), a min-imum threshold of PAR (or photo-period duration) may be required to allow bloom initiation, which would be favoured by earlierteB. Alternatively, variability inteBmay impact al-gal blooms (and thus darkening) via the timing of nutrient inputs to surface ice or due to the formation of superimposed ice. With delayed snow line retreat, percolating snow melt in spring/early summer may release snowpack nutrients to sur-face ice (Larose et al., 2013) before PAR is available to al-low algal utilisation, stalling bloom formation. It may also re-sult in sustained presence of superimposed ice (Larose et al., 2013; Chandler et al., 2015), preventing PAR penetration to the previous year’s ice algal cells and initiation of growth. However, we found no significant relationship between SW0 (which corresponds approximately to PAR) andDN, so the role of seasonal PAR fluxes in algal growth remains unclear. More broadly, field studies are required in order to identify precisely the transition from snow to a bare ice surface could impact ice algal assemblages.
If prerequisites for the initiation of an algal bloom are achieved then an increase in algal biomass is likely, with a concomitant increase inDI. This is consistent with increases inDI after the first appearance of dark ice, as opposed to “flickering” between less- and more-dark states. Increases in
Previously, Chandler et al. (2015) recorded an increase in “dirty ice” extent within our common area over an ablation period, though they did not assess algal cell numbers within dirty ice. Whilst algal concentrations likely increase until a limiting factor becomes apparent, analogous to algal blooms in aquatic systems (Teeling et al., 2016), progressive coloni-sation of clean ice at the sub-MODIS pixel scale would still result in continued increases inDIat the regional scale. In-deed, we do not know how much of a given MODIS pixel must be covered in a light algal bloom before the pixel re-flectance dips below the dark ice threshold or how much of an impact processes such as overnight refreezing of the ice surface will have on diurnal variability in reflectance. Such considerations are particularly important when considering variations in area-wideDIabove and/or within a few percent of the field-derived reflectance threshold of 0.45, as physical changes in the weathering crust (e.g. liquid water content) will also force variations inDIindependently of variability in algal growth. Lastly, given the confounding impacts of cloud cover on MODIS observations, assessing the relative contri-bution of increases in the extent (DE) versus concentration of algae (DI) on regional variability in dark ice dynamics is not possible. We suggest, however, that intra-annual pat-terns in DI over ablation periods are more consistent with the progression of ice algal blooms than with dynamics in other darkening agents previously discussed.
We interpret our observations as support for the role of ice algae in controlling interannual dynamics in darkening, but note that there is currently not sufficient evidence to formally test this assertion. In particular, one major aspect of dark ice variability which ice algae cannot explain is the well-defined maximal spatial extent of dark ice, both in the south-west and GrIS-wide. However, if algal growth were the only fac-tor causing interannual variability in dark ice presence, we would expect to see dark ice present wherever the logical prerequisites for algal growth are met. These climato-logical prerequisites can be found elsewhere, most notably in the 20 km wide zone from the ice-sheet margin to the start of the common area examined in this study. This suggests that algal growth controlled by climatology alone cannot fully ex-plain dark ice dynamics in the south-west sector of the GrIS. In light of our findings, we hypothesise that interannual vari-ability in dark ice presence – both in the south-west sector and GrIS-wide – requires (1) particulates outcropping from ancient ablating ice and (2) blooming of ice algal assem-blages. Specifically, we suggest that the outcropping particu-lates defines the spatial extent of dark ice. Algal blooms are likely to exert a control on dark ice intensity in areas where outcropping particulates are present but only when the cli-matological prerequisites for growth are also met. For our hypothesis to be correct, outcropping particulates must en-able ice algae growth of sufficient magnitude to cause appre-ciable darkening, for instance as a source of nutrients, but they do not need to be present in high enough concentra-tions to cause darkening by themselves, nor do they need to
have mineralogical characteristics that appear dark in the vis-ible spectrum. In addition our observations imply that over interannual timescales in the south-west GrIS, outcropping dust is always present due either to continuous delivery or to long residence times. This is unlikely to hold over longer timescales if darkening by algal assemblages is contingent on the delivery of outcropping dust from ancient ablating ice.
5 Conclusions
We detected hitherto overlooked dynamics of the dark ice zone of south-west of the GrIS using remotely sensed im-agery. Our results show that GrIS dark ice dynamics must be examined across the full duration of the melt season in or-der to unor-derstand the processes most likely to be reducing the albedo of bare ice surfaces. We found that in years when the south-west sector of the GrIS darkens, this usually occurs within several days and then remains widespread for the rest of the melt season, indicating that the darkening occurs in re-sponse to a common synoptic forcing. The seasons of longest dark ice duration (DD) tend to be associated with earlier re-treat of the winter snowpack. Once the ice goes dark, the dark ice intensity (DI) tends to increase gradually through the melt season. Daily variations inDIare fairly small.
In our analysis, the JJA sensible heat flux anomaly and the date of bare ice appearance represent the most impor-tant climatic controls on dark ice extent (DE),DD andDI, with higher sensible heat fluxes (associated with higher wind speeds) and earlier bare ice appearance favouring more dark ice. Higher JJA air temperatures and a greater number of days during JJA on which continuous surface melting oc-curs are also associated with darker years. There is a pos-itive correlation between DN and the JJA GBI (R2=0.46,
p <0.05), which indicates that the climatic conditions which drive darker years can be attributed at least partly to the sum-mer presence of high-pressure blocking systems over the ice sheet.
Our observations suggest that neither deposition of partic-ulates nor cryoconite hole processes can independently ex-plain interannual variability in dark ice presence. Our obser-vations tentatively support the proposal that algal blooming is the primary cause of albedo reductions in dark years, likely driven by earlier winter snowpack retreat and positive sen-sible heat flux anomalies. However, climatological controls on algal growth alone cannot explain the spatial distribution of interannual dark ice presence. We therefore suggest that interannual variability in dark ice in the south-west sector of the GrIS is enabled first by the deposition of particulates from melting ancient ice. These particulates play an as-yet unknown role in facilitating the growth of ice algal assem-blages, which is also controlled by physical and/or climatic prerequisites that remain to be identified conclusively.
all LAIs outcropping from ancient ice needs to be quanti-fied. Second, the spatial distribution and hence ice-darkening potential of ice algae needs to be examined not just at plot scales but also at scales of hundreds of metres and more. Third, if algal cells are found to be abundant and to be the primary driver of dark ice, then the physical/climatic and nu-trient controls on the growth of ice algae need to be estab-lished. Last, all these findings should be assimilated into a model of ice surface albedo that can be embedded within a regional climate model in order to project the impact of dark ice upon runoff from the GrIS during the 21st century.
Code availability. The Modèle Atmosphérique Régional (MAR) is
an open-source regional climate model. Source code of MARv3.6.2 is available at ftp://ftp.climato.be/fettweis/MARv3.6/.src/.
Data availability. Monthly outputs from MAR are available at
Appendix A: Choice of spectral thresholds
We validated the spectral thresholds used in this study through comparison to hemispherical-conical reflectance factor (HCRF) measurements made in the field on 19 July 2016 in the vicinity of S6 (67◦4028.600N, 49◦21032.400W). We made HCRF measurements for three qualitatively identified surface types: (1) white ice, (2) light algal bloom (characterised by a light brown colouration to the ice surface) and (3) heavy algal bloom (characterised by a dark brown colouration to the ice surface). Subsequent microscopic examination of surface samples confirmed the presence of algal cells, along with a very low concentration of mostly clear quartz particles. The HCRF measurements were made following the HCRF measurement protocol de-scribed by Cook et al. (2017b). Briefly, an ASD Field Spec Pro spectral radiometer with an 8◦fore optic was positioned
30 cm above the sample surface with a nadir-viewing angle. This device measures reflected radiance in the wavelength range 350–2500 nm and therefore senses reflected radiance over about 95 % of the solar spectrum. The sample surface was qualitatively homogenous in a buffer zone of at least 30 cm around the viewing footprint of the sensor. We calcu-lated the mean of at least 20 sample replicates, all of which were made within 1 min without changing the sensor posi-tion. All measurements were acquired within a 2 h sampling window around solar noon, thereby minimising error due to changing solar zenith. The sky was cloud-free through-out the measurement window. Naturally illuminated nadir-view HCRF is reported for consistency with the reported MOD09GA data.
The field spectra (Fig. A1) show that the bare ice thresh-old used by Shimada et al. (2016) adequately captures white-ice surfaces. Their threshold ofR620−670 nm<0.4 to define dark ice is conservative and prevents positive identification of light algal blooms. In this study we used a threshold of
R620−670 nm<0.45, which is set to just below our field ob-servations of light algal bloom reflectance in order to reduce the likelihood of false positives.
400 500 600 700 800 900 1000
Wavelength (nm) 0.0
0.2 0.4 0.6 0.8 1.0
Reflectance
White ice
Light algae
Heavy algae
Author contributions. AT, JB and MT designed the study. AT pro-cessed the MODIS data, carried out most of the analysis and in-terpretation and wrote most of the manuscript. JC and CW con-tributed to the interpretation and wrote parts of the manuscript. XF developed MAR and provided the model outputs. AH undertook additional energy balance analysis and contributed to the interpre-tation. All authors discussed the findings and commented on the manuscript.
Competing interests. The authors declare that they have no conflict
of interest.
Acknowledgements. This study was supported by the UK Natural
Environment Research Council Consortium Grant “Black and Bloom” (NE/M021025). In addition to the authors, the Black and Bloom team comprises A. Anesio, L. Benning, E. Hanna, S. Hofer, A. Holland, T. Irvine-Fynn, S. Lutz, J. McCutcheon, J. McQuaid, M. Nicholes, E. Sypianska, C. Williamson and M. Yallop.
Edited by: Marco Tedesco
Reviewed by: two anonymous referees
References
Aoki, T., Matoba, S., Yamaguchi, S., Tanikawa, T., Niwano, M., Kuchiki, K., Adachi, K., Uetake, J., Motoyama, H., and Hori, M.: Light-absorbing snow impurity concentrations measured on Northwest Greenland ice sheet in 2011 and 2012, Bull. Glaciol. Res., 32, 21–31, https://doi.org/10.5331/bgr.32.21, 2014. Bøggild, C. E., Brandt, R. E., Brown, K. J., and
War-ren, S. G.: The ablation zone in northeast Greenland: ice types, albedos and impurities, J. Glaciol., 56, 101–113, https://doi.org/10.3189/002214310791190776, 2010.
Box, J. E., Fettweis, X., Stroeve, J. C., Tedesco, M., Hall, D. K., and Steffen, K.: Greenland ice sheet albedo feedback: thermo-dynamics and atmospheric drivers, The Cryosphere, 6, 821–839, https://doi.org/10.5194/tc-6-821-2012, 2012.
Cameron, K., Stibal, M., Zarsky, J., Gozdereliler, E., Schostag, M., and Jacobsen, C.: Supraglacial bacterial community structures vary across the Greenland ice sheet, FEMS Microbiol. Ecol., 92, fiv164, https://doi.org/10.1093/femsec/fiv164, 2016.
Casey, K. A., Polashenski, C. M., Chen, J., and Tedesco, M.: Impact of MODIS sensor calibration updates on Greenland Ice Sheet surface reflectance and albedo trends, The Cryosphere, 11, 1781– 1795, https://doi.org/10.5194/tc-11-1781-2017, 2017.
Chandler, D. M., Alcock, J. D., Wadham, J. L., Mackie, S. L., and Telling, J.: Seasonal changes of ice surface characteristics and productivity in the ablation zone of the Greenland Ice Sheet, The Cryosphere, 9, 487–504, https://doi.org/10.5194/tc-9-487-2015, 2015.
Cook, J., Hodson, A., Anesio, A., Hanna, E., Yallop, M., Stibal, M., Telling, J., and Huybrechts, P.: An improved estimate of microbially mediated carbon fluxes from the Greenland ice sheet, J. Glaciol., 58, 1098–1108, https://doi.org/10.3189/2012JoG12J001, 2012.
Cook, J., Edwards, A., Bulling, M., Mur, L., Cook, S., Gokul, J., Cameron, K., Sweet, M., and Irvine-Fynn, T.: Metabolome-mediated biocryomorphic evolution promotes carbon fixa-tion in Greenlandic cryoconite holes: Biocryomorphic evolu-tion of cryoconite holes, Environ. Microbiol., 18, 4674–4686, https://doi.org/10.1111/1462-2920.13349, 2016.
Cook, J., Hodson, A., Taggart, A., and Mernild, S.: A predictive model for the spectral ‘bioalbedo’ of snow, J. Geophys. Res.-Ea. Surf., 122, 434–454, https://doi.org/10.1002/2016JF003932, 2017a.
Cook, J., Hodson, A., Gardner, A., Flanner, M., Tedstone, A., Williamson, C., Irvine-Fynn, T., Nilsson, J., Bryant, R., and Tranter, M.: Quantifying bioalbedo: A new physically-based model and critique of empirical methods for characterizing bi-ological influence on ice and snow albedo, The Cryosphere Dis-cuss., https://doi.org/10.5194/tc-2017-73, in review, 2017b. Cuffey, K. and Paterson, W. S. B.: The Physics of Glaciers, 3rd Edn.,
Butterworth-Heinemann, 2010.
Dee, D. P., Uppala, S. M., Simmons, A. J., Berrisford, P., Poli, P., Kobayashi, S., Andrae, U., Balmaseda, M. A., Balsamo, G., Bauer, P., Bechtold, P., Beljaars, A. C. M., van de Berg, L., Bid-lot, J., Bormann, N., Delsol, C., Dragani, R., Fuentes, M., Geer, A. J., Haimberger, L., Healy, S. B., Hersbach, H., Hólm, E. V., Isaksen, L., Kållberg, P., Köhler, M., Matricardi, M., McNally, A. P., Monge-Sanz, B. M., Morcrette, J.-J., Park, B.-K., Peubey, C., de Rosnay, P., Tavolato, C., Thépaut, J.-N., and Vitart, F.: The ERA-Interim reanalysis: configuration and performance of the data assimilation system, Q. J. Roy. Meteorol. Soc., 137, 553– 597, https://doi.org/10.1002/qj.828, 2011.
Dieser, M., Greenwood, M., and Foreman, C.: Carotenoid Pigmen-tation in Antarctic Heterotrophic Bacteria as a Strategy to With-stand Environmental Stresses, Arct. Antarct. Alp. Res., 42, 396– 405, https://doi.org/10.1657/1938-4246-42.4.396, 2010. Doherty, S. J., Grenfell, T. C., Forsström, S., Hegg, D. L., Brandt,
R. E., and Warren, S. G.: Observed vertical redistribution of black carbon and other insoluble light-absorbing particles in melting snow, J. Geophys. Res.-Atmos., 118, 5553–5569, https://doi.org/10.1002/jgrd.50235, 2013.
Enderlin, E. M., Howat, I. M., Jeong, S., Noh, M.-J., van Angelen, J. H., and van den Broeke, M. R.: An improved mass budget for the Greenland ice sheet, Geophys. Res. Lett., 41, 866–872, https://doi.org/10.1002/2013GL059010, 2014.
Fettweis, X., Box, J. E., Agosta, C., Amory, C., Kittel, C., Lang, C., van As, D., Machguth, H., and Gallée, H.: Reconstructions of the 1900–2015 Greenland ice sheet surface mass balance using the regional climate MAR model, The Cryosphere, 11, 1015–1033, https://doi.org/10.5194/tc-11-1015-2017, 2017.
Gardner, A. S. and Sharp, M. J.: A review of snow and ice albedo and the development of a new physically based broad-band albedo parameterization, J. Geophys. Res.-Ea. Surf., 115, f01009, https://doi.org/10.1029/2009JF001444, 2010.
Gribbon, P. W. F.: Cryoconite holes on Sermikavsak, west Green-land, J. Glaciol., 22, 177–181, 1979.
Hanna, E., Cropper, T. E., Hall, R. J., and Cappelen, J.: Greenland Blocking Index 1851–2015: a regional climate change signal, Int. J. Climatol., 36, 4847–4861, https://doi.org/10.1002/joc.4673, 2016.
from satellite observations, Environ. Res. Lett., 8, 044043, https://doi.org/10.1088/1748-9326/8/4/044043, 2013.
Hegg, D. A., Warren, S. G., Grenfell, T. C., Doherty, S. J., and Clarke, A. D.: Sources of light-absorbing aerosol in arctic snow and their seasonal variation, Atmos. Chem. Phys., 10, 10923– 10938, https://doi.org/10.5194/acp-10-10923-2010, 2010. Hock, R.: Glacier melt: a review of processes and
their modelling, Prog. Phys. Geogr., 29, 362–391, https://doi.org/10.1191/0309133305pp453ra, 2005.
Hodson, A., Anesio, A. M., Tranter, M., Fountain, A., Osborn, M., Priscu, J., Laybourn-Parry, J., and Sattler, B.: Glacial Ecosys-tems, Ecol. Monogr., 78, 41–67, https://doi.org/10.1890/07-0187.1, 2008.
Howat, I. M., Negrete, A., and Smith, B. E.: The Green-land Ice Mapping Project (GIMP) Green-land classification and surface elevation data sets, The Cryosphere, 8, 1509–1518, https://doi.org/10.5194/tc-8-1509-2014, 2014.
Larose, C., Dommergue, A., and Vogel, T. M.: The dynamic arctic snow pack: An unexplored environment for microbial diversity and activity, Biology, 2, 317–330, 2013.
Lutz, S., Anesio, A., Jorge Villar, S., and Benning, L.: Variations of algal communities cause darkening of a Greenland glacier, FEMS Microbiol. Ecol., 89, 402–414, 2014.
Lutz, S., Anesio, A. M., Raiswell, R., Edwards, A., Newton, R. J., Gill, F., and Benning, L. G.: The biogeography of red snow mi-crobiomes and their role in melting arctic glaciers, Nat. Com-mun., 7, 11968, https://doi.org/10.1038/ncomms11968, 2016. Lyapustin, A., Wang, Y., Xiong, X., Meister, G., Platnick, S., Levy,
R., Franz, B., Korkin, S., Hilker, T., Tucker, J., Hall, F., Sell-ers, P., Wu, A., and Angal, A.: Scientific impact of MODIS C5 calibration degradation and C6+improvements, Atmos. Meas. Tech., 7, 4353–4365, https://doi.org/10.5194/amt-7-4353-2014, 2014.
MacDonell, S. and Fitzsimons, S.: The formation and hydrological significance of cryoconite holes, Prog. Phys. Geogr., 32, 595– 610, https://doi.org/10.1177/0309133308101382, 2008. Painter, T. H., Duval, B., Thomas, W. H., Mendez, M., Heintzelman,
S., and Dozier, J.: Detection of quantification of snow algae with an Airborne Imaging Spectrometer, Appl. Environ. Microbiol., 67, 5267–5272, 2001.
Polashenski, C. M., Dibb, J. E., Flanner, M. G., Chen, J. Y., Courville, Z. R., Lai, A. M., Schauer, J. J., Shafer, M. M., and Bergin, M.: Neither dust nor black carbon causing apparent albedo decline in Greenland’s dry snow zone: Implications for MODIS C5 surface reflectance, Geophys. Res. Lett., 42, 9319– 9327, https://doi.org/10.1002/2015GL065912, 2015.
Remias, D., Holzinger, A., and Lutz, C.: Physiology, ultra-structure and habitat of the ice alga Mesotaenium berggrenii (Zygnemaphy- ceae, Chlorophyta) from glaciers in the European Alps, Phycologia, 48, 302–312, 2009.
Remias, D., Schwaiger, S., Aigner, S., Leya, T., Stuppner, H., and Lütz, C.: Characterization of an UV- and VIS-absorbing, purpurogallin-derived secondary pigment new to algae and highly abundant in Mesotaenium berggrenii (Zygnematophyceae, Chlorophyta), an extremophyte liv-ing on glaciers, FEMS Microbiol. Ecol., 79, 638–648, https://doi.org/10.1111/j.1574-6941.2011.01245.x, 2012.
Rignot, E. and Kanagaratnam, P.: Changes in the velocity structure of the Greenland Ice Sheet, Science, 311, 986–90, https://doi.org/10.1126/science.1121381, 2006.
Rignot, E., Velicogna, I., van den Broeke, M. R., Monaghan, A., and Lenaerts, J.: Acceleration of the contribution of the Greenland and Antarctic ice sheets to sea level rise, Geophys. Res. Lett., 38, 1–5, https://doi.org/10.1029/2011GL046583, 2011.
Sasgen, I., van den Broeke, M., Bamber, J. L., Rignot, E., Sorensen, L. S., Wouters, B., Martinec, Z., Velicogna, I., and Simonsen, S. B.: Timing and origin of recent regional ice-mass loss in Greenland, Earth Planet. Sc. Lett., 333, 293–303, https://doi.org/10.1016/j.epsl.2012.03.033, 2012.
Shepherd, A., Ivins, E. R., Geruo, A., Barletta, V. R., Bentley, M. J., Bettadpur, S., Briggs, K. H., Bromwich, D. H., Forsberg, R., Galin, N., Horwath, M., Jacobs, S., Joughin, I., King, M. A., Lenaerts, J. T. M., Li, J., Ligtenberg, S. R. M., Luckman, A., Luthcke, S. B., McMillan, M., Meister, R., Milne, G., Mouginot, J., Muir, A., Nicolas, J. P., Paden, J., Payne, A. J., Pritchard, H., Rignot, E., Rott, H., Sohn, H.-G., Rensen, L. S., Scambos, T. A., Scheuchl, B., Schrama, E. J. O., Smith, B., Sundal, A. V., van Angelen, J. H., van de Berg, W. J., van den Broeke, M. R., Vaughan, D. G., Velicogna, I., Wahr, J., Whitehouse, P. L., Wing-ham, D. J., Yi, D., Young, D., and Zwally, H. J.: A Reconciled Estimate of Ice-Sheet Mass Balance, Science, 338, 1183–1189, https://doi.org/10.1126/science.1228102, 2012.
Shimada, R., Takeuchi, N., and Aoki, T.: Inter-annual and geograph-ical variations in the extent of bare ice and dark ice on the Green-land ice sheet derived from MODIS satellite images, Front. Earth Sci., 4, 43, https://doi.org/10.3389/feart.2016.00043, 2016. Stibal, M., Sabacka, M., and Zarsky, J.: Biological processes
on glacier and ice sheet surfaces, Nat. Geosci., 5, 771–774, https://doi.org/10.1038/ngeo1611, 2012.
Stibal, M., Gozdereliler, E., Cameron, K., Box, J. E., Stevens, I., Gokul, J., Schostag, M., Zarsky, J., Edwards, A., Irvine-Fynn, T., and Jacobsen, C.: Microbial abundance in surface ice on the Greenland Ice Sheet, Front. Microbiol., 6, 225, https://doi.org/10.3389/fmicb.2015.00225, 2015.
Stroeve, J., Box, J. E., Wang, Z., Schaaf, C., and Barrett, A.: Re-evaluation of MODIS MCD43 Greenland albedo ac-curacy and trends, Remote Sens. Environ., 138, 199–214, https://doi.org/10.1016/j.rse.2013.07.023, 2013.
Takeuchi, N., Kohshima, S., and Seko, K.: Structure, Forma-tion, and Darkening Process of Albedo-Reducing Material (Cry-oconite) on a Himalayan Glacier: A Granular Algal Mat Growing on the Glacier, Arct. Antarct. Alp. Res., 33, 115–122, 2001. Tedesco, M., Doherty, S., Fettweis, X., Alexander, P.,
Jeyarat-nam, J., Noble, E., and Stroeve, J.: The darkening of the Greenland ice sheet: trends, drivers and projections (1981– 2100), The Cryosphere, 10, 477–496, https://doi.org/10.5194/tc-10-477-2016, 2016.
Teeling, H., Fuchs, B. M., Benke, C. M., Krüger, K., Chafee, M., Kappelman, L., Reintjes, G., Waldmann, J., Quast, C., Glöck-ner, F. O., Lucas, J., Wichels, A., Gerdts, G., Wiltshire, K. H., and Amann, R. I.: Recurring patterns in bacterioplankton dy-namics during coastal spring algae blooms, eLife, 5, e11888, https://doi.org/10.7554/eLife.11888, 2016.
cyanobacte-ria on glaciers in west Greenland, Polar Science, 4, 71–80, https://doi.org/10.1016/j.polar.2010.03.002, 2010.
van As, D., Fausto, R. S., Cappelen, J., van de Wal, R. S. W., Braith-waite, R. J., Machguth, H., and the PROMICE project team: Placing Greenland ice sheet ablation measurements in a multi-decadal context, Geologic Survey of Denmark and Greenland Bulletin, 35, 71–74, 2016.
van den Broeke, M. R., Smeets, C. J. P. P., and van de Wal, R. S. W.: The seasonal cycle and interannual variability of surface energy balance and melt in the ablation zone of the west Greenland ice sheet, The Cryosphere, 5, 377–390, https://doi.org/10.5194/tc-5-377-2011, 2011.
van den Broeke, M. R., Enderlin, E. M., Howat, I. M., Kuipers Munneke, P., Noël, B. P. Y., van de Berg, W. J., van Mei-jgaard, E., and Wouters, B.: On the recent contribution of the Greenland ice sheet to sea level change, The Cryosphere, 10, 1933–1946, https://doi.org/10.5194/tc-10-1933-2016, 2016. Warren, S. G.: Impurities in snow: effects on albedo and snowmelt,
Ann. Glaciol., 5, 177–179, 1984.
Warren, S. G.: Can black carbon in snow be detected by remote sensing?, J. Geophys. Res.-Atmos., 118, 779–786, https://doi.org/10.1029/2012JD018476, 2013.
Warren, S. G. and Wiscombe, W. J.: A model for the spectral albedo of snow. II: Snow containing atmospheric aerosols, J. Atmos. Sci., 37, 2734–2745, 1980.
Warren, S. G. and Wiscombe, W.: Dirty snow after nuclear war, Nature, 313, 467–470, 1985.
Webster-Brown, J., Hawes, I., Jungblut, A., Wood, S., and Christenson, H.: The effects of entombment on water chem-istry and bacterial assemblages in closed cryoconite holes on Antarctic glaciers, FEMS Microbiol. Ecol., 91, fiv144, https://doi.org/10.1093/femsec/fiv144, 2015.
Wharton, R. A., McKay, C. P., Simmons, G. M., and Parker, B. C.: Cryoconite Holes on Glaciers, BioScience, 35, 499–503, 1985. Wientjes, I. G. M. and Oerlemans, J.: An explanation for the dark
region in the western melt zone of the Greenland ice sheet, The Cryosphere, 4, 261–268, https://doi.org/10.5194/tc-4-261-2010, 2010.
Wientjes, I. G. M., De Van Wal, R., Schwikowski, M., Zapf, A., Fahrni, S., and Wacker, L.: Carbonaceous particles reveal that Late Holocene dust causes the dark region in the western abla-tion zone of the Greenland ice sheet, J. Glaciol., 58, 787–794, https://doi.org/10.3189/2012JoG11J165, 2012.