https://doi.org/10.5194/soil-3-113-2017
© Author(s) 2017. This work is distributed under the Creative Commons Attribution 3.0 License.
SOIL
Decision support for the selection of reference sites
using
137
Cs as a soil erosion tracer
Laura Arata1, Katrin Meusburger1, Alexandra Bürge1, Markus Zehringer2, Michael E. Ketterer3, Lionel Mabit4, and Christine Alewell1
1Environmental Geosciences, Department of Environmental Sciences, University of Basel, Basel, Switzerland 2State Laboratory Basel-City, Basel, Switzerland
3Chemistry Department, Metropolitan State University of Denver, Colorado, USA
4Soil and Water Management & Crop Nutrition Laboratory, FAO/IAEA Agriculture & Biotechnology
Laboratory, Vienna, Austria
Correspondence to:Katrin Meusburger ([email protected]) Received: 8 November 2016 – Discussion started: 22 November 2016 Revised: 12 June 2017 – Accepted: 15 June 2017 – Published: 4 August 2017
Abstract. The classical approach of using137Cs as a soil erosion tracer is based on the comparison between stable reference sites and sites affected by soil redistribution processes; it enables the derivation of soil erosion and deposition rates. The method is associated with potentially large sources of uncertainty with major parts of this uncertainty being associated with the selection of the reference sites. We propose a decision support tool to Check the Suitability of reference Sites (CheSS). Commonly, the variation among137Cs inventories of spatial replicate reference samples is taken as the sole criterion to decide on the suitability of a reference inventory. Here we propose an extension of this procedure using a repeated sampling approach, in which the reference sites are resampled after a certain time period. Suitable reference sites are expected to present no significant temporal variation in their decay-corrected137Cs depth profiles. Possible causes of variation are assessed by a decision tree. More specifically, the decision tree tests for (i) uncertainty connected to small-scale variability in137Cs due to its heterogeneous initial fallout (such as in areas affected by the Chernobyl fallout), (ii) signs of erosion or deposition processes and (iii) artefacts due to the collection, preparation and measurement of the samples; (iv) finally, if none of the above can be assigned, this variation might be attributed to “turbation” processes (e.g. bioturbation, cryoturbation and mechanical turbation, such as avalanches or rockfalls). CheSS was exemplarily applied in one Swiss alpine valley where the apparent temporal variability called into question the suitability of the selected reference sites. In general we suggest the application of CheSS as a first step towards a comprehensible approach to test for the suitability of reference sites.
1 Introduction
Soil erosion is a global threat (Lal, 2003). Recently estimated erosion rates range from low rates of 0.001–2 t ha−1yr−1 on flat relatively undisturbed lands (Pimentel, 2006) to high rates under intensive agricultural use of>50 t ha−1yr−1. In mountainous regions, rates ranging from 1 to 30 t ha−1yr−1 have been reported (e.g. Descroix and Mathys, 2003; Frankenberg et al., 1995; Konz et al., 2012) where they often exceed the natural process of soil formation (Alewell et al., 2015). The use of the artificial radionuclide 137Cs as a soil
erosion tracer has been increasing during the last decades, and the method has been applied all over the world with suc-cess (e.g. Mabit et al., 2013; Zapata, 2002). The use of137Cs as a soil erosion tracer allows for an integrated temporal es-timate of the total net soil redistribution rate per year since the time of the main fallout, including all erosion processes by water, wind and snow during summer and winter seasons (Meusburger et al., 2014).
137Cs was released into the atmosphere during nuclear
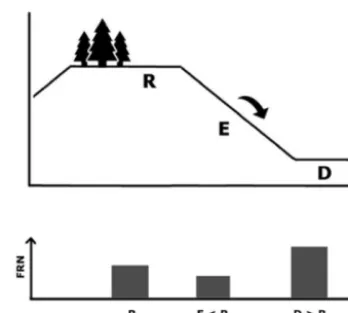
Figure 1. Concept of the fallout radionuclide (FRN) traditional method, in which the FRN content of a reference site located in a flat and undisturbed area (R) is compared to the FRN content of disturbed sites (E and D). If the FRN at the site under investigation is lower than at the reference site, the site has experienced erosion processes (E). If the FRN content is greater than at the reference site, the site has experienced deposition processes (D).
the land surface by dry and wet fallouts and once deposited on the ground, it is strongly bound to fine particles at the soil surface. Due to its low vertical migration rates, it moves predominantly in association with fine soil particles through physical processes and provides an effective track of soil and sediment redistribution processes (Mabit et al., 2008). The traditional approach to using the137Cs method is based on the comparison between the inventory (total radionuclide activity per unit area) at a given sampling site and that of a so-called reference site located in a flat and undisturbed stable area. The method indicates the occurrence of erosion processes at sites with a lower137Cs inventory compared to the reference site and sediment deposition processes at sites with a greater137Cs inventory (Fig. 1a). Specific mathemati-cal conversion models allow for the derivation of quantitative estimates of soil erosion and deposition rates from the latter comparison (IAEA, 2014).
The efficacy of the method relies on an accurate selection of representative reference sites (Mabit et al., 2008; Owens and Walling, 1996; Sutherland, 1996). The measured total 137Cs inventory at the reference sites represents the baseline
fallout (i.e. reference inventory), a fundamental parameter for the qualitative and quantitative assessment of soil redistri-bution rates (Loughran et al., 2002). It is used for the com-parison with the total137Cs inventories of the sampling sites and therefore determines if and how strongly a site is erod-ing or accumulaterod-ing sediments. Moreover, the depth profile of the137Cs distribution in the soil at the reference site plays a very important role, as the shape of this profile is used in the conversion models to convert changes in137Cs inventory to quantitative estimates of soil erosion rates (Walling et al., 2002). Recent studies have demonstrated the sensitivity of conversion models to uncertainties or even biases in the
ref-erence inventory (e.g. Arata et al., 2016; Iurian et al., 2014; Kirchner, 2013).
The close proximity of a reference site to the area under investigation is required to meet the assumption that both have experienced similar initial fallout. The latter is partic-ularly important if the study area was strongly affected by Chernobyl fallout, which, aside from global fallout from nu-clear weapons testing, is the major137Cs input in many re-gions of Europe. Because of different geographical situa-tions and meteorological condisitua-tions at the time of passage of the radioactive cloud, the contamination associated with Chernobyl fallout was very inhomogeneous (Chawla et al., 2010; Alewell et al., 2014). Therefore, in some areas a sig-nificant small-scale variability in137Cs distribution may be expected. As already pointed out by Lettner et al. (1999) and Owens and Walling (1996), this might impede the compar-ison between reference and sampling sites. To adequately consider the spatial variability in the FRN fallout, multiple reference sites should be selected and the variability within the sites properly addressed (Kirchner, 2013; Mabit et al., 2013; Pennock and Appleby, 2002). In addition, the refer-ence site should not have experirefer-enced any soil erosion or de-position processes since the main137Cs fallout (which gen-erally requires that it was under continuous vegetation cover, such as perennial grass). Different forms of turbation, includ-ing animal turbation, anthropogenic turbation and cryoturba-tion or snow processes, may also affect the137Cs soil depth distribution at the reference site. Finally, the collection of the samples, the preparation process and gamma analysis might introduce a certain level of uncertainty, which should be care-fully considered. For instance, Lettner et al. (1999) estimated that preparation and measuring processes contribute 12.2 % to the overall variability in the reference inventory. Guidance in the form of independent indicators (e.g. stable isotopes as suggested by Meusburger et al., 2013) for the suitability of reference sites might assist with the selection of reference sites.
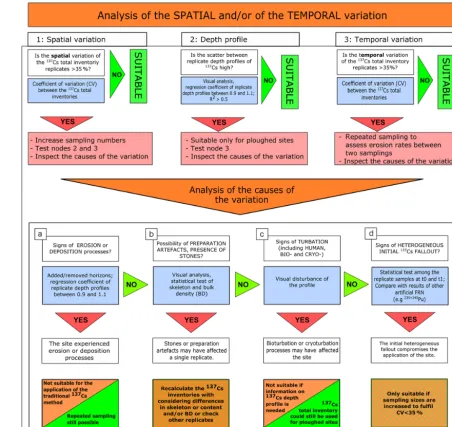
2 CheSS (Check the Suitability of reference Sites): a concept to assess the suitability of reference sites for the application of137Cs as a soil erosion tracer
2.1 Repeated sampling strategy and calculation of inventories
The time period for the repeated sampling of reference sites needed for the application of 137Cs as a soil erosion tracer will be site- and case-specific and depends on the initial small-scale spatial variability and the depth distribution of the reference inventory. The time span should be of sufficient length to cause an inventory change that is larger than the un-certainty related to the inventory assessment, e.g. larger than 35 %. In our study site, which is affected by anthropogenic disturbance and snow erosion of several millimetres per win-ter, 2 years can be considered sufficient (Meusburger et al., 2014). Several spatial repetitions following the suggestion of Sutherland (1996) are necessary and should be analysed sep-arately to investigate the small-scale variability in137Cs in the area. As we detected measurement differences between different detectors (see below), all samples should ideally be measured for137Cs activity using the same analytical facili-ties. Finally,137Cs activity needs to be decay corrected to the same date (either the period of the first sampling campaign or the second) considering the half-life of137Cs (30.17 years).
The decay-corrected 137Cs activities (act, Bq kg−1) of each soil layer in the depth profile are converted into inven-tories (Inv, Bq m−2) with the following equation:
Inv=act×xm, (1)
wherexm is the measured mass depth of fine soil material (<2 mm fraction; kg m−2) in the respective soil sample. The depth profile of each reference site is then displayed as in-ventory (Bq m−2) against the depth of each layer (cm). The repeated sampling inventory change (Invchange) can then be defined as
Invchange=
Invt0−Invt1 Invt0
×100, (2)
where t0 andt1 are the dates of the first and second sam-pling campaigns, respectively, Invt1 is the 137Cs inventory (Bq m−2) att1and Invt0is the137Cs inventory att0. Positive values of Invchangeindicate erosion, whereas negative values stand for deposition.
2.2 A decision tree to assess the suitability of reference sites
We evaluated the suitability of the reference sites by analysing, in addition to the spatial variability, the temporal variation in the 137Cs inventory. Given the assumption that no additional deposition of137Cs occurred at the sites dur-ing the investigated time window (which is valid worldwide except for the areas affected by the Fukushima Daiichi fall-out), any temporal variation in the137Cs content should be
attributable to different forms of soil disturbance or artefacts in the preparation or measurement of the samples. The poten-tial causes of the spapoten-tial and temporal variation in the137Cs total inventories and depth profiles are examined through a decision tree which includes three main nodes (Fig. 2).
2.2.1 Node 1: spatial variation in FRN total inventory Firstly, the spatial variation in the137Cs total inventory at each reference site is tested. Ideally, several replicates have been collected. If the coefficient of variation (CV) exceeds 35 % as suggested by Sutherland (1996), this could be a sign of unsuitability of the reference site, but it leaves the pos-sibility of (i) increasing sampling numbers, (ii) analysing the causes of the spatial variation (see CheSS A to D) and (iii) moving to nodes 2 and 3 in CheSS.
2.2.2 Node 2: variation in the137Cs depth profile Secondly, whether there is a significant variation between the 137Cs depth profiles measured as spatial or temporal (int0
andt1) replicates is tested. In theory, at a stable site the shape of the depth profile should not change between replicates. Consequently, a regression between the FRN activity depth profiles collected as spatial or temporal replicates should fol-low a 1 : 1 line, and the variability should lie within the range of the observed spatial uncertainty (node 1). A deviation of the linear regression coefficient from the 1 : 1 line in com-bination with high residues and low R2 values (<0.5R2) indicates an immediate and significant change in the pro-file, which is typically caused by anthropogenic disturbance. For the FRN application at ploughed sites, the reference site might still be considered appropriate if the total inventory is not affected because conversion models used for ploughed sites are less sensitive to the shape of the FRN depth distribu-tion. For unploughed soils, again the analysis of causes A to D might help in understanding the causes of the variability. Alternative options would be to take temporal replicates to evaluate the stability and thus the suitability of the reference site (node 3).
Figure 2.The CheSS decision tree to evaluate the suitability of a reference site for using137Cs as a soil erosion tracer.
2.2.4 Signs of disturbance associated with erosion and deposition processes (A)
A variation in the137Cs depth profile may have been caused by soil movement processes affecting the site (Fig. 2a). If the site experienced a loss of soil due to erosion, we expect to ob-serve a removal of the top soil layers of the profile measured, for instance during the second sampling campaign (Fig. 3; red values below the reference profile). Further, the regres-sion coefficient of the reference site that was affected by ero-sion will tend to be <0.9 when plotted against a suitable reference profile or (for node 3) the reference profile before the disturbance (Fig. 3). In the case of deposition, a sedi-mentation layer should be found on the top of the reference depth profile, assuming that no ploughing operations affected
the site (Fig. 3; red values above the reference profile). In this case, the regression coefficient will be>1.1. Informa-tion on the depth distribuInforma-tion of another FRN might provide additional reliable confirmation. If redistribution processes are confirmed, the site is not suitable as a reference site and another location or a repeated FRN sampling approach to estimate erosion rates between the two sampling campaign should be considered (Kachanoski and de Jong, 1984).
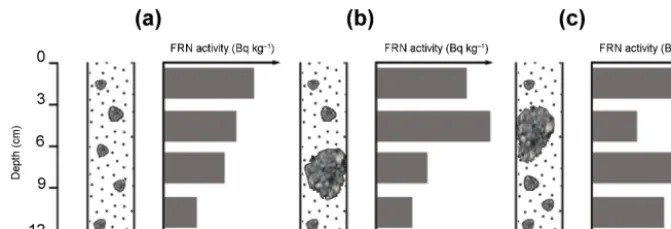
2.2.5 Sampling or preparation artefacts (B)
Figure 3.Hypothetical signs of sheet erosion (red) and deposition (blue) on a depth profile compared to an undisturbed site.
determine passways for water and very fine particles and so-lutes in the soil and thus influence the accumulation and mi-gration of 137Cs through the soil layers. As 137Cs reaches the soil by fallout from the atmosphere, the common shape of the137Cs distribution along the undisturbed depth profile can be described by an exponential function with the high-est137Cs concentrations located in the uppermost soil layers (Mabit et al., 2008; Walling et al., 2002). This is particularly the case for soils with a low skeleton content (Fig. 4a) since the presence of stones may affect 137Cs depth distribution either through (i) impeding the 137Cs downward migration (137Cs activity could then be concentrated in the layer above the stone; Fig. 4b) or (ii) creating macropores and micro-pores, favouring the 137Cs associated with fine particles to “migrate” to deeper layers (Fig. 4c) or causing lateral move-ment which will induce a lower137Cs content in our samples. As such, the seemingly spatial or temporal variation in the depth profile might indeed be a spatial variation induced by differences in skeleton content and/or bulk densities. Higher bulk densities will result in higher increment inventories even if137Cs activities at the layers are comparable. Thus, a thor-ough control (eventually thrthor-ough a statistical test, such as a paired t test) of whether skeleton content and bulk densi-ties are comparable between replicates is suggested. Finally, sampling, preparation artefacts and measuring processes may produce various sources of error between different sites and years. The latter is especially the case if different people pre-pare the samples. An estimation of possible errors might be considered, for example through a simulation of different in-crement assignment along the profile. If different detectors or different calibration sources and/or geometry are used in the two sampling campaigns, a comparability check of the measurements is advisable. For instance, a subset of sam-ples could be measured with the two different detectors, and any potential discrepancy in the results should be properly reported.
2.2.6 Signs of soil disturbance (C)
Different forms of disturbance, such as bioturbation, cryotur-bation or even human-induced soil perturcryotur-bation (e.g. tillage, seedbed preparation or digging), might have influenced the 137Cs depth distribution between different sites and t0 and
t1 (Fig. 2c). Occurrences of turbation are often difficult to identify prior to sampling but might eventually be detected by using other tracing approaches, such as theδ13C depth distribution (Meusburger et al., 2013; Schaub and Alewell, 2009). In the case of turbation, the shape of the depth pro-file will be highly variable and should not be considered in the estimation of soil redistribution rates for unploughed soils. Nonetheless, the total inventory of137Cs at a ploughed site could still be used in combination with simple and ba-sic mathematical conversion models, such as the proportional model (Ritchie and McHenry, 1990; IAEA, 2014), which re-quire information only about the total reference inventory of 137Cs and do not need detailed information about the 137Cs
depth distribution.
2.2.7 Signs of a heterogeneous initial fallout of137Cs over the area (D)
be-Figure 4.Possible influence of stones on the FRN depth distribution.
tween reference site replicates) measured at both or at least one sampling campaign by looking at the CV again, as pre-sented in the previous sections, or through a statistical test (for example, the analysis of variance, ANOVA). If the spa-tial variability is highly significant, the site should not be en-visaged as a reference site for the application of the 137Cs method unless the number of samples collected for the de-termination of the reference baseline is large enough (at least 10) to counterweight the small-scale variability within the site (Mabit et al., 2012; Sutherland, 1996; Kirchner, 2013). A possible validation of this cause of heterogeneity might be a comparison with the spatial distribution of another FRN, such as239+240Pu or210Pbex(Porto et al., 2013; Fig. 2d). As the fallout deposition of239+240Pu after the Chernobyl acci-dent was confined to a restricted area in the vicinity of the nuclear power plant (Ketterer et al., 2004), the origin of plu-tonium fallout in the rest of Europe is linked to the past nu-clear bomb tests only. Consequently, the Pu fallout distribu-tion was more homogeneous (Alewell et al., 2014; Ketterer et al., 2004; Zollinger et al., 2015). If the 239+240Pu depth profiles do not vary significantly between the two sampling years, there should be no disturbance (e.g. turbation, erosion) or measurement artefacts. As such, it might be concluded that the heterogeneous deposition of137Cs at the time of the fall-out prejudices the use of Cs at this site.
3 The application of the CheSS decision tree
3.1 Study area
To test the methodology described above, we used a data set from an alpine study area, the Urseren Valley (30 km2) in Central Switzerland (Canton Uri), which has an eleva-tion ranging from 1440 to 3200 m a.s.l. At the valley bot-tom (1442 m a.s.l.), the average annual air temperature for the years 1980–2012 is around 4.1±0.7◦C and the mean annual precipitation is 1457±290 mm with 30 % falling as snow (MeteoSwiss). The U-shaped valley is snow covered from November to April. On the slopes, pasture is the domi-nant land use, whereas hayfields are prevalent near the valley bottom.
3.2 Sampling design
Supportive information was provided by the local landown-ers to select the reference sites in both valleys. Sites used for ploughing and grazing activities were excluded. A first sampling campaign was undertaken in autumn 2010 for 239+240Pu and in 2013 for137Cs. Six reference sites (REF1 to
REF6) were identified in flat and undisturbed areas along the valley. At each site, three cores (40 cm of depth) 1 m apart from each other were sampled. The cores were cut in 3 cm increments to derive information on the137Cs depth profile. The three cores from each site were bulked to provide one composite sample per site. During the second sampling cam-paign in spring 2015, all six reference sites were resampled. Considering the typical and high soil redistribution dynam-ics of the valley of>1 cm per year caused by snow-induced soil removal (Meusburger et al., 2014), the time span is suf-ficiently long to ensure the possibility to observe changes in the depth profiles if soil erosion and deposition processes af-fected the area. At each site, we collected three replicates, which were analysed separately, to investigate the small-scale variability in the FRN content. All cores were air-dried (40◦C for 72 h) and sieved (<2 mm) to remove coarse par-ticles; the skeleton content and the bulk density (BD) were determined.
3.3 Measurement of anthropogenic FRN activities and inventories
Figure 5.The comparison between the137Cs measurements of a subset of samples (n=16) performed with two different HPGe de-tectors; detector 1 is housed by the Physics Department at the Uni-versity of Basel (CH) and detector 2 is housed by the State Labora-tory Basel-City (CH).
All soil samples were counted in sealed discs (65 mm di-ameter, 12 mm height, 32 cm3) and the measurements were corrected for sample density and potential radioactivity back-ground. The detectors located at the State Laboratory Basel-City were calibrated with a reference solution of the same ge-ometry. The reference contained152Eu and241Am (2.6 kBq rsp. 7.7 kBq) to calibrate the detectors from 60 to 1765 keV. It was obtained from the Czech Metrology Institute, Prague. This solution was bound in silicon resin with a density of 1.0. The efficiency functions were corrected for coincidence summing of the152Eu lines using a Monte Carlo simulation program (Gespecor). The137Cs was counted at 662 keV with an emission probability of 0.85 and a (detector) resolution of 1.3 to 1.6 keV (FWHM). All measurements and calculations were performed with the gamma software Interwinner 7. The 137Cs activity measurements were all decay corrected to the
year 2015.
To compare the137Cs results to another artificial FRN, all samples were also measured for239+240Pu activity. The de-termination of plutonium isotopes from both valleys and for both sampling years was performed using a Thermo X Se-ries II quadrupole ICP-MS at Northern Arizona University, USA. A detailed description of the ICP-MS specifications and sample preparation procedure can be found in Alewell et al. (2014). The activities of 137Cs and 239+240Pu (act, Bq kg−1) were converted into inventories (Bq m−2) accord-ing to Eq. (1).
3.4 Application of the CheSS decision support tool to the reference sites
Because the137Cs activity of the samples was measured with different detectors for the two sampling years, we investi-gated the potential variability between the two detectors. A
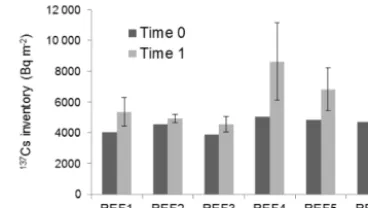
Figure 6.Temporal variation between the total137Cs inventories measured at the reference sites in the Urseren Valley; time 0=2013 and time 1=2015. The error bars indicate the standard deviations of the inventories among the replicates collected at each reference site in 2015.
selected subset of samples (n=24) was analysed using both detectors (one located at the Institute of Physics at the Uni-versity of Basel and the other located at the State Laboratory Basel-City). The results highlight a strong correspondence between the measurements by the two analytical systems (R2=0.97; p <0.005); however, the detector at the State Laboratory Basel-City returned slightly lower137Cs activi-ties (Fig. 5). Thus, the137Cs activities of the samples mea-sured in 2013 were corrected to the values of the detector at the State Laboratory Basel-City (which has a higher effi-ciency) to allow for comparability between the different data sets.
Total137Cs inventories (decay corrected to the year 2015) of the six reference sites collected in the Urseren Valley in 2013 range from 3858 to 5057 Bq m−2with a mean value of 4515 Bq m−2and a standard deviation (SD) of 468 Bq m−2. Data from 2015 range between 3925 and 8619 Bq m−2with a mean value of 5701 Bq m−2 and a SD of 1730 Bq m−2 (Fig. 6).
When following the CheSS decision tree, we investigated the variation in the137Cs total inventories at each reference site (node 1). The replicate samples were analysed separately only during the second sampling campaign (t1), while dur-ing the first sampldur-ing campaign (t0) only composite samples were analysed. Reference sites REF3, REF5 and REF6 pre-sented signs of high small-scale variability, as expressed by a CV of 48 %. Such variability excluded them from any further application as reference sites without subsequent additional sampling. For sites REF1, REF2 and REF4, the CV was be-tween 19 and 31 %.
Figure 7.The137Cs depth profiles of the six investigated reference sites in the Urseren Valley for the two different sampling campaigns. The error bars indicate the standard deviations of the inventories among the replicates collected at each reference site 2015. The regression equation between the depth profile att0 andt1 is displayed together with theR2.
no longer a suitable reference site. Among the sites with high spatial variability, the site REF6 showed signs of erosion with a regression coefficient betweent0 andt1=0.79.
In node 3 the temporal differences in total inventories be-tween t0 and t1 were assessed. Here only the site REF4 showed a significant difference in the total137Cs inventories betweent0 andt1, thus confirming the unsuitability of the site after the construction work.
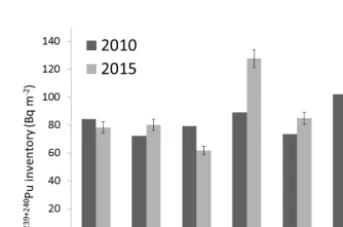
To further investigate the causes of the spatial variation, 239+240Pu inventories measured at the three replicates of each
site were analysed for t0=2010 and t1=2015 (Fig. 8). Clearly, deposition for REF4 and erosion processes for REF6 were confirmed with an increase of 46 % and a decrease of 27 % in the total239+240Pu inventory betweent0 andt1, re-spectively.
Further, we looked at the differences in the skeleton con-tent of the three replicate samples collected at t1 (Fig. 2b). For site REF1, an ANOVA test showed a significant differ-ence (p value of 0.025), and thus a difference in the
pres-Figure 8.Temporal variation between the total239+240Pu invento-ries measured at the reference sites in the Urseren Valley; time 0=
ence of stones in the three soil cores might have affected the FRN depth distribution. In particular, a Tukey’s HSD (honest significant difference) post-hoc pairwise comparison identi-fied the replicate number 3 at REF1 as a potential outlier. To validate the suitability of REF1, more replicates should be collected and measured in order to compare their137Cs depth profiles to the results obtained during the first sam-pling campaign. In summary, only the reference site REF2 appeared to be suitable for137Cs-based studies. For the site REF4, the construction work precluded its suitability for fur-ther application as a reference site. Form visual inspection of the soil profile, B could exclude cause C and consequently the final cause of heterogeneous fallout with high spatial vari-ability (D) applies for the sites REF3 and REF5. These sites may be suitable for other FRNs or for137Cs if more samples are collected to constrain the spatial heterogeneity that was introduced by the137Cs Chernobyl fallout.
4 Conclusion
With the decision tree CheSS, a support tool to verify the suitability of reference sites for a 137Cs-based soil erosion assessment is presented. Great attention has to be given to analysis of the small-scale variability in 137Cs distribution in the reference areas, especially in regions affected by nu-clear accident fallout. To cope with small-scale variability, sampling numbers might be increased or the temporal vari-ation in 137Cs or another radionuclide, such as 239+240Pu, might be analysed. The CheSS test in the Urseren Valley in-dicated that the heterogeneity and disturbance of137Cs dis-tribution prejudiced the suitability of some reference sites. Additionally, the presence of stones affected the shapes of the depth profiles in at least one replicate sample at reference site 1. Including unsuitable reference sites, the application of the traditional137Cs approach, based on a spatial compari-son between reference and sampling sites, is compromised. To derive soil redistribution rates, a137Cs repeated sampling approach should be preferred. This approach is based on a temporal comparison of the FRN inventories measured at the same site in different times (Kachanoski and de Jong, 1984). It does not require the selection of reference sites because the inventory documented by the initial sampling campaign is used as the reference inventory for that point (Porto et al., 2014).
Accurate soil erosion assessment is crucially needed to validate soil erosion modelling, which can help prevent and mitigate soil losses on larger spatial scales. In this context, FRN could play a decisive role if we are able to overcome its potential pitfalls, especially related to the selection of suitable reference sites. The decision tree CheSS provides a concept for objective and comparable reference site test-ing, which enables the exclusion of sites which present signs of uncertainty. We are convinced that this can contribute to
improving the reliability of FRN-based soil erosion assess-ments.
Data availability. The data in this paper can be found in the Sup-plement.
The Supplement related to this article is available online at https://doi.org/10.5194/soil-3-113-2017-supplement.
Author contributions. LA, KM, LM and CA designed the con-cept of the method and analysed the data. AB contributed to the collection and preparation of the soil samples and to the analysis of the data. MZ measured the137Cs activity in the soil samples and analysed the results. MEK measured the239+240Pu activity in the soil samples. LA prepared the paper with contributions from all co-authors.
Competing interests. The authors declare that they have no con-flict of interest.
Acknowledgements. The authors would like to thank An-nette Ramp, Gregor Juretzko, Simon Tresch, Carmelo La Spada and Axel Birkholz for support during fieldwork. This work was financially supported by the Swiss National Science Foundation (SNF; project no. 200021-146018) and was finalized in the frame-work of the IAEA Coordinated Research Project (CRP) “Nuclear techniques for a better understanding of the impact of climate change on soil erosion in upland agro-ecosystems” (D1.50.17).
Edited by: Olivier Evrard
Reviewed by: two anonymous referees
References
Alewell, C., Meusburger, K., Juretzko, G., Mabit, L., and Ketterer, M. E.: Suitability of239+240Pu and 137Cs as tracers for soil erosion assessment in mountain grasslands, Chemosphere, 103, 274–280, 2014.
Alewell, C., Egli, M., and Meusburger, K.: An attempt to estimate tolerable soil erosion rates by matching soil formation with de-nudation in Alpine grasslands, J. Soil. Sediment., 15, 1383–1399, 2015.
Arata, L., Meusburger, K., Frenkel, E., A’Campo-Neuen, A., Iuran, A. R., Ketterer, M. E., Mabit, L., and Alewell, C.: Modelling Deposition and Erosion rates with RadioNuclides (MODERN) – Part 2: A comparison of different models to convert239+240Pu inventories into soil redistribution rates at unploughed sites, J. Environ. Radioactiv., 162, 97–106, 2016.
Alpine soils (Val Piora, Switzerland) compared to the distribu-tion of selected major and trace elements, Sci. Total Environ., 408, 3292–3302, 2010.
Descroix, L. and Mathys, N.: Processes, spatio-temporal factors and measurements of current erosion in the French southern Alps: a review, Earth Surf. Proc. Land., 28, 993–1011, 2003.
Frankenberg, P., Geier, B., Proswitz, E., Schütz, J., and Seeling, S.: Untersuchungen zu Bodenerosion und Massenbewegungen im Gunzesrieder Tal/Oberallgäu, Forstwissenschaftliches Cen-tralblatt vereinigt mit Tharandter forstliches Jahrbuch, 114, 214– 231, 1995.
IAEA (International Atomic Energy Agency): Guidelines for us-ing Fallout radionuclides to assess erosion and effectiveness of soil conservation strategies. IAEA-TECDOC-1741, IAEA publi-cation, Vienna, Austria, 213 pp., 2014.
Iurian, A. R., Mabit, L., and Cosma, C.: Uncertainty related to in-put parameters of137Cs soil redistribution model for undisturbed fields, J. Environ. Radioactiv., 136, 112–120, 2014.
Kachanoski, R. G. and De Jong, E.: Predicting the temporal rela-tionship between soil cesium-137 and erosion rate, J. Environ. Qual., 13, 301–304, 1984.
Ketterer, M. E., Hafer, K. M., Jones, V. J., and Appleby, P. G.: Rapid dating of recent sediments in Loch Ness: ICPMS measurements of global fallout Pu, Sci. Total Environ., 322, 221–229, 2004. Kirchner, G.: Establishing reference inventories of 137Cs for soil
erosion studies: methodological aspects, Geoderma, 211, 107– 115, 2013.
Konz, N., Prasuhn, V., and Alewell, C.: On the measurement of alpine soil erosion, Catena, 91, 63–71, 2012.
Lal, R.: Soil erosion and the global carbon budget, Environ. Int., 29, 437–450, 2003.
Lettner, H., Bossew, P., and Hubmer, A. K.: Spatial variability of fallout Caesium-137 in Austrian alpine regions, J. Environ. Ra-dioact., 47, 71–82, 1999.
Loughran, R. J., Pennock, D. J., and Walling, D. E.: Spatial distri-bution of caesium-137, in: Handbook for the Assessment of Soil Erosion and Sedimentation Using Environmental Radionuclides, Springer, Dordrecht, 97–109, 2002.
Mabit, L., Benmansour, M., and Walling, D. E.: Comparative advantages and limitations of the fallout radionuclides 137Cs, 210Pb
ex and7Be for assessing soil erosion and sedimentation, J. Environ. Radioact., 99, 1799–1807, 2008.
Mabit, L., Chhem-Kieth, S., Toloza, A., Vanwalleghem, T., Bernard, C., Amate, J. I., de Molina, M. G., and Gómez, J. A.: Ra-dioisotopic and physicochemical background indicators to assess soil degradation affecting olive orchards in southern Spain, Agr. Ecosyst. Environ., 159, 70–80, 2012.
Mabit, L., Meusburger, K., Fulajtar, E., and Alewell, C.: The useful-ness of137Cs as a tracer for soil erosion assessment: A critical reply to Parsons and Foster (2011), Earth-Sci. Rev., 127, 300– 307, 2013.
Meusburger, K., Mabit, L., Park, J.-H., Sandor, T., and Alewell, C.: Combined use of stable isotopes and fallout radionuclides as soil erosion indicators in a forested mountain site, South Korea, Biogeosciences, 10, 5627–5638, https://doi.org/10.5194/bg-10-5627-2013, 2013.
Meusburger, K., Leitinger, G., Mabit, L., Mueller, M. H., Walter, A., and Alewell, C.: Soil erosion by snow gliding – a first quantifi-cation attempt in a subalpine area in Switzerland, Hydrol. Earth Syst. Sci., 18, 3763–3775, https://doi.org/10.5194/hess-18-3763-2014, 2014.
Owens, P. N. and Walling, D. E.: Spatial variability of caesium-137 inventories at reference sites: an example from two contrasting sites in England and Zimbabwe, Appl. Radiat. Isot., 47, 699–707, 1996.
Parsons, A. J. and Foster, I. D. L.: What can we learn about soil erosion from the use of137Cs?, Earth Sci. Rev., 108, 101–113, https://doi.org/10.1016/j.earscirev.2011.06.004, 2011.
Parsons, A. J. and Foster, I. D. L.: The assumptions of science A reply to Mabit et al. (2013), Earth-Sci. Rev., 127, 308–310, 2013. Pennock, D. J. and Appleby, P. G.: Site selection and sampling de-sign, in: Handbook for the Assessment of Soil Erosion and Sed-imentation Using Environmental Radionuclides, Springer, Dor-drecht, 15–40, 2002.
Pimentel, D.: Soil erosion: A food and environmental threat, Envi-ronment Development and Sustainability, 8, 119–137, 2006. Porto, P., Walling, D. E., and Callegari, G.: Using 137Cs and
210Pbexmeasurements to investigate the sediment budget of a
small forested catchment in southern Italy, Hydrol. Process., 27, 795–806, 2013.
Porto, P., Walling, D. E., Alewell, C., Callegari, G., Mabit, L., Mallimo, N., Meusburger, K., and Zehringer, M.: Use of a137Cs re-sampling technique to investigate temporal changes in soil erosion and sediment mobilisation for a small forested catchment in southern Italy, J. Environ. Radioact., 138, 137–148, 2014. Ritchie, J. C. and McHenry, J. R.: Application of radioactive fallout
Cesium-137 for measuring soil-erosion and sediment accumula-tion rates and patterns – a review, J. Environ. Qual., 19, 215–233, 1990.
Schaub, M. and Alewell, C.: Stable carbon isotopes as an indicator for soil degradation in an alpine environment (Urseren Valley, Switzerland), Rapid Commun. Mass Sp., 23, 1499–1507, 2009. Sutherland, R. A.: Caesium-137 soil sampling and inventory
vari-ability in reference locations: A literature survey, Hydrol. Pro-cess., 10, 43–53, 1996.
Walling, D. E., He, Q., and Appleby, P. G.: Conversion models for use in soil-erosion, soil-redistribution and sedimentation inves-tigations, in: Handbook for the assessment of soil erosion and sedimentation using environmental radionuclides, edited by: Za-pata, F., Kluwer, Dordrecht, the Netherlands, 111–164, 2002. Zapata, F. (Ed.): Handbook for the assessment of soil erosion
and sedimentation using environmental radionuclides (Vol. 219), Dordrecht, Kluwer Academic Publishers, 2002.