Nonlinear Processes
in Geophysics
©European Geophysical Society 2002
Cross recurrence plot based synchronization of time series
N. Marwan1, M. Thiel1, and N. R. Nowaczyk2 1Institute of Physics, University of Potsdam, Germany 2GeoForschungs-Zentrum Potsdam, Germany
Received: 3 September 2001 – Accepted: 25 October 2001
Abstract. The method of recurrence plots is extended to the cross recurrence plots (CRP) which, among others, enables the study of synchronization or time differences in two time series. This is emphasized in a distorted main diagonal in the cross recurrence plot, the line of synchronization (LOS). A non-parametrical fit of this LOS can be used to rescale the time axis of the two data series (whereby one of them is compressed or stretched) so that they are synchronized. An application of this method to geophysical sediment core data illustrates its suitability for real data. The rock magnetic data of two different sediment cores from the Makarov Basin can be adjusted to each other by using this method, so that they are comparable.
1 Introduction
The adjustment of data sets with various time scales occurs on many occasions, e.g. data preparation of tree rings or geo-physical profiles. In geology, often a large set of geogeo-physical data series is taken at various locations (e.g. sediment cores). That is why these data series have a different length and time scale. Before any time series analysis can be started, the data series have to be synchronized to the same time scale. Usu-ally, this is done visually by comparing and correlating each maximum and minimum in both data sets by hand (wiggle matching), which includes the human factor of subjective-ness and is a lengthy process. An automatic and objective method for verification should be very welcome.
In the last decades some techniques for this kind of corre-lation and adjustment were suggested. They span graphical methods (Prell et al., 1986), inverse algorithms, e.g. using Fourier series (Martinson et al., 1982) and algorithms based on similarity of data, e.g. sequence slotting (Thompson and Clark, 1989).
However, we focus on a method based on nonlinear time series analysis. During our investigations of the method of Correspondence to: N. Marwan
cross recurrence plots (CRP), we have found an interesting feature. Besides the possibility of application of the recur-rence quantification analysis (RQA) of Webber and Zbilut on CRPs (1994), there is a more fundamental relation be-tween the structures in the CRP and the considered systems. This feature can be used for synchronization of data sets. Al-though the first steps of this method are similar to the se-quence slotting method, their roots are different.
First we give an introduction to CRPs. Then we explain the relationship between the structures in the CRP and the systems and illustrate this with a simple model. Finally, we apply the CRP to geophysical data in order to synchronize various profiles and to show their practical availability. Since we focus on the synchronization feature of the CRP, we will not give a comparison between the different alignment meth-ods.
2 The Recurrence Plot
Recurrence plots (RP) were firstly introduced by Eckmann et al. (1987) in order to visualize time dependent behaviour of orbits xi in phase space. An RP represents the
recur-rence of the phase space trajectory to a state. The recurrecur-rence of states is a fundamental property of deterministic dynami-cal systems (Argyris et al., 1994; Casdagli, 1997; Kantz and Schreiber, 1997). The main step in the visualization is the calculation of theN×N-matrix
Ri, j =2 ε− kxi−xjk
, i, j=1. . . N , (1)
whereεis a predefined cutoff distance,k · kis the norm (e.g. the Euclidean norm) and2(x)is the Heaviside function. The values one and zero in this matrix can be simply visualized by the colours black and white. Depending on the kind of application,εcan be a fixed value or it can be changed for eachiin such a way that in the ball with the radiusεa pre-defined amount of neighbours occurs. The latter will provide a constant density of recurrence points in each column of the RP.
and Zbilut, 1994): A collection of single recurrence points, homogeneously and irregularly distributed over the whole plot, reveals a mainly stochastic process. Longer parallel diagonals, formed by recurrence points and with the same distance between the diagonals, are caused by periodic pro-cesses. A paling of the RP away from the main diagonal to the corners reveals a drift in the amplitude of the sys-tem. Vertical and horizontal white bands in the RP result from states which occur rarely or represent extremes. Ex-tended horizontal and vertical black lines or areas occur if a state does not change for some time, e.g. laminar states. All these structures were formed by using the property of recur-rence of states. It should be pointed out that the states are only the “same” and recur in the sense of the vicinity, which is determined by the distanceε. RPs and their quantitative analysis (RQA) became better known in the last decade (e.g. Casdagli, 1997). Their applications to a wide field of mis-cellaneous research show their suitability in the analysis of short and non-stationary data.
3 The Cross Recurrence Plot
Analogous to Zbilut et al. (1998), we have expanded the method of recurrence plots (RP) to the method of cross re-currence plots. In contrast to the conventional RP, two time series are simultaneously embedded in the same phase space. The test for closeness of each point of the first trajectoryxi
(i = 1. . . N) with each point of the second trajectory yj
(j =1. . . M) results in aN×Marray
CRi, j =2 ε− kxi −yjk. (2)
The visualization of this is called the cross recurrence plot. The definition of the closeness between both trajectories can be varied as described above. Varyingε may be useful to handle systems with different amplitudes.
The CRP compares the considered systems and allows us to benchmark the similarity of states. In this paper, we fo-cus on the bowed “main diagonal” in the CRP, because it is related to the frequencies and phases of the systems consid-ered.
4 The line of synchronization in the CRP
Regarding the conventional RP, Eq. (1), one always finds a main diagonal in the plot because the(i, i)-states are identi-cal. The RP can be considered as a special case of the CRP, Eq. (2), which usually does not have a main diagonal as the
(i, i)-states are not identical.
In data analysis one is often faced with time series that are measured on varying time scales. These could be sets from borehole or core data in geophysics or tree rings in dendrochronology. Sediment cores might have undergone a number of coring disturbances such as compression or stretching. Moreover, cores from different sites with differ-ing sedimentation rates would have different temporal
reso-Time in f
Time in
g
1 2 3 4 5 6
1 2 3 4 5 6
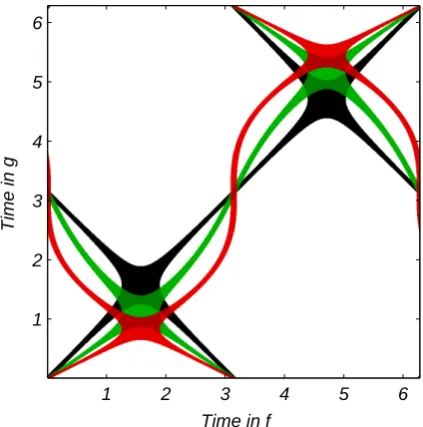
Fig. 1. Cross recurrence plots of sine functionsf (t )=sin(ϕt )and g(t )=sin(ϕt+asin(ψ t )), wherea=0 for the black CRP,a=0.5 for the green CRP anda=1 for the red CRP. The variation in the time domain leads to a deforming of the synchronization line.
lutions. All these factors require a method of synchroniza-tion.
A CRP of two corresponding time series will not contain a main diagonal. But, if the sets of data are similar, e.g. only rescaled, a more or less continuous line in the CRP that is like a distorted main diagonal can occur. This line contains infor-mation on the rescaling. We give an illustrative example. A CRP of a sine function with itself (i.e. this is the RP) contains a main diagonal (black CRP in Fig. 1). Hence, the CRPs in the Fig. 1 are computed with embeddings of dimension one; further diagonal lines from the upper left to the lower right occur. These lines typify the similarity of the phase space trajectories in positive and negative time direction.
Now we rescale the time axis of the second sine function in the following way
sin(ϕt )−→ sin ϕt+asin(ψ t ) (3)
We will henceforth use the notion rescaling only in the mention of the rescaling of the time scale. The rescaling of the second sine function, with different parametersϕ, results in a deformation of the main diagonal (green and red CRP in Fig. 1). The distorted line contains the information on the rescaling which we will need in order to re-synchronize the two time series. Therefore, we call this distorted diagonal the line of synchronization (LOS).
In the following, we present a toy function to explain the procedure. If we consider a one dimensional case without embedding, the CRP is computed with
Time in system f
Time in system g
10 20 30 40 50 60
10 20 30 40 50 60 70 80
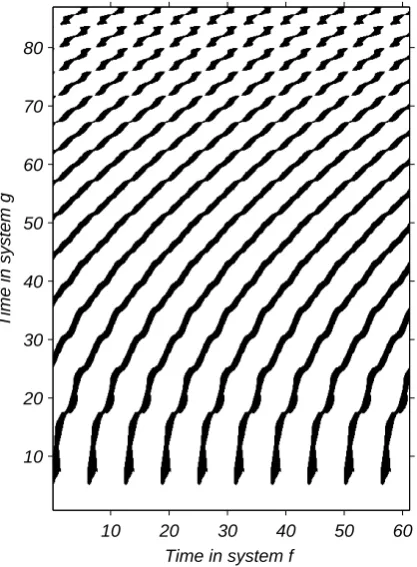
Fig. 2. Cross recurrence plots of two sine functionsf (t )=sin(ϕt ) andg(t ) = sin(ψ t2))which is the basis of the determination of the rescaling function between both data series. The embedding pa-rameters were dimensionm = 2, delayτ = π/2 and a varying thresholdε, in such a way that the CRP contains a constant recur-rence density of 20%.
If we setε = 0 to simplify the condition, Eq. (4) gives a recurrence point if
f (t1)=g(t2). (5)
In general, this is an implicit condition that links the variable
t1tot2. Considering physical examples of above, it can be assumed that the time series are essentially the same – this means thatf =g– up to a rescaling function of time. So we can state that
f (t1)=f φ (t1). (6)
If the functionsf (·)andg(·)are not identical, our method is, in general, not capable of deciding if the difference in the time series is due to different dynamics (f (·)6=g(·)) or if it is due to simple rescaling. So the assumption that the dynamics are alike up to a rescaling in time is essential, even though, for some cases wheref 6=g, it can be applied in the same way. If we consider the functionsf (·)=a· ¯f (·)+b
andg(·)= ¯g(·), wheref (·)6=g(·)are the observations and
¯
f (·)= ¯g(·)are the states, normalization with respect to the mean and the standard deviation allows us to use our method.
f (·)=a· ¯f (·)+b−→ ˜f (·)=f (·)− hf (·)i
σ (f (·)) (7)
˜
g(·)= g(·)− hg(·)i
σ (g(·)) (8)
0 20 40 60 80
0 10 20 30 40 50 60 70
Time t =
φ
( t‘ )
Time t‘
Rescaling Function
Fig. 3. The rescaling function (black) determined from the CRP
in Fig. 2. This has the expected parabolic shape of the squared coherence in the time domain. In red the square function.
Withg(¯ ·)= ¯f (·)the functionsf (˜·)andg(˜ ·)are the same af-ter the normalization. Then our method can be applied with-out any further modification.
In some special cases Eq. (6) can be resolved with respect tot1. Such a case is a system of two sine functions with different frequencies
f (t )=sin(ϕ·t+α) (9)
g(t )=sin(ψ·t+β) (10)
Using Eq. (5) and Eq. (6) we find
sin(ϕ t1+α)−sin(ψ t2+β)=0 (11) and one explicit solution of this equation is
⇒ t2=φ (t1)=
ϕ
ψt1+γ
(12) withγ = (α−β)/ψ. In this special case the slope of the main line in a cross recurrence plot represents the frequency ratio and the distance between the axes origin and the inter-section of the line of synchronization with the ordinate gives the phase difference. The functiont2 = φ (t1)(Eq. 6) is a transfer or rescaling function which allows us to rescale the second system to the first system. If the rescaling function is not linear the LOS will also be curved.
0 10 20 30 40 50 60 70 80 90 −1
0 1
Reference Data
Time t
f ( t )
0 10 20 30 40 50 60 70 80 90
−1 0 1
Rescaled Data
Time t
g (
φ
( t
‘ ) )
Fig. 4. Reference data series (upper panel) and rescaled data series
before (red) and after (black) using the rescaling function of Fig. 3 (lower panel).
to consider a phase space and so embedding is, in general, not justified here either (Romano, to be published; Takens, 1981).
The choice of a special embedding lag could be correct for one section of the data but incorrect for another (for an example see below). This can be the case if the data is non-stationary. Furthermore, the choice of method for computing the CRP and the thresholdεwill influence the quality of the estimated LOS.
The next sections will be dedicated to application.
5 Application to a simple example
First, we consider two sine functions, f (t ) = sin(ϕt ) and
g(t ) = sin(ψ t2), where the time scale of the second sine
differs from the first by a quadratic term and the frequency
ψ = 0.01ϕ. Sediment parameters are related to such kind of functions because gravity pressure increases nonlinearly with the depth. It can be assumed that both data series come from the same process and were subjected to different de-posital compressions (e.g. a squared or exponential increas-ing of the compression). Their CRP contains a bowed LOS (Fig. 2). We have used the embedding parameters dimension
m=2, delayτ =π/2 and a varying thresholdε, so that the CRP contains a constant recurrence density of 20%. Assum-ing that the time scale ofgis not the correct scale, we denote that scale byt00. In order to determine the non-parametrical LOS, we have implemented the algorithm described in the Appendix. Although this algorithm is still not mature, we ob-tained reliable results (Fig. 3). The resulting rescaling func-tion has the expected squared shapet = φ (t00) = 0.01t002
(red curve in Fig. 3). Substituting the time scalet00 in the second data seriesg(t00)by this rescaling functiont =φ (t00), we get a set of synchronized dataf (t )andg(t )with the non-parametric rescaling functiont =φ (t00)(Fig. 4). The syn-chronized data series are approximately the same. The cause of some differences is the meandering of the LOS which it-self is caused by partial weak embedding. Nevertheless, this
0 200 400 600 800 1000 1200 1400
0 50 100 150 200 250
ARM of Core PS 2180−2
Depth in Core PS 2180−2 [cm]
0 200 400 600 800 1000 1200 1400
0 50 100 150 200 250
ARM of Core PS 2178−3 before adjustment
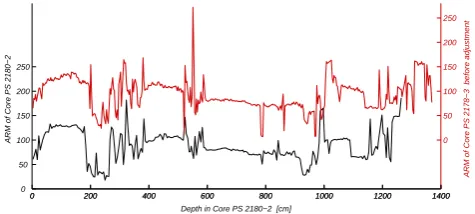
Fig. 5. ARM data of the boreholes PS 2178–3 GPC and PS 2180–
2 GPC in the Central Arctic Ocean before adjustment.
can be avoided by using a more complex algorithm for esti-mating the LOS.
6 Application to real data
In order to continue the illustration of the working of our method we have applied it to real data from geology.
In the following, we compare the method of cross recur-rence plot matching with the conventional method of visual wiggle matching (interactive adjustment). Geophysical data of two sediment cores from the Makarov Basin, central Arc-tic Ocean, PS 2178-3 and PS 2180–2, were analysed. The task should be to adjust the data of the PS 2178–3 data (data lengthN =436) to the scale of the PS 2180–2 (data length
N = 251) in order to get a depth-depth-function which al-lows us to synchronize both data sets (Fig. 5).
We have constructed the phase space with six normalized parameters, low field magnetic susceptibility (κLF),
anhys-teretic remanent magnetization (ARM), ratio of anhysteretic susceptibility to κLF (κARM/κLF), relative palaeointensity
(PJA), median destructive field of ARM (MDFARM) and
inclination (INC). A comprehensive discussion of the data is given in Nowaczyk et al. (2001). The embedding was combined with the time-delayed method according to Tak-ens (1981) in order to increase further the dimTak-ension of the phase space with the following rule: If we havenparameters
ai, the embedding with dimensionmand delayτ will result
in a (m·n)-dimensional phase space:
x(t )= a1(t ), . . . , an(t ),
a1(t+τ ), . . . , an(t+τ ),
a1(t+2τ ), . . . , an(t+2τ ), . . .
a1(t+(m−1)τ ), . . . , an(t+(m−1)τ (13)
For our investigation we have used a dimensionm = 3 and a delay τ = 1, which finally led to a phase space of dimension 18 (3×6). The recurrence criterion wasε=5% nearest neighbours.
Depth in Core PS 2178−3 [cm]
Depth in Core PS 2180−2 [cm]
0 200 400 600 800 1000 1200 1400 0
200
400
600
800
1000
1200
Fig. 6. Cross recurrence plot based on six normalized sed-iment parameters and an additional embedding dimension of m=3(τ=1,ε=0.05).
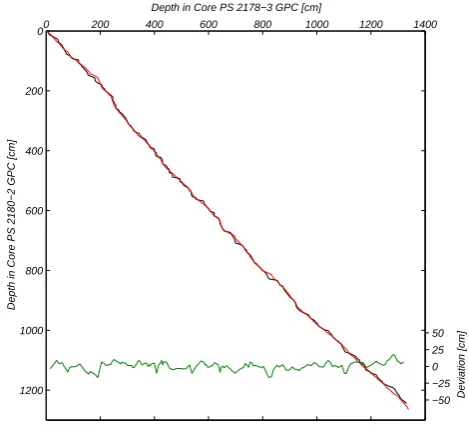
function (the depth-depth-curve) to the LOS in the CRP (red curve in Fig. 6). With this function we are able to adjust the data of the PS 2178–3 core to the scale of PS 2180–2 (Fig. 8). The determination of the depth-depth-function with the conventional method of visual wiggle matching is based on interactive and parallel searching for the same structures in the different parameters of both data sets. If the adjustment does not work in a section of the one parameter, one can use another parameter for this section which allows the multi-variate adjustment of the data sets. The recognition of the same structures in the data sets requires a degree of experi-ence. However, human eyes are usually better in the visual assessment of complex structures than a computational algo-rithm.
Our depth-depth-curve differs slightly from the curve which was gained by the visual wiggle matching (Fig. 7). However, despite our (still) weak algorithm used to fit the non-parametric adjustment function to the LOS, we obtained a good result of adjusted data series. If they are well adjusted, the correlation coefficient between the parameters of the ad-justed data and the reference data should not vary so much. The correlation coefficients between the reference and ad-justed data series is about 0.70 – 0.80, where the correlation coefficients of the interactive rescaled data varies from 0.71 – 0.87 (Table 1). The χ2 measure of the correlation coef-ficients emphasizes more variation for the wiggle matching than for the CRP rescaling.
7 Discussion
Cross recurrence plots (CRP) reveal similarities in the states of the two systems. A similar trajectory evolution gives a diagonal structure in the CRP. An additional time dilatation
0 200 400 600 800 1000 1200 1400 0
200
400
600
800
1000
1200
Depth in Core PS 2180−2 GPC [cm]
Depth in Core PS 2178−3 GPC [cm]
−50 −25 0 25 50
Deviation [cm]
Fig. 7. Depth-depth-curves. In black, the curve gained with the
CRP; in red the manually matching result. The green curve shows the deviation between both results.
or compression of one of these similar trajectories causes a distortion of this diagonal structure (Fig. 1). This effect is used to look into the synchronization between both sys-tems. Synchronized systems have diagonal structures along and in the direction of the main diagonal in the CRP. Inter-ruptions of these structures with gaps are possible because of variations in the amplitudes of both systems. However, a loss of synchronization is viewable by the distortion of this structures along the main diagonal (LOS). Fitting a non-parametric function to the LOS allows us to re-synchronize or adjust both systems on the same time scale. Although this method is based on principles from deterministic dynam-ics, no assumptions about the underlying systems have to be made in order for the method to work.
The first example shows the obvious relationship between the LOS and the time domains of the considered time series. The increasing frequency squared of the second harmonic function causes a parabolic LOS shape in the CRP (Fig. 2). Finally, with this LOS we are able to rescale the second func-tion to the scale of the first harmonic funcfunc-tion (Fig. 4). Some differences in the amplitude of the result are caused by the algorithm used in order to extract the LOS from the CRP. However, our concern is to focus on the distorted main diag-onal and its relationship with the time domains.
Table 1. Correlation coefficients%1,2between adjusted data and reference data and theirχ2deviation. The correlation of the inter-active adjusted data varies more than the automatic adjusted data. The data length isN =170 (wiggle matching) andN=250 (CRP matching). The difference between both correlation coefficients%1 and%2is significant at a 99% significance level when the test mea-sureˆzis greater thanz0.01=2.576
Parameter %1, wiggle matching %2, CRP matching zˆ
ARM 0.8667 0.7846 6.032
MDFARM 0.8566 0.7902 4.791
κLF 0.7335 0.7826 2.661
κARM/κLF 0.8141 0.8049 0.614
PJA 0.7142 0.6995 0.675
INC 0.7627 0.7966 1.990
χ2 141.4 49.1
However, the correlation coefficients for the CRP adjusted data are smaller than these for the wiggle matched data. Al-though their correlation is better, it seems that the interactive method does not produce a balanced adjusting whereas the automatic matching looks for a better balanced adjusting.
These two examples exhibit the ability to work with smooth and non-smooth data whereby the result will be bet-ter for smooth data. Small fluctuations in the non-smooth data can be handled by the LOS searching algorithm. There-fore, smoothing strategies, like smoothing or parametrical fit of the LOS, are not necessary. The latter would damp one advantage of this method, that the LOS is yielded as a non-parametrical function. A future task will be the optimization of the LOS searching algorithm in order to get a clear LOS even if the data are non-smooth. Further, the influence of dynamical noise to the result will be studied. Probably, this problem may be bypassed by a suitable LOS searching algo-rithm too.
Our method has conspicuous similarities with the method of sequence slotting described by Thompson and Clark (1989). The first step in their method is the calculation of a distance matrix, similar to our Eq. (2), which allows the use of multivariate data sets. Thompson and Clark (1989) referred to the distance measure as dissimilarity; this is used to determine the alignment function in such a way that the sum of the dissimilarities along a path in the distance ma-trix is minimized. This approach is based on dynamic pro-gramming methods which were mainly developed for speech pattern recognition in the 70’s (e.g. Sakoe and Chiba, 1978). In contrast, RPs were developed to visualize the phase space behaviour of dynamical systems. Therefore, a threshold was introduced to make recurrent states visible. Involvement of a fixed amount of nearest neighbours in phase space and the possibility to increase the embedding dimensions distinguish this approach from the sequence slotting method.
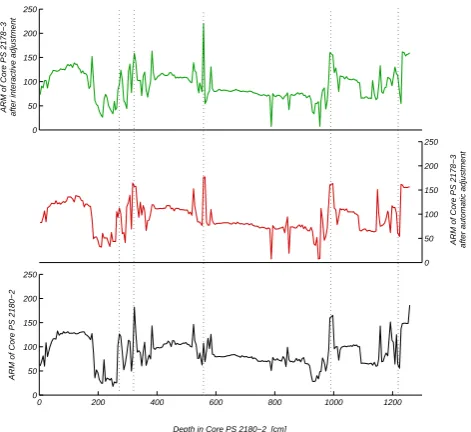
0 50 100 150 200 250
ARM of Core PS 2178−3 after interactive adjustment
0 50 100 150 200 250
ARM of Core PS 2178−3 after automatic adjustment
0 200 400 600 800 1000 1200
0 50 100 150 200 250
ARM of Core PS 2180−2
Depth in Core PS 2180−2 [cm]
Fig. 8. ARM data after adjustment by wiggle matching (top) and by
automatic adjustment using the LOS from Fig. 6. The bottom figure shows the reference data.
8 Conclusion
The cross recurrence plot (CRP) can contain information about the synchronization of data series. This is revealed by the distorted main diagonal which is called line of syn-chronization (LOS). After isolating this LOS from the CRP one obtains a non-parametric rescaling function. With this function one can synchronize the time series. The underly-ing more-dimensional phase space allows us to include more than one parameter in this synchronization method as it usu-ally appears in geological applications, e.g. core synchro-nization. The comparison of CRP adjusted geophysical core data with conventional visual matching shows an acceptable reliability level of the new method which can be further im-proved by a better method for estimating the LOS. The ad-vantage is the automatic, objective and multivariate adjust-ment. Finally, this method of CRPs can open a wide range of applications as scale adjustment, phase synchronization and pattern recognition, for instance in geology, molecular biol-ogy and ecolbiol-ogy.
Appendix: An algorithm to fit the LOS
In order to implement a recognition of the LOS we have used the following simple two-step algorithm. Denote all recur-rence points byriα˜,jβ˜ (α,˜ β˜ = 1,2, . . .) and the recurrence
points lying on the LOS by riα,jβ (α, β = 1,2, . . .).
Be-fore the common algorithm starts, find the recurrence point
ri1,j1 next to the axes origin. In the first step, the next re-currence pointriα˜,jβ˜, after a previous determined recurrence
pointriα,jβ, is to be determined. This is carried out by a
20 30 40
MDF
ARM
100 200 300 400
κLF
0 10 20 30
κARM
/
κLF
0 2 4
PJA
20 30 40
MDF_{{ARM}
0 100 200 300 400
κLF
0 10 20 30
κARM
/
κLF
0 2 4
PJA
0 200 400 600 800 1000 1200
−100 −50 0 50 100
INC
Depth in Core PS 2180−2 [cm]
0 200 400 600 800 1000 1200
−100 −50 0 50 100
INC
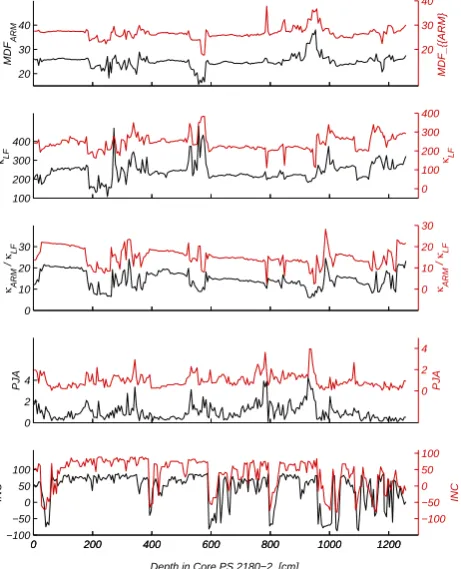
Fig. 9. The adjusted marine sediment parameters. The construction
of the CRP was done with the normalized parameters. In these plots we show the parameters, which are not normalized.
previous recurrence point is at the(1,1)-location. The size
wof this sub-matrix increases step-wise until it meets a new recurrence point or the margin of the CRP. When the next recurrence pointriα˜,jβ˜ =riα+δi,jβ+δj (δi=worδj =w) in
thex-direction (y-direction) is found, the second step looks to see if there are following recurrence points iny-direction (x-direction). If this is true (e.g. there are a cluster of recur-rence points) increase further the sub-matrix iny-direction (x-direction) until a predefined size (w+dx)˜ ×(w+dy)˜
(dx < dx, d˜ y < dy˜ ) or until no new recurrence points
are met. This further increasing of the sub-matrix is done for the both x- and y-direction. Using dx, d˜ y˜ we com-pute the next recurrence pointriα+1,jβ+1 by determination of the center of mass of the cluster of recurrence points with
iα+1 = iα +(dx˜+δi)/2 andjβ+1 = jβ +(dy˜ +δj )/2.
The latter avoids the fact that the algorithm is driven around widespread areas of recurrence points. Instead of this, the algorithm locates the LOS within these areas. (However, the introducing two additional parametersdxanddy is a disad-vantage which should be avoided in further improvements of this algorithm.) The next step is to set the recurrence point
riα+1,jβ+1 to a new start point and to begin with the step one in order to find the next recurrence point. These steps are
repeated until the end of the RP is reached.
We know that this algorithm is merely one of many possi-bilities. The following criteria should be met in order to ob-tain a good LOS. The number of targeted recurrence points by the LOSN1should converge to a maximum and the num-ber of gaps in the LOSN0should converge to a minimum. An analysis with various estimated LOS confirms this re-quirement. The correlation between two LOS-synchronized data series arises withN1and with 1/N0(the correlation co-efficient correlates most strongly with the ratioN1/N0).
The algorithm for computation of the CRP and recog-nition of the LOS are available as Matlab programmes on http://www.agnld.uni-potsdam.de/~marwan.
Acknowledgements. The authors thank J. Kurths and U. Schwarz for continuing support and discussion. This work was supported by the special research programme 1097 of the German Science Foundation (DFG).
References
Argyris, J. H., Faust, G., and Haase, M.: An Exploration of Chaos, North Holland, Amsterdam, 1994.
Casdagli, M. C.: Recurrence plots revisited, Physica D, 108, 12–44, 1997.
Eckmann, J.-P., Kamphorst, S. O., and Ruelle, D.: Recurrence Plots of Dynamical Systems, Europhysics Letters, 5, 973–977, 1987. Kantz, H. and Schreiber, T.: Nonlinear Time Series Analysis,
Uni-versity Press, Cambridge, 1997.
Martinson, D. G., Menke, W., and Stoffa, P.: An Inverse Approach to Signal Correlation, J. Geophys. Res. B6, 87, 4807–4818, 1982. Nowaczyk, N. R., Frederichs, T. W., Kassens, H., Nørgaard-Pedersen, N., Spielhagen, R. F., Stein, R., and Weiel, D.: Sed-imentation rates in the Makarov Basin, Central Arctic Ocean – A paleo- and rock magnetic approach, Paleoceanography, 2001. Prell, W. L., Imbrie, J., Martinson, D. G., Morley, J. J., Pisias, N. G.,
Shackleton, N. J., and Streeter, H. F.: Graphic Correlation of Oxygen Isotope Stratigraphy Application to the Late Quaternary, Paleoceanography, 1, 137–162, 1986.
Romano, M. C.: The Dark Side of Embedding, to be published. Sakoe, H. and Chiba, S.: Dynamic programming algorithm
opti-mization for spoken word recognition, IEEE Trans. Acoustics, Speech, and Signal Proc., 26, 43–49, 1978.
Takens, F.: Detecting Strange Attractors in Turbulence, pp. 366– 381, Springer, Berlin, 1981.
Thompson, R. and Clark, R. M.: Sequence slotting for stratigraphic correlation between cores: theory and practice, J. Paleolimnol-ogy, 2, 173–184, 1989.
Webber, Jr., C. L. and Zbilut, J. P.: Dynamical assessment of physi-ological systems and states using recurrence plot strategies, Jour-nal of Applied Physiology, 76, 965–973, 1994.