Ocean Sci., 5, 1–12, 2009 www.ocean-sci.net/5/1/2009/
© Author(s) 2009. This work is distributed under the Creative Commons Attribution 3.0 License.
Ocean Science
The structure of the Persian Gulf outflow subjected to
density variations
A. A. Bidokhti1and M. Ezam2
1Institute of Geophysics, University of Tehran, P.O. Box 14155-6466, Tehran, Iran
2Faculty of Marine Science and Technology, Science and Research Campus, IAU, P.O. Box 14155-775, Tehran, Iran Received: 10 March 2008 – Published in Ocean Sci. Discuss.: 22 May 2008
Revised: 27 October 2008 – Accepted: 5 December 2008 – Published: 12 January 2009
Abstract. Oceanographic data and a dynamic model are
used to consider the structure of Persian Gulf outflow. This outflow influences the physical properties of Oman seawater which appear in the CTD profiles of the Oman Sea. The observations show that thickness of the outflow, which is banked against the Oman coasts due to the earth rotation, is about 200 m with tongues extending east and north that may be due to the internal waves. A simple dynamical model of the outflow based on potential vorticity conservation is used to find the horizontal extension of the outflow from the coast. Typical mass transport estimate by the outflow is about 0.4 Sv, which is larger than those reported by others. This may be due to the fact the model is inviscid but the outflow is influenced by the bottom friction. Variability of the outflow structure may reflect the changing ecosystem of the Persian Gulf. Any change of the outflow source, the Persian Gulf Water (PGW), say salinity increase due to excessive evap-oration (climate factor) or desalination (anthropogenic fac-tors) of the PGW may change the outflow structure and the product waters in the Oman Sea. Hence, one can test dif-ferent scenarios of changing the outflow source, the Persian Gulf Water (PGW), say by salinity increase due to excessive evaporation or desalination to estimate changes in the out-flow structure and the product waters in the Oman Sea. The results of the model show that these can increase the outflow width and mass transport substantially.
Correspondence to: A. A. Bidokhti ([email protected])
1 Introduction
Persian Gulf outflow (PGO) is as a result of saline water from the Gulf due to excessive evaporation of about 1.5 to 2 m/yr (e.g. Privett, 1959; Reynolds, 1992; Bower et al., 2000). Dense flow interring the Oman Sea through the shallow Strait of Hormuz has a volume flux of about 0.2 to 0.3 Sv without substantial seasonal variations (Bower et al., 2000). Typi-cal salinity of the outflow water before cascading down into the Oman Gulf is about 40 psu. The mean outflow depth in the Oman Sea is about 275 m (Qasim, 1982; Bower et al., 2000). A good review and a bulk hydraulic model for the Persian Gulf and Red sea outflows are given in Bower et al. (2000). They also found that the outflow product wa-ter from the Persian Gulf is highly diluted (by a factor of 4) due to strong mixing as its initial density difference with the ambient waters is large, leading to strong flow and hence more entrainment. They also found that the depth of the outflow near the Strait of Hormuz does not change during the year. The outflow appears to be a boundary current for a certain time of the year and breaks apart in other times due to environmental forcing in the Oman Sea especially in winter. Swift et al. (2003) have also presented a review of the outflow data and its characteristics in different seasons. They showed that the outflow water originates in winter at the northern end of the Gulf rather than along the southern and western coasts. They also used hydrographic data (T-S characteristic) to investigate movements and transformations of water masses within the Gulf and the exchange with the Indian Ocean. Bidokhti (2005) has analyzed the small scale layering of the outflow and attributed the thick layers to inter-nal waves induced by the outflow, using results of laboratory experiments.
2 A. A. Bidokhti and M. Ezam: Persian Gulf outflow
0
+ 2
+ 2
0 + 2+ 2
Fig. 1. (a) Map of Persian Gulf and Gulf of Oman. (b) Expanded
view of eastern end of the Persian Gulf, Strait of Hormuz and Gulf of Oman (area exhibited by box in Fig. 1a), the locations of CTD measurements in winter and summer, the geographic position of transects and the bottom topography.
as the Gulf water is prone to oil pollution, it will change the ecosystem of these waters. Hence the dynamical behavior of the outflow subjected to variations of source water, due to many factors such as long term climatic changes and large scale desalination activities is needed to be investigated.
In this paper we first analyze some hydrographic data of the outflow to find the structural variations of the outflow be-tween two seasons (winter and summer). We also consider some characteristics of the outflow such as fine structures due to processes such as double diffusive convection and shear layers that may be formed by internal waves. Then we use a simple dynamical model to calculate the outflow charac-teristics such as outflow width as well as its Rossby radius of deformation while giving some comments on the appli-cations of such investigations. This model is not intended for detail study of the outflow as observations may show, but for estimating average properties of the outflow under steady states with different source water conditions.
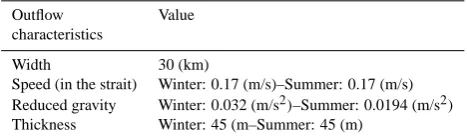
Table 1. The outflow and surrounding waters characteristics.
Outflow Value characteristics
Width 30 (km)
Speed (in the strait) Winter: 0.17 (m/s)–Summer: 0.17 (m/s) Reduced gravity Winter: 0.032 (m/s2)–Summer: 0.0194 (m/s2) Thickness Winter: 45 (m–Summer: 45 (m)
2 Persian Gulf outflow parameters
The PGO plume intrudes into the Oman Gulf water as a baro-clinic trapped boundary current that can be investigated by field measurements. A map of the Strait of Hormuz and Gulf of Oman is shown in Fig. 1, indicating the bottom topogra-phy and the positions of transects for CTD measurements in winter and summer. The CTD data are obtained form the ROPME expedition of 1992 (Reynolds, 1993).
Table 1 also shows the main parameters of the outflow for the Persian Gulf (mainly taken from Bower, et al., 2000).
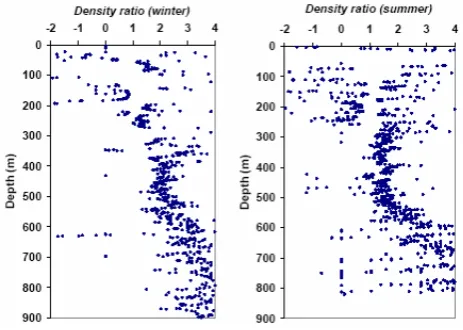
Figure 2a shows typical vertical profiles of T, S and sigma-T for nearly the same locations in winter and summer well in to the Oman Sea (see stationsS1andS2in Fig. 1b), which show the outflow layer. The mid-depth of the outflow in the Oman Gulf is at about 250 m. The density ratio for stratified ocean due toT andSis defined as:
Rρ = α∂T
∂z
β∂s∂z (1)
whereαandβ, are the coefficients of density change due to temperature (T) and salinity (S) variations respectively, and the gradients are local vertical gradients.
The density ratio (or stability ratio) forRρ>1 is salt finger favorable; 0<Rρ<1 is favorable to thermohaline convective layering of the diffusive type;Rρ=0 implies a uniform tem-perature (probably a result of convection within a layer) and Rρ<0 implies stable gradient of bothT andS. The profiles forT andS indicate that double diffusion (DD) processes above (layer regime) and near the bottom of the outflow (fin-ger regime) are dominant (Fig. 2b).
The density ratio for typical profiles ofT andS, often ap-pears to be between one and two in the outflow (about 200– 500 m), indicating that DD convection leads to fine layer of order of 10–20 m (Fig. 2b), however thicker layer (typi-cally 50 m), as observed in Fig. 2a, are believed to be due to modal vertical velocity structure of internal waves (Bidokhti, 2005). Although careful field observations including veloc-ity profiles measurements are needed to substantiate them in the outflow more vigorously.
The main aims of our work are interpretations and discus-sions of the structure of the outflow before, in and after the Strait of Hormuz usingT andS contour plots, which have been made from CTD data for winter and summer (1992).
A. A. Bidokhti and M. Ezam: Persian Gulf outflow 3
0
+ 2
+ 2
Fig. 2a. Salinity and temperature profiles of the outflow in Oman
Sea for winter and summer (see stationS1andS2in Fig. 1).
Then we use a diagnostic dynamic model to estimate some outflow parameters in the Oman Sea, near the Strait of Hor-muz.
3 A model for steady inviscid outflow
As the outflow enters the Gulf of Oman it adjusts into an internal geostrophic flow trapped against the coastal bottom boundary. With the assumption that the flow is adjusted geostrophiclly and the potential vorticity is conserved, the velocity component normal to the coast (inxdirection,u) is negligible. Hence,∂u
∂y in vorticity equation is zero and the only parameter dependent onxis the depth of the isopy-cnal surfaces (h), that generate cross stream pressure gradi-ent normal to the coast, which is balanced against Coriolis force. However,ucomponent of the outflow may not be zero as other factors which are not considered in the model may generate it. In this case the width of the current and the inter-face height difference across it are functions of the reduced gravity and Coriolis parameter. Within our assumptions, we pose the problem simple, only to find some gross features of the outflow. Hence we have (Gill, 1982):
ξ+f
h =const (2)
Hereζ is the relative vorticity,his the upper layer thickness andf is the Coriolis parameter.
+ 2 )
+ 2 >
Fig. 2b. Vertical profiles of density ratio for winter and summer in
Oman Sea corresponding to Fig. 2a.
We have a geostrophic balanced flow along the coast with horizontal gradient of isopycnal surfaces normal to the coast, thus:
f v=g0∂h
∂x (3)
Wherev is the baroclinical geostrophic velocity of the out-flow along the coast,g0is the reduced gravity andxis defined as an offshore distance normal to the coast (Fig. 3).
From Eq. (3) we can write the relative vorticity for the outflow as:
ζ = ∂v ∂x =
g0 f
∂2h
∂x2 (4)
Substituting Eq. (4) in Eq. (2) and using these assumptions that, near the coast(x=0)the relative vorticity is small com-pared to local Coriolis parameter f0 and the upper layer depth is constant and equals toh0, we will obtain:
d2h dx2 =α
2h−f2
g0 (5)
where α2= ff0
g0h0 (6)
Solving the differential Eq. (5) yields
h=Aeα x+Be−α x+c (7)
WhereAandBare constants andc=(ff
0)h0.
Due to the fact that at the near shore boundary(x=0)the flow vanishes, thereforexderivative ofhis negligible. Using this boundary condition gives:
A=B (8)
Substituting Eq. (8) in Eq. (7) and calculating h values at (x=0)and(x=R), we have:
4 A. A. Bidokhti and M. Ezam: Persian Gulf outflow
+ 2 )
+ 2 >
Fig. 3. The parameters of the outflow model, a typical isopycnal is
shown and the flow is out of the paper.
hR=A(eα R+e−α R)+c (10)
Whereh1 andhR are thehvalues at(x=0)and(x=R) re-spectively. Since the outflow starts just as the isopycnal sur-face starts dipping, we have the edge of the outflow atx=0 ash=h1and forx<0h=h0.
Combining Eqs. (9) and (10) and eliminatingAyields: R= 1
αcosh
−1(hR−c h1−c
) (11)
The parameterRcan be named as the outflow width. By knowing h1 and hR we can also estimate the mass transport as:
M= g
0
2f(h 2
R−h21) (12)
The parameters of the outflow relative to the coast are shown in Fig. 3 (outflow direction is normal and out of the page).
Before using this model to estimate the outflow parameters as it enters the Gulf of Oman, we first review some of the Persian Gulf outflow characteristics based on hydrographic data.
4 Results and discussion
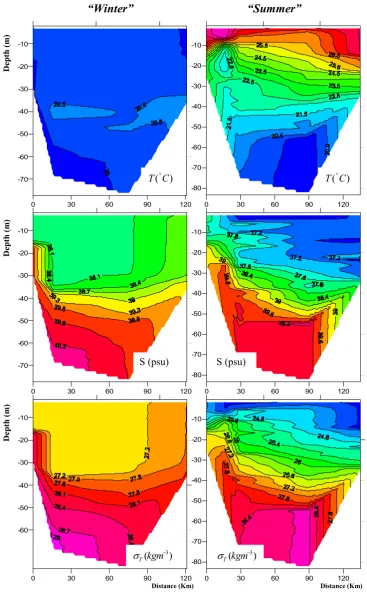
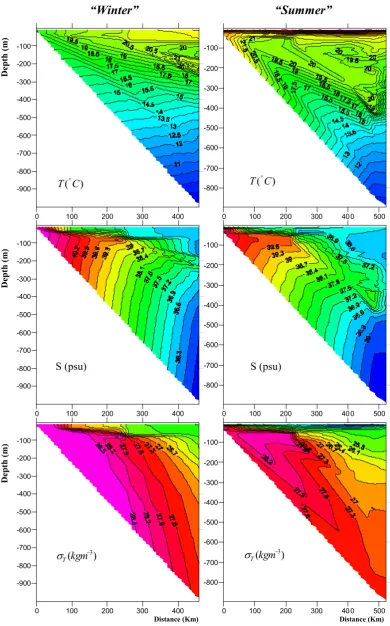
In order to consider the internal fields of temperature, salin-ity and sigma-T of the water around Strait of Hormuz, cross-sections of these parameters are estimated using the ROPME data of 1992. Figure 4, for example, shows the cross-sections ofT,Sand sigma-T across the path B in south-north direc-tion for winter and early summer. They indicate that in win-ter (the left plots), the upper part is mainly mixed (no struc-ture), but the deep water, which tends to be trapped against the southern coast of the Gulf, is highly stratified. The dense water near the bottom is the layer driven by buoyancy out of the Gulf. Similar patterns are also seen for cross-sections D and E (in winter), the upper layer seems to have no structure
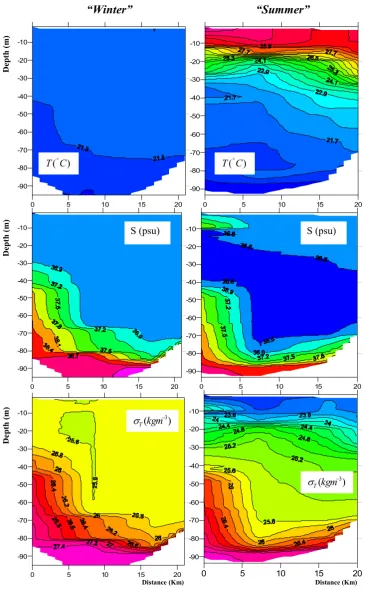
(relatively mixed) as shown in Figs. 5 and 6 (transect D is in south-north and transect E is in west-east direction). Near the Strait of Hormuz (transect D and E), the deep stratified layer is rather shallow with sloping boundary near the south-ern and westsouth-ern coasts. The tendency of the bottom layer towards the western coasts in transect E is due to Coriolis, as it tends to move the outflow from the Gulf towards the right. If we use the slope of sigma-T contours near the western bank, we could use the geostrophic balancev=g0
f ∂h ∂x to find v, the geostrophic velocity of the outflow. Typical mean val-ues ofg0∼0.01 m/s2, f∼10−4s−1 and∂h
∂x∼0.002 give v∼0.2 m/s, which is similar to the observed values of the out-flow velocity near the Strait of Hormuz (e.g. Reynolds, 1992; Bower, 2002). The Rossby number,Ro=v
f w, based on these values and the width of the outflow,w∼20 km, is about 0.1 which is much smaller than 1, hence geostophic approx-imation is justified.
As the outflow enters into the open sea in the Gulf of Oman it sinks and forms a warm salty water intrusion (sectionF andF0in the south-west north-east direction of Fig. 7). The mean depth of the outflow is at about 250 m with the outflow between 200 and 500 m, especially for summer. Figure 7 (transectF andF0), also shows that the outflow tends to flow near the western coast (left hand in plots), however, in winter it appears to be broken by other mechanisms such as advec-tion of the surface eddies which may be partly due to the out-flow but mainly due to wind driven out-flows and bottom topog-raphy near the coastal areas that can induce vorticity resulted from the change of water depth (vortex stretching mecha-nism). Advective flow in the surface layer are mainly due to meso-scale surface eddies and wind driven ocean currents (Swift and Bower, 2003). However, further investigation of these complex processes require more detailed repeated mea-surements in Oman Sea waters.
It should be pointed out that near the coastal area mixing may be higher and also the data resolution is not good enough to give a representative picture of the parameter fields. How-ever on the whole, the parameter fields indicate a dense out-flow into the open sea rather vividly.
A. A. Bidokhti and M. Ezam: Persian Gulf outflow 5
' ( ) ' ( )
+ 2 $ <
; ; <
1 ; < 1 ; <
<
; > ; ><
'
(
)
'
(
)
'
(
)
6 A. A. Bidokhti and M. Ezam: Persian Gulf outflow
>
' ( ) ' ( )
+ 2 % <
; ; <
< ; >
< ; >
1 ; < 1 ; <
'
(
)
'
(
)
'
(
)
A. A. Bidokhti and M. Ezam: Persian Gulf outflow 7
$
' ( ) ' ( )
+ 2 ' <
; ; <
< ; >
< ; >
1 ; < 1 ; <
'
(
)
'
(
)
'
(
)
8 A. A. Bidokhti and M. Ezam: Persian Gulf outflow
%
' ( ) ' ( )
+ 2 5 <
; ; <
< ; >
< ; >
1 ; < 1 ; <
'
(
)
'
(
)
'
(
)
A. A. Bidokhti and M. Ezam: Persian Gulf outflow 9 interesting feature observed in theT andSfields are the
fold-ing in their contours, that are also observed in theT andS profiles (Fig. 3a,b). The folding is probably generated by the internal wave activities exited by outflow plumes through the Strait of Hormuz. Plumes moving into stratified fluid have shown to produce internal waves of which their baroclinic modes may lead to such folding structures (Bidokhti, 2005; Wong et al., 2000; Griffiths and Bidokhti, 2008). The modal structure of the internal wave generates shear layers leading to counter-flowing layers that may produce these thicker lay-ers with typical scales of 50 to 100 m (Fig. 2a). The interpo-lation error of data may also have enhanced the folding ap-pearance of the contours that are usually seen in such plots. We used the triangulation method for data interpolation by the SURFER software that seemed to work better than the other methods.
The outflow structure in the open sea, Fig. 7 (transectF andF0), for summer again shows a strong core, which is thicker during the summer than winter. The core of the out-flow is again banked against western coast with a strong iden-tity. This may indicate that the outflow in summer is stronger or the activity of the surface eddies in summer time is less, so that they cannot tear apart the outflow by advective dis-persion near the surface (Swift and Bower, 2003).
For the outflow near the Strait of Hormuz (e.g. transect E, Fig. 6), we may use the inviscid steady state model for the outflow adjustment and estimate some of the dynamical parameters of the outflow. It should be pointed out that the section at which we apply our model is near the Strait of Hor-muz where the outflow is more energetic and double diffusive processes are not probably important. Table 2 shows estima-tions of the outflow parameters using the dynamical model including outflow width and mass transport (Eqs. 11 and 12) for winter and summer for transect E. The observed widths of the outflow are also shown for comparison. The model gives larger values for outflow mass transport than those reported by Bower et al. (2000). However, as pointed out by Bower et al. (2000), the entraiment at the top of the outflow boundary can dilute the outflow (by a factor of 4) and hence, change the size of the outflow as it enters the Oman Sea and we have also set the model for the outflow just as it enters the Oman Sea. Also, the model is non-viscous but the bottom friction around the neck of Strait of Hormuz may have a strong effect on the outflow mass transport. Pous et al. (2004), have also shown that the mass transport from the Gulf shows strong variabil-ity which may be related to the complex processes governing the water exchange in the Strait of Hormuz. The two last rows of the Table 2 are scenarios for cases with saltier and less salty (increasing or decreasing reduced gravity of source waters) outflows. In these scenarios it is assumed that the outflow thickness to be constant and only the reduced grav-ity changes due to salingrav-ity variations.
Larger salinity of the PGW can increase the mass transport of the outflow according to this model (excluding
entrain-ment and friction); hence flushing time of the PGW can be '
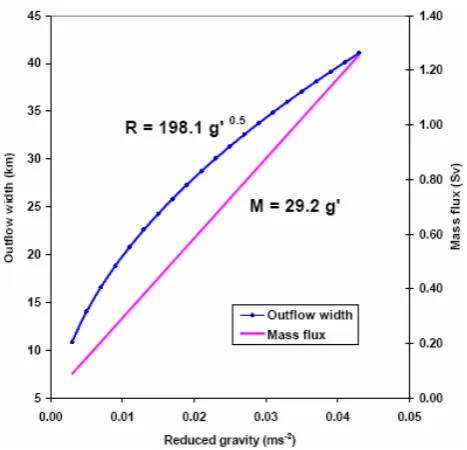
+ 2 /
Fig. 8. The outflow width (R) and mass transport (flux) (M) for var-ious values of reduced gravity (g0), with a typical value of constant depth 30 m (h1=45 m,hR=75 m).
reduced. It may also be argued that as the outflow with strong reduced gravity source, accelerates down at the throat of the Strait of Hormuz, it is diluted as a result of entrainment, be-fore adjusting to the steady condition in the Oman Sea for which we have presented this simple dynamical model. Dif-fusive convection may also contribute to the entrainment at the top boundary of the outflow that requires further insight. Figure 8 shows variations of width and mass transport of the outflow for typical values ofh1andhRbased on the dy-namical model. It shows that mass transport increases lin-early with reduced gravity, ifh1 andhR are held constant, but the width of the outflow varies with square root of re-duced gravity, which is consistent with the Rossby radius of deformation of the outflow.
We find that the outflow which dips down the slope of the bottom is saline and rather warm and intrudes into the open sea, roughly, as an isopycnal internal flow with a mid-depth at about 250 m. The step structures in the contours are ob-served particularly near the Strait of Hormuz (Figs. 5 and 6) that may be due the way interpolation is carried out. The yz (along shore) contours for the main path of the outflow in winter and summer are shown in Fig. 9, which are nearly par-allel to the south-western coasts. The flow is mainly isopyc-nal. However, the outflow structure is non-homogenous with core of the outflow being broken apart by advective shear-ing in horizontal due to eddies in the Oman Sea especially in winter period. Higher resolution measurements of the out-flow are required to find out more about these processes.
10 A. A. Bidokhti and M. Ezam: Persian Gulf outflow
' ( ) ' ( )
+ 2 .
<
;
;
<
1 ;
<
1 ;
<
<
;
>;
><
'
(
)
'
(
)
'
(
)
A. A. Bidokhti and M. Ezam: Persian Gulf outflow 11
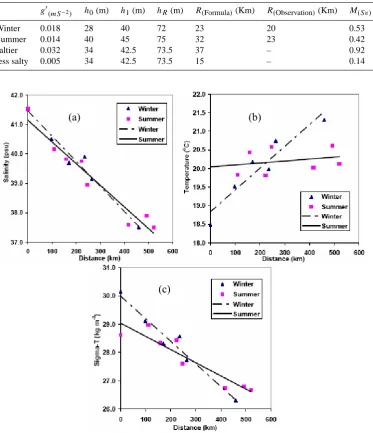
Table 2. Outflow parameters, model and observations.
g0(mS−2) h0(m) h1(m) hR(m) R(Formula)(Km) R(Observation)(Km) M(Sv)
Winter 0.018 28 40 72 23 20 0.53
Summer 0.014 40 45 75 32 23 0.42
saltier 0.032 34 42.5 73.5 37 – 0.92
less salty 0.005 34 42.5 73.5 15 – 0.14
/
+ 2 0
; <
;)<
; <
Fig. 10. (a) Salinity, (b) temperature and (c) sigma-T variations of the outflow along the axis of strait to the open sea for winter and summer.
The rate of dilutions of the outflow can be inferred from the salinity change asShas less molecular diffusivity. This figure shows that the dilution rate for salinity appears to be about the same for winter and summer. However, winter di-lution rate is slightly larger, that is consistent with larger out-flow in winter (Table 2) and larger Reynolds number indicat-ing more mixindicat-ing.
The outflow appears to have nearly a uniform tempera-ture in summer (about 20◦C), but its temperature increases in winter as it enters into the open sea (form ∼18.5 to ∼21.5◦C).
5 Concluding remarks
Some hydrographic data for the exchange flow from the Per-sian Gulf was used to look at the outflow structure in the Strait of Hormuz and at the head of Oman Sea. Temperature, salinity and sigma-T fields were analyzed for summer and winter, indicating that in summer the upper layer is highly stratified, and the dense saline outflow layer enters the Oman sea, unimpeded and appears as a coastal trapped layer intact, due to less mixing as a result of stronger stratification near the top layer. However in winter the upper layer entering the Gulf is highly mixed with some temperature inversion
12 A. A. Bidokhti and M. Ezam: Persian Gulf outflow around the Strait of Hormuz. The outflow entering the Oman
Sea is intact at first, but it seems to be disintegrated further into the open sea due to meso-scale eddies and weaker stable stratifications near the surface.
The outflow, just as it enters the Oman Sea is a coastal trapped internal gravity current that may be considered as a geostrophic adjusted steady flow which we have simulated by an analytical simple non-viscous model based on potential vorticity conservation. The model assumes zero entrainment between the outflow and the ambient waters, however we be-lieved that prior to this state, in the Strait of Hormuz, some entrainment due to turbulence and also double diffusive con-vection, between the outflow and ambient water, especially at the upper boundary, enhances its size. The bottom friction which is not included in the model may also be important. This is reflected in the model prediction of the outflow mass transport which is larger than those reported by the others.
The outflow from a semi-enclosed sea as the Persian Gulf carries the saline water from the semi-enclosed seas into the open ocean. Any change of these water bodies could also lead to the change of open seas as the Oman Sea in this case. Year to year variation of the outflow also reflects the vari-ability of these semi-enclosed seawater environments such as climatic variations, extensive human industrialization around the Persian Gulf that requires meticulous planning and coop-eration among surrounding states.
A few important issues surround the ecosystem of the Per-sian Gulf and its outflow to the open sea. One is that the environment of the Persian Gulf has become an important area for oil and gas exploration and marine transport. Any catastrophic event as the Gulf war could change the ecosys-tem and the species of marine animals and coral reefs. The outflow essentially ventilates the Gulf water. This is impor-tant in removing and transporting the marine pollution into the Oman Sea. However the ecosystem of the Oman Sea may be changed as the result of the polluted outflow (e.g. the outflow depth and width may change). Another issue is that if the salinity of the Persian Gulf changes by the mentioned factors, the outflow may increase and more and more areas of the open seas even to the Indian Ocean may be influenced by the outflow.
By using the dynamical model for the outflow (e.g. tran-sect E), we can change the source conditions of the outflow (e.g. by increasing g‘ which means more saline outflow). We showed that the outflow geometry such as Rossby radius of deformation and also the outflow mass transport change sub-stantially (Table 2). This model overestimates the values of outflow mass transport, which can be the result of model sim-plifications that does not include the effects of entrainment, double diffusive convection and friction.
More extensive measurements and high resolution numer-ical models are required to find the outflow structure and the open sea affected by the outflow. We are planning to study these processes using numerical models to test different sce-narios.
6 Nomenclatures
ζ Relative vorticity h Upper layer thickness f Coriolis parameter
v Baroclinical geostrophic velocity along the coast g0 Reduced gravity
x Offshore direction and normal to the coast f0 Local Coriolis parameter
R Outflow width M Mass transport
α Coefficient of density change due to temperature variations β Coefficient of density change due to salinity variations
Edited by: T. McDougall
References
Bidokhti, A. A.: Shear induced splitting of a plume outflow in a stratified enclosed basin, Indian J. Mar. Sci., 34(2), 192–211, 2005.
Bower, A. S., Hunt, H. D., and Price, J. F.: Character and dynam-ics of the Red Sea and Persian Gulf outflows, J. Geophys. Res., 105(C3), 6387–6414, 2000.
Chao S. Y., Kao, T. W., and Al-Hajri, K. R.: A numerical investiga-tion of circulainvestiga-tion in the Persian Gulf, J. Geophys. Res., 97(C7), 11 219–11 236, 1992.
Gill, A. E.: Atmosphere-Ocean Dynamics, Academic Press, 662 pp., 1982.
Griffiths, R. W. and Bidokhti, A. A.: Interleaving intrusions pro-duced by internal waves; a laboratory experiment, J. Fluid Mech, 602, 21-9-239, 2008.
Privett, D. W.: Monthly charts of evaporation from the North Indian Ocean, including the Red Sea and the Persian Gulf, Quart. J. Roy. Meteorol. Soc., 85, 424–428, 1959.
Pous, S. P., Carton, X., and Lazure, P.: Hydrology and circu-lation in the Strait of Hormuz and the Gulf of Oman result from the GOGP99 Experiment, J. Geophys. Res., 109, C12038, doi:10.1029/2003JC002146, 2004.
Qasim, S. Z.: Oceanography of the northern Arabian Sea, Deep-Sea Res., 29, 1041–1068, 1982.
Reynolds, R. M.: Overview of physical oceanographic measure-ments taken during the Mt. Mitchell Cruise to the ROPME Sea Area, Mar. Pollution Bull., 27, 35–59, 1993.
Swift, S. A. and Bower, A. S.: Formation and circulation of dense water in the Persian Gulf, J. Geophys. Res., 108(C1), 3004, doi:10.1029/2002JC001360, 2003.