2019, Vol. 7, No. 1 10.15678/EBER.2019.070102
Specifics of the Mutual Trade
of the Post-Soviet Countries
Irena Benešová, Luboš Smutka, Adriana Laputková
A B S T R A C T
Objective: The proposed article discusses specifics of mutual trade between selected countries in the post-Soviet region, its structure, nature and development.
Research Design & Methods: To analyse foreign trade, an analysis of competitiveness was used and conducted for 2000 and 2015. Cluster analysis of individual commodity aggregates was conducted, and the monitored countries were divided into several groups. The following indicators were used in the cluster analysis: RCA, coverage of import by export, and the Lafay index.
Findings: A decline in comparative advantages in the mutual trade connected with the Russian Federation is substantial; however, the country remains an important business partner for the majority of the monitored countries. There is also considerable depend-ence on raw materials, which are a significant part of the overall foreign trade. In this regard, Russia or Kazakhstan are extremely dependent on trade performance in raw materials, especially natural oil and natural gas.
Implications & Recommendations: Russia and Ukraine bear the closest similarity in the competitiveness of their foreign trade. Contrariwise, Azerbaijan is highly dissimilar, as its indicators of foreign trade competitiveness are significantly different in comparison with the remaining countries. Kyrgyzstan represents a country which reports the highest degree of resemblance in its indicators of foreign trade competitiveness to the other post-Soviet countries. The degree of similarity is low between Russia and, for example, Kazakhstan and Kyrgyzstan. It is evident that the Eurasian Economic Council countries focus on different commodities in order for the trade structure to be utilised and not to be identical. Contribution & Value Added: Contribution to the international trade theory and po-litical economy.
Article type: research paper
Keywords: international trade; oil; cluster analysis; regional integration JEL codes: F13, F15, F5
Received: 25 June 2018 Revised: 21 November 2018 Accepted: 2 January 2019
Suggested citation:
INTRODUCTION
Transformation of the economy of the post-Soviet countries is connected with the im-portant change of foreign trade priorities and its impact on economic growth and devel-opment. The trade that was based on a governmental decision began to be influenced by the competitiveness of individual countries. The benefits deriving from foreign trade con-cern gaining a competitive advantage in individual commodities or groups of commodities. However, it is necessary to mention in this regard that in the case of the post-Soviet coun-tries foreign trade played a negative role, for instance when in the 1990s it resulted in economic deceleration and downturn.
Simultaneously, over the last decades foreign trade has been linked to the increasing foreign trade liberalisation not only regarding goods, but also services and capital. In ad-dition, the WTO rules enable the establishment of trade agreements and an increase in trade exchange within these agreements. This trend is evident in the Eurasian region as well, where a trade area for potential cooperation was created after the dissolution of the Soviet Union. Since the post-Soviet countries share a common heritage, it could be as-sumed that efforts to extend economic cooperation will considerably influence both the current and the future situation.
Nevertheless, these countries represent an interesting contrast in their foreign trade. On the one hand, they were very closely interconnected in the past, on the other, political factors appear in the region, hindering cooperation in many cases not only with regard to foreign trade. Russia plays a significant role here with its attempts to re-establish its position of a global player. The first step in this case is to re-establish a dom-inant position among the remaining post-Soviet republics and to encourage depend-ence of these countries on Russian trade.
Specifics of the Mutual Trade of the Post-Soviet Countries | 31
In order to assess the situation relevantly, answers to several fundamental questions must be found. What is thus the current position of individual post-Soviet republics within their mutual trade? Is Russia the only dominating country or has the trade structure changed dramatically? Are there significant differences between the countries or is it a group of more or less homogeneous countries in terms of foreign trade?
Cluster analysis will be used to classify the analysed countries into groups. The first part of the article includes a literature review and hypothesis development. The methods used are described based on the previous chapter. The second part discusses competitive-ness of the post-Soviet market and characteristics of the selected groups. The conclusion summarises the previous sections and also introduces new questions.
LITERATURE REVIEW
At the beginning of this century, Russian foreign trade showed structural surplus with the majority of the post-Soviet republics and focused solely on raw materials (Hare, Estrin, Lugachyov, & Takla, 1998). However, the structure of foreign trade did not pose a problem in the case of the Russian Federation only, but in the majority of these countries (Horváth & Zeynalov, 2014). The structure of foreign trade and its focus on raw materials in partic-ular also influences economic growth (Cavalcanti, Mohaddes, & Raissi, 2011; Neumayer, 2004). Bildirici and Kayikçi (2013) discussed the impact of crude oil production on eco-nomic growth in 4 post-Soviet states and recorded a positive correlation. At the same time, Havranek, Horvath and Zeynalov (2016) add that it is vital to consider whether this is sim-ple dependence on natural resources or their possible surplus in the production process. In addition, Al-Ubaydli (2012) states that the institutional quality and political structure are also crucial. Russia utilises its natural resources as a geopolitical instrument (Chyong & Hobbs, 2014; Cobanli, 2014; Kirkham, 2016).
Nonetheless, the structure of Russian export depends on the differences between domestic and world prices with very low competitiveness of, for example, food, agri-cultural and wood products (Benešova, Maitah, Smutka, Tomsik, & Ishchukova, 2017). On the contrary, regarding raw materials or precious stones, the price of Russian prod-ucts is competitive (Gnidchenko & Sal’nikov, 2014). However, it is essential to mention that competitiveness also depends on the region involved (Ishchukova & Smutka, 2013; Svatoš, Smutka, & Ishchukova, 2014).
Hypothesis Development
market, where China or other Asian countries are important business partners for Cen-tral Asian republics (Chiaruttini, 2014; Linn, 2012; Spechler & Spechler, 2013; Yun & Park, 2012). Regarding the Caucasian countries, it is mainly Armenia that cooperates more closely with Russia (Kirkham, 2016). Contrariwise, Georgia and Azerbaijan focus more on the EU (Pardo Sierra, 2011). The position of Moldova, Ukraine and Belarus is differ-ent. Despite its industrial past, Belarus is dependent on Russian crude oil (Connolly, 2008) and markets. Moldova represents an indigent agricultural country, and Ukraine, with its focus on trade with the EU, is experiencing a civil war.
As is evident from the above, the majority of the post-Soviet countries appertain to a group of countries that have recently undergone economic transformation. However, the question is whether the transformation related to foreign trade has already been completed and whether any changes have occurred in its structure, dynamics and ori-entation during the transformation process.
Based on the above facts, research hypotheses referring to the competitiveness of the monitored countries and their position in the mutual trade can be formulated.
H1: Openness of the economies of the monitored countries increased during the monitored period.
H2: Competitiveness of the majority of the monitored commodity aggregates of the analysed countries increased during the monitored period.
H3: The structure of mutual trade changed significantly during the monitored period. H4: Competitiveness of the monitored countries in individual commodity
aggre-gates is currently similar.
MATERIAL AND METHODS
This article focuses on mutual foreign trade of the post-Soviet countries, its structure, na-ture and development. The analysis of the current state is based on three major pillars:
− Analysis of business relations within the post-Soviet countries (trade flow).
− Analysis of competitiveness of individual countries within the group.
− Long-term development of business relations within the group of the post-Soviet countries. The purpose of the above analyses is to conduct comprehensive assessment of the over-all situation in the region. The objective of the article is to identify the role and the position of individual former post-Soviet countries on the entire market. The emphasis is placed on the position of Russia as a business hegemony within the region. The analysis was conducted on the data acquired from the UN COMTRADE database. For the purposes of this research, Standard International Trade Classification (SITC) Rev. 2 nomenclature one-digit code group was selected. The analysis was conducted on the datasets from 2000 to 2015.
Research Methods
Specifics of the Mutual Trade of the Post-Soviet Countries | 33
export specialisation. Trade data within the group only were used for comparison. This is a relative index which reports whether the country possesses a comparative advantage in a given commodity (RCA > 1) or not (RCA < 1). If RCA equals 1, the trade proportion of the given commodity corresponds with the average values of the group. The RCA index was applied to the bilateral relationships between the countries and commodity aggre-gation. However, since the data for some of the countries did not seem trustworthy, the RCA index was calculated based on exports only.
The Herfindahl-Hirschman Index (HHI) is used to evaluate concentration of a given market (Hirschman, 1964; 1980). The level of the HHI increases with the market con-centration level (Calkins, 1983). The values determined by the US Department of Justice were considered to assess the concentration level, with HHI ≤ 1.500 representing a per-fectly competitive market, 1.500 ≤ HHI ≤ 2.500 a moderately concentrated market, HHI ≥ 2.500 is then a highly concentrated market. The HHI index was calculated using two methods – Russia was included in the first case. If the concentration for individual com-modity aggregates is high, the HHI value without Russia is calculated. This step indicates the real position of the other countries in their mutual trade. The Lafay index (LFI) is another indicator applied to assess mutual trade (Bojnec, 2001; Iapadre, 2001; Lafay, 1992). The idea of this index is to provide the basic overview related to the existence of bilateral comparative advantages between two analysed trade partners. If the value of the LFI index is higher than one, the comparative advantage is proven; if the value is less than one, the comparative advantage is not proven.
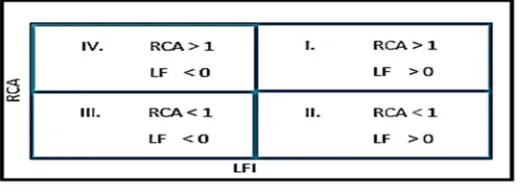
Based on the LFI and RCA analyses, individual countries could be divided into four basic groups (Figure 1), the first of which consists of the countries that possess compar-ative advantages and competitiveness within their mutual trade relations. These coun-tries possess general comparative advantages and are located in the top right quadrant. The second group consists of the countries without proven comparative advantages at a general level, although they can be competitive at a bilateral level in relation to specific partners (the bottom right quadrant). The third group covers the countries without any proven comparative advantages and without the ability to be competitive (the bottom left quadrant). The last quadrant (top left) includes the countries with proven compara-tive advantages, but their real competicompara-tiveness is questionable (they can be competicompara-tive only in relation to selected partners).
Figure 1. Division of the countries according to the lFI and RCA
Source: own elaboration.
their classification into categories (clusters). The data were clustered using hierarchical clustering. This type of clustering is based on hierarchical organisation of objects and their clusters (Hebak, 2005). Ward’s method of clustering was used in this study, the principle of which lies in minimising cluster heterogeneity according to the criterion of minimum growth of the intra-class sum of squared deviations of objects from the cluster centre. In each step, the increase in the sum of squared deviations is calculated for each pair of de-viations occurring due to their clustering. Subsequently, the clusters merge, which the minimum value of the increase corresponds with exactly (Meloun & Militký, 2012).
The countries in question are as follows: Armenia (AR), Azerbaijan (AZ), Belarus (BE), Georgia (GE), Kazakhstan (KZ), Kyrgyzstan (KG), the Republic of Moldova (MO), Russian Federation (RU), Tajikistan (TJ), Turkmenistan (TR), Ukraine (UA) and Uzbekistan (UZ).
RESULTS AND DISCUSSION
Competitiveness of the Post-Soviet Market
The HHI index was applied to assess overall competitiveness of the market. The results clearly illustrate the dominant position of Russia on the overall post-Soviet market. The HHI values do not decrease below 1600, conversely, they are in the range characteristic of a moderately concentrated market or the market is highly concentrated in some cases. This is evident predominantly at the beginning and at the end of the monitored period. A highly concentrated market concerns the following aggregates: Raw materials, inedible, except fuel, Chemical and related products, Machinery and transport equipment and Mis-cellaneous manufactured articles. When Russia is excluded, the change is significant, the remainder of the market does not tend to concentrate. The market was moderately con-centrated until 2013 only in the aggregate Mineral fuels, lubricants and related materials. It is thus evident that Russia represents a hegemony in all the directions in the given area and this directly encourages Russia’s power and is also influenced by it.
Commodity and Territorial Trade Orientation
If the export value only is considered, Manufactured goods classified chiefly by material and Machinery and transport equipment contribute to the greatest degree to the overall export within the post-Soviet countries, which is determined by high added value of these commodity aggregates. Mineral fuels, lubricants and related materials also retain high contribution. The contribution of these three aggregates has been substantial long-term. Recently, there has been an increase in Food and livestock. On the other hand, the contri-bution of Beverages and tobacco, animal and vegetable oils is insignificant.
Mineral fuels, lubricants and related materials contribute to the greatest degree to the overall turnover. Their contribution is significant, long-term and comprises approxi-mately ¼ of the overall turnover. These are followed by Machinery and transport equip-ment and Manufactured goods classified chiefly by material. These items have made long-term contribution to 60% of the overall turnover.
Specifics of the Mutual Trade of the Post-Soviet Countries | 35
Table 1. Mineral Fuels, Lubricants and Related Material – Comparison of Comparative Ad-vantages (2000, 2015)
S3 2000 2015
AR GE AZ, GE
AZ GE, UA GE, UA, UZ
BE MO, UA MO, UA
GE AR AR, AZ, TJ, TR
KZ UA AR, GE, MO, UA
KG TJ, UZ AR, MO, RU, TJ,
MO RU UA
RU GE, KZ, TJ, UA BE, KG, TJ
TJ KG, UZ KG
TR KG, TJ, UA GE, KZ, MO
UA MO GE, RU, TJ
UZ GE, KG, TJ, UA KZ
Source: own elaboration based on data from UN COMTRADE.
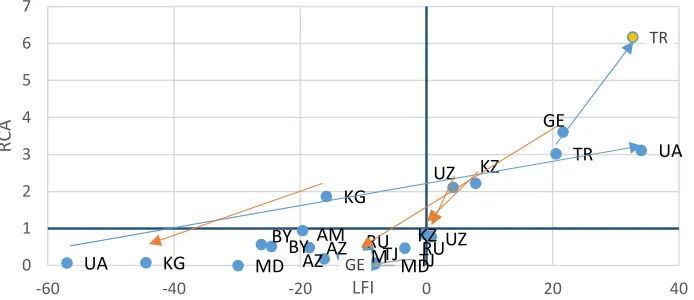
When comparing this group of commodities with the previous ones, it can be con-cluded that, in mutual trade, a lower number of countries possess a comparative ad-vantage over the remaining countries despite their expansion in comparison with 2015. This fact is influenced by their access to raw materials. The position of Belarus is inter-esting as it purchases crude oil from Russia for preferential prices and, subsequently, it either re-exports or processes it to manufacture products with higher added value. Re-garding crude oil, Ukraine is an important business partner.
Figure 2. Mineral fuels, lubricants and related materials – comparison of RCA and LFI (2000, 2015)
Source: own elaboration based on data from COMTRADE.
The commodity aggregate S- 5 Chemicals and related products comprises products traded among the majority of the participating countries. Since this concerns products with higher added value, it might be concluded that their export contributes to economic growth of these countries. In comparison with the previous aggregates, considerable differences be-tween the monitored years 2000 and 2015 are evident. Whereas in 2000 Russia possessed
AM AZ BY
GE
KZ
KG MD
RU TJ
TR UA
UZ AM
AZ BY
GE KZ KG
MD TJRU
TR
UA
UZ
0 1 2 3 4 5 6 7
-60 -40 -20 0 20 40
R
C
A
a comparative advantage over all of the monitored countries except for Belarus, in 2015 the RCA value of Russia exceeded only 1 in its trade with Moldova and Ukraine.
The category S-6 Manufactured goods classified chiefly by materials is characterised by significant changes in the monitored years. In 2000 and 2015, nearly all the monitored countries conducted mutual trade with Russia in all the sub-categories of this product ag-gregation. Russia represented the most important business partner to all the countries.
Products with high added value are included in group 7 – Machinery and transport equipment. In 2000, Russia’s position in this category of goods was the best – its compar-ative advantage was over seven countries. At the end of the monitored period, however, it was only over Azerbaijan, Kazakhstan and Turkmenistan. Improvement was evident in Belarus, which currently does not possess a comparative advantage only over the remain-ing Eastern European countries. Contrariwise, a decline is evident in Tajikistan, which pos-sessed a comparative advantage only in its trade with Kyrgyzstan and Moldova in 2015.
Miscellaneous manufactured articles contain, for instance, furniture, travelling equipment, shoes or scientific instruments. This category is largely heterogeneous, and its added values differ. The position of Russia changed in the monitored period, as it lost its comparative advantage over many countries. When analysing the sub-categories (two-digit code), it might be stated that Russia trades all the commodities except for photo-graphic equipment and supplies, and optical goods.
Division of the Countries According to Foreign Trade Structure
Based on the above analyses, cluster analysis of commodity aggregates was conducted. The following variables were included in the initial entering variables: balance, coverage of import by export, the Lafay index, RCA, contribution to overall turnover. At first, the correlation coefficient for individual variables entering the analysis was calculated based on which the following variables were excluded: balance and contribution to overall turn-over. Subsequently, the cluster analysis was conducted based on the following variables: RCA, Lafay index and coverage of import by export. Subsequently, the countries were di-vided into individual categories based on the analysis, as illustrated in Table 2.
Table 2. Division of Countries According to the Characteristics of Foreign Trade
Group 1 2 3 4 5
S1 0
TR, MO, KZ, KG,
AR ,
coverage of import by
export <1, LFI <0 RU, UZ, AZ LFI positive, RCA >1 TJ
coverage of import by export <1, LFI>5,
highest RCA GE, UA, BE
highest coverage of import by export, LFI
low but positive
S1 1 AZ, UZ
highest coverage of import by export, very
low RCA
BE, GE, KZ, KG,RU, TJ, TR,UA
very low coverage I/E, lowest RCA, LFI
below 0
MO RCA above 5, LFI
slightly above 0 AR highest RCA and LFI
S1 2 AZ, KZ highest coverage of import by export
BE, KG, MO, UZ
lowest coverage of import by export
GE, RU,
TR, UA very low RCA TJ highest LFI and RCA
S1 3 RU, AZ,
TJ, AR LFI < 0 , RCA <1,
BE, KG, MO, UA
coverage of import by export close to 0,
lowest LFI
GE, KZ, UZ,
RCA > 1, positive coverage of
import by export
TR
highest coverage of import by export, RCA
and LFI very high
S1 4 AZ
coverage of import by export is very low,
RCA > 1
BE, KZ, KG, TJ, TR, UZ,
AR,
RCA close to 0 GE,
MO,RU highest LFI UA
highest coverage of import by export,
RCA > 1
S1 5 AZ, GE,
highest coverage of import by export, LFI<
0
BE,KZ,RU, UA, UZ,
negative LFI, highest
RCA KG lowest LFI
MO, TJM
very low RCA and very low coverage I/E
TR, AR
negative LFI, coverage
I/E<1
S1 6 AZ
highest coverage of import by export and
LFI
BE, GE,
UZ, AR RCA < 1, LFI < 0
KZ, KG, MO,TJ,
TR
lowest coverage I/E and RCA
RU,
UA highest RCA
S1 7 AZ
highest coverage of import by export, high
LFI and RCA
BE, RU, UA, UZ
RCA around 1, LFI around 0
GE, KG, MO, TJ, AR
negative LFI KZ, TR
coverage I/E close to 0, lowest LFI and RCA
S1 8 AZ, GE LFI close to 0, positive coverage I/E
BE, KG,
AR, highest LFI and RCA KZ, MO, lowest LFI RU,
UA LFI close to 0 TJ, TR negative LFI, lowest RCA, lowest coverage I/E Note: I/E – import by export
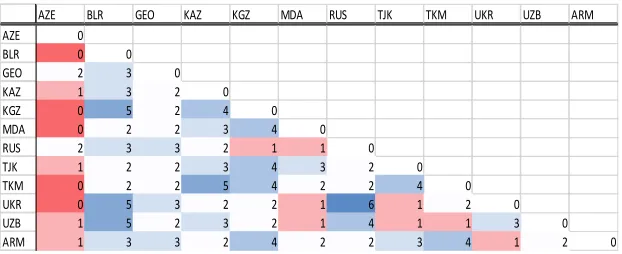
The above mentioned division enables comparison of individual countries (Figure 3). Russia and Ukraine bear the closest resemblance in competitiveness of their foreign trade. Their degree of competitiveness in the majority of the monitored commodities is very high. The only commodity aggregates that reach different values of calculated indicators are food and livestock, mineral fuels, lubricants and related materials and animal and veg-etable oils, fats and waxes. Conversely, the degree of similarity is low between Russia and, for example, Kazakhstan and Kyrgyzstan. It is evident that the Eurasian Economic Council countries focus on different commodities in order for the trade structure to be utilised and not to be identical. Furthermore, Belarus with Kyrgyzstan, Ukraine or Uzbekistan record a high degree of resemblance in the structure of their foreign trade. The degree of simi-larity is also very high in the case of Kazakhstan and Turkmenistan. Contrariwise, Azerbai-jan is highly dissimilar as its indicators of foreign trade competitiveness are significantly different in comparison with the other countries. The differences are also recorded in the case of Tajikistan, which bears the closest resemblance to Kyrgyzstan and Turkmenistan. Kyrgyzstan represents a country which reports the highest degree of similarity in its indi-cators of foreign trade competitiveness to the remaining post-Soviet countries. Its status might be influenced by its membership in the Eurasian Economic Council. Concerning this, Kirkham (2016) emphasises that this is in order for the boom-bust cycle not to be synchro-nised should there be further integration. For this reason the hypothesis number 4 cannot be accepted, nor similarity between the countries in terms of their competitiveness.
Figure 3. Comparison of Similarities Between Countries
Source: own elaboration based on data from UN COMTRADE.
CONCLUSIONS
The structure of the trade between the post-Soviet countries is strongly influenced by the structure of their economies and overall economic maturity. Simultaneously and in a number of ways, the countries represent a territory which is important not only for Russia, but also for other countries. They are striving to change the current distribution of power through favourable business relations. In comparison with 2000, the structure of business partners of the monitored countries has changed – especially territorially, within the post-Soviet market.
When comparing the situation in the analysed period, it is evident that the pace of growth in individual countries still has not reached its final state. The first hypothesis about
AZE BLR GEO KAZ KGZ MDA RUS TJK TKM UKR UZB ARM
AZE 0
BLR 0 0
GEO 2 3 0
KAZ 1 3 2 0
KGZ 0 5 2 4 0
MDA 0 2 2 3 4 0
RUS 2 3 3 2 1 1 0
TJK 1 2 2 3 4 3 2 0
TKM 0 2 2 5 4 2 2 4 0
UKR 0 5 3 2 2 1 6 1 2 0
UZB 1 5 2 3 2 1 4 1 1 3 0
Specifics of the Mutual Trade of the Post-Soviet Countries | 39
the openness of the economy cannot be confirmed, as it decreased during the monitored period, which is evident for example in Belarus or Tajikistan. However, Belarus, Moldova, Turkmenistan and Ukraine are the most open economies. Regarding Belarus, the former two, this situation is specific since none of the countries is a member of WTO. When com-paring the years 2000 and 2015, a higher degree of interconnectedness between the coun-tries is evident, particularly those connected to Russia. The structure of foreign trade of the countries is also gradually undergoing changes. Closer interconnectedness between individual geographical units is evident here. In comparison with 2000, there was (in the period up to 2015) a significant shift in, for example, Georgia’s business direction towards the EU rather than Russia and other post-Soviet republics. In terms of economic openness, it might also be stated that Tajikistan together with Uzbekistan are countries which were closest to autarky in 2015. When individual commodity aggregates are assessed, it might be stated that the majority of the countries experienced significant changes between 2000 and 2015. A decline in the comparative advantages in the mutual trade connected with Russia is substantial; however, the country remains an important business partner for most of the monitored countries. The third hypothesis can be confirmed. Belarus is the reverse since it has been able to increase the number of comparative advantages of the products with higher added value. In the last two years, Ukraine’s foreign trade has rec-orded significant losses. This might be influenced by the civil war in its eastern part and problematic relations with the Russian Federation.
Considerable dependence on raw materials, which are a significant part of the overall foreign trade, is also evident in the selected countries. In this regard, Russia or Kazakhstan are extremely dependent on trade performance in raw materials, especially on natural oil and natural gas. This corresponds with the conclusion drawn by (Connolly, 2011).
When assessing intra-industry trade, it is important to mention similar specialisation of individual countries as well, for example, in pharmaceutical products, which signifies that these countries possess similar factor endowment and it is thus assumed that eco-nomic integration can be adjusted.
REFERENCES
Al-Ubaydli, O. (2012). Natural resources and the tradeoff between authoritarianism and development. Journal of Economic Behavior & Organization, 81(1), 137-152. https://doi.org/10.1016/j.jebo.2011.09.009
Åslund, A. (2003). Post-Soviet Free Trade. Retrieved on April 11, 2017 from https://www.project-syndicate.org/commentary/post-soviet-free-trade?barrier=accessreg
Atik, S. (2014). Regional Economic Integrations in the Post-soviet Eurasia: An Analysis on Causes of Inefficiency. Procedia – Social and Behavioral Sciences, 109, 1326-1335. https://doi.org/10.1016/j.sbspro.2013.12.633
Azizov, U. (2017). Regional integration in Central Asia : From knowing-that to knowing-how. Journal of Eurasian Studies, 8(2), 123-135. https://doi.org/10.1016/j.euras.2017.02.002
Balassa, B. (1965). Trade Liberalisation and Revealed Comparative Advantage. The Manchester School, 33(2), 99-123. https://doi.org/10.1111/j.1467-9957.1965.tb00050.x
Benešová, I., Maitah, M., Smutka, L., Tomsik, K., & Ishchukova, N. (2017). Perspectives of the Russian agricultural exports in terms of comparative advantage. Agricultural Economics (Czech Republic), 63(7). https://doi.org/10.17221/344/2015-AGRICECON
Benešová, I., Novotná, Z., Šánová, P., & Laputková, A. (2016). Economic Comparison of Agricultural Sector of Eurasian Countries – Is There Any Potential for Development Through Economic Cooperation?. AGRIS On-Line Papers in Economics and Informatics, 8(2), 19-31. https://doi.org/10.7160/aol.2016.080202
Bildirici, M.E., & Kayikçi, F. (2013). Effects of oil production on economic growth in Eurasian countries: Panel ARDL approach. Energy, 49(1), 156-161. https://doi.org/10.1016/j.energy.2012.10.047
Bohr, A. (2004). Regionalism in Central Asia: New geopolitics, old regional order. International Affairs, 80(3), 485-502. https://doi.org/10.1111/j.1468-2346.2004.00394.x
Bojnec, S. (2001). Trade and Revealed Comparative Advantage Measures Regional and Central and East European Agricultural Trade. Eastern European Economics, 39(2), 72-98.
Buszynski, L. (2004). Russia and the CIS in 2010. Asian Survey, 44(1), 158-167. https://doi.org/10.1525/as.2011.51.1.64
Calkins, S. (1983). The New Merger Guidelines and the Herfindahl- Hirschman Index. Cal. L. Rev,
71(2), 402-429. https://doi.org/10.15779/Z38B74S
Cavalcanti, T.V. de V., Mohaddes, K., & Raissi, M. (2011). Growth, development and natural resources: New evidence using a heterogeneous panel analysis. The Quarterly Review of Economics and Finance, 51(4), 305-318. https://doi.org/10.1016/j.qref.2011.07.007
Chiaruttini, M.S. (2014). EU, Russia and the reshaping of the post-Soviet economic space: an international trade analysis. ERSA Conference Papers. Retrieved on July 21, 2018 from https://ideas.repec.org/p/wiw/wiwrsa/ersa14p764.html#?
Chyong, C.K., & Hobbs, B.F. (2014). Strategic Eurasian natural gas market model for energy security and policy analysis: Formulation and application to South Stream. Energy Economics, 44(April 2012), 198-211. https://doi.org/10.1016/j.eneco.2014.04.006
Cobanli, O. (2014). Central Asian gas in Eurasian power game. Energy Policy, 68, 348-370. https://doi.org/10.1016/j.enpol.2013.12.027
Connolly, R. (2008). The Structure of Russian Industrial Exports in Comparative Perspective. Eurasian Geography and Economics, 49(5), 586-603. https://doi.org/10.2747/1539-7216.49.5.586 Connolly, R. (2011). Financial Constraints on the Modernization of the Russian Economy. Eurasian
Geography and Economics, 52(3), 428-459. https://doi.org/10.2747/1539-7216.52.3.428 Cusolito, A.P., & Hollweg, C.H. (2015). Trade Policy Barriers: An Obstacle to Export
Diversification in Eurasia. Journal of Banking & Financial Economics, 2(May), 91-129. https://doi.org/10.1596/1813-9450-6434
Dragneva, R., & Wolczuk, K. (2012). Russia, the Eurasian Customs Union and the EU: cooperation, stagnation or rivalry?. Chatham House Briefing Paper REP BP 2012/01,London, Chatham House. https://doi.org/10.2139/ssrn.2125913
Furusawa, T., & Konishi, H. (2007). Free trade networks. Journal of International Economics, 72, 310-335. https://doi.org/10.1016/j.jinteco.2006.08.003
Gnidchenko, A., & Sal’nikov, V. (2014). Price Competitiveness in Russian Foreign Trade. Problems of Economic Transition, 57(5), 3-36. https://doi.org/10.2753/PET1061-1991570501
Meta-Specifics of the Mutual Trade of the Post-Soviet Countries | 41
Analysis. World Development, 88, 134-151. https://doi.org/10.1016/j.worlddev.2016.07.016 Head, K., Mayer, T., & Ries, J. (2010). The erosion of colonial trade linkages after independence.
Journal of International Economics, 81(1), 1-14. https://doi.org/10.1016/j.jinteco.2010.01.002 Hebak, P. (2005). Vícerozměrné statistické metody (Multidimensional Statistical Methods) (1.).
Praha: Informatorium.
Hirschman, A.O. (1964). The Paternity of an Index. The American Economic Review, 54(5), 761. Hirschman, A.O. (1980). National Power and the Structure of Foreign Trade. (S. D. Krasner, Ed.).
Los Angeles: University of California Press. Retrieved on April 8, 2017 from https://books.google.cz/books?id=BezqxPq50dwC&pg=PR3&hl=cs&source=gbs_selected_ pages&cad=2#v=onepage&q&f=false
Horváth, R., & Zeynalov, A. (2014). The Natural Resource Curse in Post-Soviet Countries : The Role of Institutions and Trade Policies. Working Papers. Retrieved on April 5, 2017 from https://ideas.repec.org/p/ost/wpaper/341.html#?
Iapadre, P.L. (2001). Measuring international specialization. International Advances in Economic Research, 7(2), 173-183. https://doi.org/10.1007/BF02296007
Ishchukova, N., & Smutka, L. (2013). Revealed Comparative Advantage of Russian Agricultural Exports. Acta Universitatis Agriculturae et Silviculturae Mendelianae Brunensislianae Brunensis,
104(4), 941-952. https://doi.org/10.11118/actaun201361040941
Kirkham, K. (2016). The formation of the Eurasian Economic Union: How successful is the Russian regional hegemony?. Journal of Eurasian Studies, 7(2), 111-128. https://doi.org/10.1016/j.euras.2015.06.002 Kirkow, P. (1999). Foreign trade arrangements in Russia and its regions: Relying on foreign capital to generate growth?. Post-Communist Economies, 11(1), 79-98. https://doi.org/10.1080/14631379996057
Kowalczyk, C., & Wonnacott, R.J. (1992). Hubs and Spokes, and Free Trade in the Americas
(Economics Working Papers Archive No. 9209). London. Retrieved on April 10, 2017 from https://ir.lib.uwo.ca/economicsresrpt
Kuplewatzky, N. (2015). Deflection of Trade upon Enlargement of the European Union. Journal of International Economic Law, 18(2), 433-447. https://doi.org/10.1093/jiel/jgv023
Kuznetsova, N., Kocheva, E., & Matev, N. (2016). The Analysis of Foreign Trade Activities of Russia and Asia-pacific Region. International Journal of Economics and Financial Issues, 6(2), 736-744. Retrieved on July 21, 2018 from https://www.econjournals.com/index.php/ijefi/article/viewFile/2166/pdf Lafay, J. (1992). The Measurement of Revealed Comparative Advantages. In M.G. Dagenais & P.A. Muet
(Eds.), International Trade Modeling (pp. 209-234). London, United Kingdom: Chapman and Hall. Linn, J. (2012). Central Asian Regional Integration and Cooperation: Reality or Mirage?. In EDB
Eurasian Integration Yearbook 2012 (1st ed., pp. 96-117). Almaty: Eurasian Development Bank. Mansourov, A.Y. (2005). Mercantilism and Neo-Imperialism in Russian Foreign Policy during President Putin’s 2nd Term. Korean Journal of Defense Analysis, 17(1), 151-184. https://doi.org/10.1080/10163270509464078
Mazhikeyev, A., & Edwards, T.H. (2013a). Central Asian Trade Relations in the Post-Soviet Era. (WP No. 2013 – 02). Loughborough. Retrieved on April 2, 2017 from http://www.lboro.ac.uk/ departments/sbe/RePEc/lbo/lbowps/Mazhikeyev_WP2013_02.pdf
Mazhikeyev, A., & Edwards, T.H. (2013b). Central Asian Trade Relations in the Post-Soviet Era. Retrieved on April 5, 2017 from http://www.etsg.org/ETSG2013/Papers/126.pdf
Meloun, M., & Militký, J. (2012). Statistická analýza experimentálních dat (Statistical Analysis of Experimental data) (2.). Praha: ACADEMIA.
Mostafa, G. (2013). The concept of ‘Eurasia’: Kazakhstan’s Eurasian policy and its implications.
Journal of Eurasian Studies, 4(2), 160-170. https://doi.org/10.1016/j.euras.2013.03.006 Neumayer, E. (2004). Does the “Resource Curse” hold for Growth in Genuine Income as Well?. World
Development, 32(10), 1627-1640. https://doi.org/10.1016/j.worlddev.2004.05.005
Norling, N., & Swanström, N. (2007). The Virtues and Potential Gains of Continental Trade in Eurasia.
Asian Survey, 47(3), 351-373. Retrieved on April 11, 2017 from
http://isdp.eu/content/uploads/images/stories/isdp-main-pdf/2007_norling-swanstrom_the-virtues-and-potential-gains-of-continental-trade.pdf
Obydenkova, A. (2011). Comparative regionalism: Eurasian cooperation and European integration. The case for neofunctionalism?. Journal of Eurasian Studies, 2(2), 87-102. https://doi.org/10.1016/j.euras.2011.03.001
Pardo Sierra, O.B. (2011). No man’s land? A comparative analysis of the EU and Russia’s influence in the Southern Caucasus. Communist and Post-Communist Studies, 44(3), 233-243. https://doi.org/10.1016/j.postcomstud.2011.07.007
Puga, D. (2001). European Regional Policies in Light of Recent Location Theories (International Trade No. 2767). Toronto. Retrieved on April 11, 2017 from www.cepr.org/pubs/dps/DP2767.asp Roberts, M., & Wehrheim, P. (2001). Regional trade agreements and WTO accession of CIS countries.
Intereconomics, 36(6), 315-323. https://doi.org/10.1007/BF02930149
Skriba, A. (2016). Russian Strategy towards the Post-Soviet Space in Europe: Searching for Balance between Economy, Security, and Great Power Attractiveness. Strategic Analysis, 40(6), 604-618. https://doi.org/10.1080/09700161.2016.1224061
Spechler, M.C., & Spechler, D.R. (2013). Russia’s lost position in Central Eurasia. Journal of Eurasian Studies, 4(1), 1-7. https://doi.org/10.1016/j.euras.2012.08.001
Svatoš, M., Smutka, L., & Ishchukova, N. (2014). The position of agriculture in the Russian Federation – the last two decades development overview. Agric. Econ., 60, 489-502.
Tsygankov, A.P. (2012). Russia and the CIS in 2011: Uncertain Economic Recovery Russia and the CIS in 2011. As. Sur., 52(1), 42-51. https://doi.org/10.1525/as.2012.52.1.42
Yun, Y., & Park, K. (2012). An Analysis of the Multilateral Cooperation and Competition between Russia and China in the Shanghai Cooperation Organization: Issues and Prospects. Pacific Focus,
27(1), 62-85. https://doi.org/10.1111/j.1976-5118.2012.01076.x
Zahorka, H.-J., & Sargsyan, O. (2014). The Eurasian Customs Union: an alternative to the EU’s Association Agreements?. European View, 13(1), 89-96. https://doi.org/10.1007/s12290-014-0309-3
Specifics of the Mutual Trade of the Post-Soviet Countries | 43
Authors
Contribution share of authors is as follows: I. Benešová – 50 %, L. Smutka – 40 %, A. Laputkova – 10 %.
Irena Benešová
PhD in Economics and Management (CULS Prague). Her research interests include regional inte-gration, economic policy and public economics.
Correspondence to: Czech University of Life Sciences, Faculty of Economics and Management, Kamycka 129, Praha 6 – Suchdol, 165 21, Czech Republic email: [email protected]
ORCID http://orcid.org/0000-0002-9381-063X
Luboš Smutka
Professor in sectoral economics (CULS Prague). His research interests include international trade and economic development.
Correspondence to: Czech University of Life Sciences, Faculty of Economics and Management, Kamycka 129, Praha 6 – Suchdol, 165 21, Czech Republic email: [email protected]
ORCID http://orcid.org/0000-0001-5385-1333
Adriana Laputková
Master in English Language. Her research interests includes English language development and academic English.
Correspondence to: Czech University of Life Sciences, Faculty of Economics and Management, Kamycka 129, Praha 6 – Suchdol, 165 21, Czech Republic email: [email protected]
ORCID http://orcid.org/0000-0001-6483-9081
Acknowledgementsand Financial Disclosure
This article was supported by the Grant Agency at the Faculty of Economics and Management, Czech University of Life Sciences Prague: Economic specifics of the post-Soviet countries [no. 20181018] and project No. QK1920398 – Duality in the Czech agriculture: advantage or disad-vantage for the future.
Copyright and License
This article is published under the terms of the Creative Commons Attribution – NoDerivs (CC BY-ND 4.0) License
http://creativecommons.org/licenses/by-nd/4.0/
Published by the Centre for Strategic and International Entrepreneurship – Krakow, Poland