291
International Journal of Pharmaceutical Sciences and Drug Research
2014; 6(4): 291-302
Research Article
CODEN (USA): IJPSPP
ISSN: 0975-248X
Analytical Method Validation of an Herbal Formulation by Headspace Gas
Chromatography Using QbD
Joydeep Mazumder
1*, Devender Pathak
1, Rachna Kumria
21Rajiv Academy for Pharmacy, Delhi-Mathura Highway, P.O Chhatikara, Mathura-281 001, Uttar Pradesh, India 2Swift School of Pharmacy, Village- Ghaggar Sarai, Rajpura, Patiala, Punjab, India
ABSTRACT
Essential oils are rich sources of biologically active compounds possessing diverse medicinal properties. These form integral part of a number of herbal formulations. The most challenging part of commercialization of herbal formulation is to ensure consistency in quality from batch to batch. The aim of present study was to develop a validated gas chromatographic method based on quality by design (QbD) for routine quality control purpose. A blend of essential oils possessing synergistic carminative properties was formulated in oily base. Ajowan oil, cardamom oil, caraway oil, coriander and fennel oil were selected for development of formulation. A gas chromatography method was developed for routine quality control purpose of the developed formulation by quality by design techniques (QbD). Each oil was characterized making use of a marker compound which was linalool for coriander oil, cineol for cardamom oil, anethol for fennel oil, carvone for caraway oil, thymol for ajowan oil and menthol for peppermint oil. Marker compound was characterized using mass spectroscopy. Chromatography method was established by quality by design approach and validated based on ICH guidelines.
Keywords: Essential oil, gas chromatography, headspace analysis, marker compound, quality by design (QbD),
Design of experiment (DoE).
INTRODUCTION
In medical sciences there is a continuous quest to discover new chemical entities to fight new and emerging diseases. These chemical entities with diverse chemical structures act at the receptors sights using varied mechanisms of action. As such chemical entities from plant origin often act as lead molecules for such discoveries. Products from plant origin however, contain a complex mix of chemical compounds of
*Corresponding author: Mr. Joydeep Mazumder,
Rajiv Academy for Pharmacy, Delhi-Mathura Highway, P.O Chhatikara, Mathura-281 001, Uttar Pradesh, India; Tel.: +91-9704577208;
E-mail: [email protected]
Received: 23 September, 2014; Accepted: 01 October, 2014
which some may show pharmacological activity while the rest may be inactive. Traditionally plants have been used in folklore medicines for common ailments. As per WHO, a majority of world’s population depends upon traditional medicines for primary healthcare needs. Modern science struggles to isolate the active compounds from plant extract, a holistic approach of preparing and administered complete extracts has been successfully used traditionally.
Int. J. Pharm. Sci. Drug Res. October-December, 2014, Vol 6, Issue 4 (291-302)
plant parts such as fruits, flowers, seeds, buds, leaves, bark, wood, twigs or roots. They comprise of a terpene component as well as a non-terpene component. Essential oils are known to possess a number of medicinal properties like antimicrobial, antioxidant, antifungal, analgesic, anti-inflammatory activity. [1-6]
These are very good carminatives and are used in a number of gastrointestinal ailments.
Being sourced from plants, essential oils may vary in composition depending upon species of the plant used, location where plant is grown, condition of the soil, weather conditions, level of experience of the cultivator, etc. Due to its complex chemical composition, as such the characterization and estimation of purity of individual essential oils is quite challenging. Another challenge lies in authenticating and quality control of herbal formulation with varied ingredients. An herbal formulation comprising of essential oil combination with a proposed syngeristic carminative activity was developed for gastrointestinal disorders. Analytical method development together validation was carried out for routine analysis of the herbal essential oil formulation. Gas chromatography is an important tool of analytical techniques for identification and characterization of actives present in essential oils. [7-8] In the light of the above, it was
proposed to develop an analytical method for identification and estimation of purity individual and blend of essential oil.
In the present study the primary objective is,
To develop a sequential technique to identify the key drug characteristic of essential oil.
Develop a suitable, precise analytical gas chromatographic headspace method by QbD approach to quantify the active present in the blend of essential oil.
To get document of assurance on reliable result and method is suitable for its intended use, validation of the method had established as per ICH guideline.
In the present study a blend of oil was prepared by combination ajowan, cardamom, caraway, coriander, fennel oil and peppermint oil which individually possess medicinal properties such as antacid, carminative, anti-flatulent, antimicrobial etc. [9-13] The
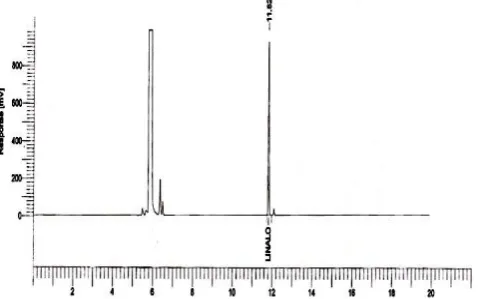
marker Linalool is a major compound present in coriander oil; cineol in cardamom oil, anethol in fennel oil, carvone in caraway oil, thymol in ajowan oil and menthol in peppermint oil (Fig. 1) used as a standard to identify and estimation of purity of the individual oil.
[14-15] The all marker compound was characterized by
mass spectroscopy. [16]
CTD format emphasizes the requirement of QbD. Through application of QbD a design space is created and working within the design space is not considered as change. Working on similar lines, QbD approach including DoE concept into analytical method development is picking up momentum. In analytical
method development, the performance of the analytical method within the allowable change needs to be demonstrated. ICH Q8 defines the critical quality attributes (CQA) as physical chemical, biological, or microbiological property or characteristic that should be within the appropriate limit, range or distribution to be sure of the desired product quality. The performance of the analytical method as given by precision, accuracy, specificity, linearity, range and limit of quantitation of impurities, should be targeted. The developed method should be capable of providing a measurable control of the CQA during manufacturing and stability testing. For instance, the acceptance criteria for method accuracy and precision will he required to be tighter for a product with a narrower assay limit of ± 5% as compared to a product with an assay limit of ± 10%. Analytical gas chromatography using head space method [17-19] has been developed by
quality by design (QbD) approach [20-22] which has
become an important concept for the pharmaceutical industry to find out and measure the CQA and its design space. In order to confirm the assay method are accurate, method validation has been carried out according to current ICH guidelines. [23-26]
1a 1b 1c
1d 1e 1f
Fig. 1: Chemical structure of Linalool (1a), Menthol (1b), D-carvone (1c) Anethol (1d), Thymol (1e), and Cineol (1f)
MATERIALS AND METHODS Material and Reagent
Cardamom, Coriander, Fennel, Carawa, Ajowan oil and peppermint oil were purchased from Ultra International Ltd., Uttar Pradesh, India. Markers compounds namely linalool, cineol, anethol, carvone, thymol and menthol were also procured from Ultra International Limited, Uttar Pradesh, India. Methanol, Hydrochloric Acid, Sodium Hydroxide and other reagents used for the analysis were of Analytical grade. The purities of all the standards were not less than 98%.
Instrumentation and software
Int. J. Pharm. Sci. Drug Res. October-December, 2014, Vol 6, Issue 4 (291-302) Physical characterizations of oils
The physico-chemical properties were measured according to Russian Pharmacopoeia (1990). The color of the individual oils was checked by visual observation. 5 ml of the individual oil in was poured into a standard test tube and the color was noted. Refractive index and optical rotation of the oils has been checked using Abbe’s Refractometer and polarimeter. Specific gravity test has been performed using Borosil Specific Gravity Bottle and calculate by the flowing formula:
Where, m1=Mass in grams of empty gravity bottle,
m2=Mass in grams of gravity bottle with distilled water
at 25°C, m3=Mass in grams of gravity bottle with test
sample at 25°C, d=Relative density.
Characterization of marker compounds by Mass spectroscopy
The individual marker compound was characterized making use of Atmospheric-Pressure Chemical Ionization (APCI) mass spectroscopic method to determine the molecular mass of the marker compound. This study was carried out at Radiant Research Center, Bangalore, India.
Identification and estimation of purity
GC-Headspace method was developed to identify & estimate the purity of individual oil based on marker compound present in each oil where respective marker compound was used as standard. The gas chromatographic system included a Gas chromatograph with Headspace auto sampler and a flame ionization detector. A DB-624 Capillary column with 30 meters length, 0.32 mm ID and 1.8µm film thickness was use as a stationary phase. Initial oven temperature was programmed at 60°C with a hold for 2 minutes, with a 15°C/ minutes rate. The temperature was raised to 180°C and hold for 10 minutes. The final temperature was elevated to 240°C at a rate of 15°C/ minutes. Nitrogen was used as a carrier gas at flow of 1.2 ml/min. Detector parameter were programmed as: temperature 270°C, range 1 and attenuation - 4. Split ratio selected 5:1. The total run time is 20 minutes. In the head-space the oven temperature was kept at 85°C , Needle temperature 95°C, Transfer line temperature 100°C, GC cycle time 22 minutes, thermostat time 30 minutes, pressurization time 2 minutes, injection time 0.5 minutes, withdrawal time 0.5 minutes. Headspace mode was kept constant and Headspace carrier pressure was fixed to 15 psi. Each individual oil has considered as a sample & their respective marker compound considered as standard which were dissolved in methanol in a separate volumetric flask and the final concentration was 0.5 mg/ml. 1ml of sample solution and their respective each marker standard stock solution was transferred to different headspace vial and immediately crimped. The sample was identified against the active present in the each oil
and purity was calculated against the marker compound on consideration of the purity of each marker compound as 100%. The column was equilibrated for up to 1 h before stating the experiment. After equilibration, six injections of solution/each marker compound of respective oil with the test sample of each oil were injected.
Preparation of blend of sample and standard:
A blend of stock sample had prepared by transferred 1g of each oil in 200 ml volumetric flask. Added approximately 500 mg of peppermint oil (used as soothening agent) into made up the volume with sunflower oil used as a base. The sample was stored in a close tight amber color container. From the above stock, 1 ml of sample had transferred into 10 ml volumetric flask and made up the volume with methanol. A blend of standard was prepared by transferring accurately weighed 5 mg of each marker compound into 10 ml of volumetric flask and made up the volume with methanol.
QbD approach and Identify the CQA
The experimental design along with statistical analysis of data was performed by Design-Expert 8.0 software, Full Version (Stat Ease Stat-Ease, Inc., Minneapolis, MN, USA). An experimental design is an experimental set-up to simultaneously evaluate several factors at a given numbers of levels in a predefined number of experiments. Several types of experimental designs (Two level full factorial, two level fractional factorial, Placket-Burman, mixed level designs) are available and these designs allow the simultaneous examination of qualitative, quantitative and mixture related factors. A two level full factorial design is selected for the present study to determine the main effects and all interactions between the factors.
To make systemic experimental design, it is necessary to identify the CQA of the method. The design comprised with 21 robustness experiment trial by changed the chromatographic condition of each parameter like gas flow rate, detector temperature, split ratio and head-space oven temperature, Needle temperature, transfer line temperature, thermostat time, headspace carrier pressure (Table 1). Among all the chromatographic parameters gas flow, head space oven temperature and head space thermostat time were identified as CQA of the method which could alter the two critical system suitability parameter resolution (RS1) between D-carvone- anethol and resolution (RS2) between thymol and cineol peak.
A two level full factorial design (23) is selected for the
Int. J. Pharm. Sci. Drug Res. October-December, 2014, Vol 6, Issue 4 (291-302)
Table 1: Robustness experiment
Gas Chromatograph Parameters (-)ve control condition Control condition (+)ve control condition Number of experiment
Carrier gas flow(N2) 1 mL/min. 1.2 mL/min. 1.4 mL/min. 3
Detector temperature 250°C 270°C 290°C 3
Injector temperature 210°C 220°C 240°C 3
Split ratio 1:1 5:1 10:1 3
Oven temperature 75°C 85°C 95°C 3
Needle temperature 90°C 95°C 100°C 3
Transfer line temperature 90°C 100°C 110°C 3
Thermostat time 20 minutes 30 minutes 40 minutes 3
Table 2: DoE experiment Study design
Std. Run Flow/Min. Factor-1 Oven temperature(°C) Factor-2 Thermostat time (min.) Factor-3
13 1 1.00 94.00 33.00
8 2 1.40 94.00 27.00
20 3 1.20 85.50 30.00
12 4 1.40 77.00 33.00
6 5 1.00 94.00 27.00
10 6 1.00 77.00 33.00
11 7 1.40 77.00 33.00
14 8 1.00 94.00 33.00
19 9 1.20 85.50 30.00
2 10 1.00 77.00 27.00
17 11 1.20 85.50 30.00
15 12 1.40 94.00 33.00
7 13 1.40 94.00 27.00
3 14 1.40 77.00 27.00
9 15 1.00 77.00 33.00
1 16 1.00 77.00 27.00
16 17 1.40 94.00 33.00
18 18 1.20 85.50 30.00
5 19 1.00 94.00 27.00
4 20 1.40 77.00 27.00
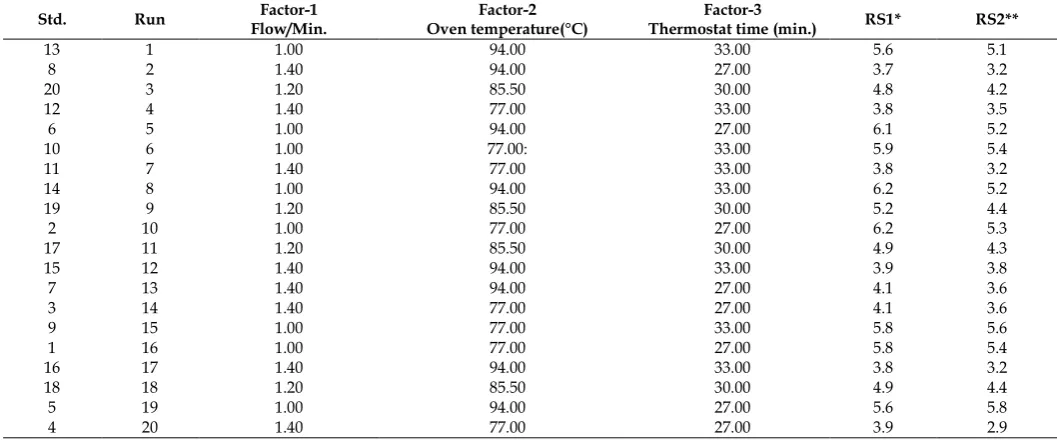
Table 3: Result of system suitability parameter in DoE experiment
Std. Run Flow/Min. Factor-1 Oven temperature(°C) Factor-2 Thermostat time (min.) Factor-3 RS1* RS2**
13 1 1.00 94.00 33.00 5.6 5.1
8 2 1.40 94.00 27.00 3.7 3.2
20 3 1.20 85.50 30.00 4.8 4.2
12 4 1.40 77.00 33.00 3.8 3.5
6 5 1.00 94.00 27.00 6.1 5.2
10 6 1.00 77.00: 33.00 5.9 5.4
11 7 1.40 77.00 33.00 3.8 3.2
14 8 1.00 94.00 33.00 6.2 5.2
19 9 1.20 85.50 30.00 5.2 4.4
2 10 1.00 77.00 27.00 6.2 5.3
17 11 1.20 85.50 30.00 4.9 4.3
15 12 1.40 94.00 33.00 3.9 3.8
7 13 1.40 94.00 27.00 4.1 3.6
3 14 1.40 77.00 27.00 4.1 3.6
9 15 1.00 77.00 33.00 5.8 5.6
1 16 1.00 77.00 27.00 5.8 5.4
16 17 1.40 94.00 33.00 3.8 3.2
18 18 1.20 85.50 30.00 4.9 4.4
5 19 1.00 94.00 27.00 5.6 5.8
4 20 1.40 77.00 27.00 3.9 2.9
* RS1 Resolution between D-carvone- Anethol and resolution ** RS2 Resolution between Thymol – Cineol peak
Table 4: The table lists the physical properties of the oils
Essential oil Color Odor Relative density Refractive index Optical rotation
Coriander Colorless to pale yellow Characteristic 0.867 1.465 + 9.004°
Caraway Colorless to pale yellow Characteristic 0.915 1.487 + 71.01°
Fennel Colorless to pale yellow Characteristic 0.962 1.541 + 12.182°
Ajowan Colorless to pale yellow Characteristic 0.924 1.501 + 0.447°
Cardamom Colorless to pale yellow Characteristic 0.920 1.463 + 26.709°
Evaluation of result and desirable space: The results
(Table 3) obtained from 20 experiments were analyzed through Design Expert
® software. The effect on the
Int. J. Pharm. Sci. Drug Res. October-December, 2014, Vol 6, Issue 4 (291-302)
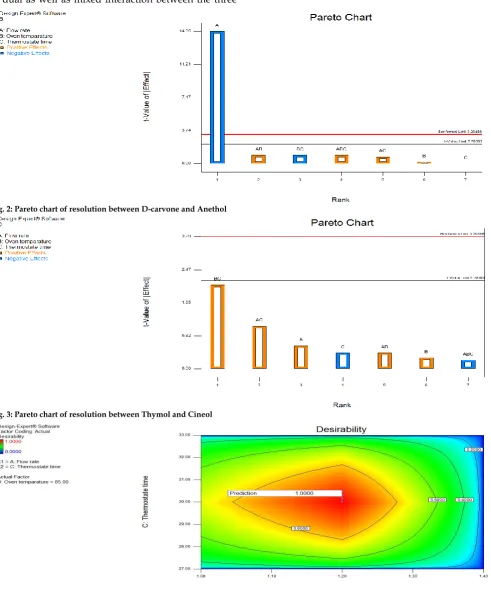
variables was explained by using Pareto chart (Figures 2 and 3).
It was observed that the system suitability parameter, resolution (RS1) between D-carvone and Anethol and resolution (RS2) between Thymol and Cineol was affected by either individual three variable or due to interaction between two or three variables.
The 1st pareto chart (Fig. 2) demonstrate resolution
(RS1) between D-carvone and Anethol was effected due to dual as well as mixed interaction between the three
variable. A positive effect was found due to interaction between flow rates with oven temperature or flow rate with thermostat temperature and even due to mixed interaction between three variables but individually has no independent effect on this system suitability parameter. Hence negative effect was found which has demonstrated in the pareto chart in the blue histogram. Interaction between oven temperatures with thermostat temperature also showed negative effect in the chart.
Fig. 2: Pareto chart of resolution between D-carvone and Anethol
Fig. 3: Pareto chart of resolution between Thymol and Cineol
Int. J. Pharm. Sci. Drug Res. October-December, 2014, Vol 6, Issue 4 (291-302)
Fig. 5: Counter desirability graph on CQA of oven Flow rate vs oven temperature
Fig. 6: Counter desirability graph on CQA of Thermostat time vs oven temperature
Table 5: The table lists the retention time of the marker and percentage present in the each Essential oil in assay
Essential oil compound Marker peak in standard solution (Minutes) Retention time of the pure marker Retention time of marker peak in individual oil (minutes) Assay (% of marker present in oil)
Coriander Linalool 11.82 11.84 69%
Peppermint Menthol 13.53 13.53 67%
Fennel Anethol 16.11 16.08 75%
Caraway D-Carvone 15.54 15.52 55%
Ajowan Thymol 17.15 17.15 53%
Cardamom Cineol 17.66 17.66 55%
Table 6: The table lists the system suitability parameter of the standard of blend of marker compounds in validation
Essential oil Plate count Tailing Resolution
Linalool 32382 1.3 NA
Menthol 23006 0.99 17.3
D-Carvone 21768 1.0 21.1
Anethol 19109 1.1 4.8
Thymol 17090 1.2 7.4
Cineol 13003 1.3 4.4
But in 2nd pareto chart (Fig. 3), positive dual interaction
as well as individual independent effect of three
variable was found on resolution between Thymol and Cineol.
The system suitability parameter majorly effect by flow rate, oven temperature followed by dual interaction between thermostat temperature with oven temperature, flow rate with thermostat temperature and flow rate with oven temperature. There was no effect due to individual thermostat temperature as well as mixed interaction of all three variables was found.
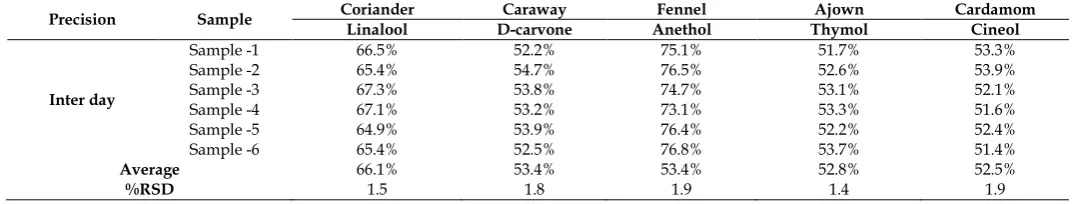
Table 7.1: The table lists the inter day precision
Precision Sample Coriander Linalool D-carvone Caraway Anethol Fennel Thymol Ajown Cardamom Cineol
Inter day
Sample -1 66.5% 52.2% 75.1% 51.7% 53.3%
Sample -2 65.4% 54.7% 76.5% 52.6% 53.9%
Sample -3 67.3% 53.8% 74.7% 53.1% 52.1%
Sample -4 67.1% 53.2% 73.1% 53.3% 51.6%
Sample -5 64.9% 53.9% 76.4% 52.2% 52.4%
Sample -6 65.4% 52.5% 76.8% 53.7% 51.4%
Average 66.1% 53.4% 53.4% 52.8% 52.5%
Int. J. Pharm. Sci. Drug Res. October-December, 2014, Vol 6, Issue 4 (291-302)
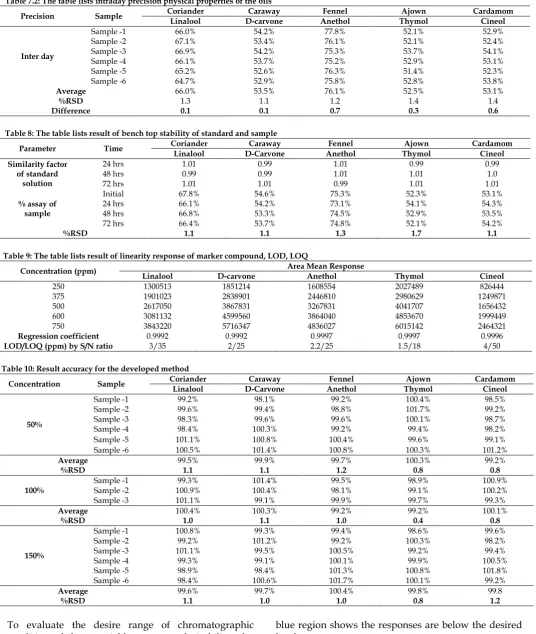
Table 7.2: The table lists intraday precision physical properties of the oils
Precision Sample Coriander Linalool D-carvone Caraway Anethol Fennel Thymol Ajown Cardamom Cineol
Inter day
Sample -1 66.0% 54.2% 77.8% 52.1% 52.9%
Sample -2 67.1% 53.4% 76.1% 52.1% 52.4%
Sample -3 66.9% 54.2% 75.3% 53.7% 54.1%
Sample -4 66.1% 53.7% 75.2% 52.9% 53.1%
Sample -5 65.2% 52.6% 76.3% 51.4% 52.3%
Sample -6 64.7% 52.9% 75.8% 52.8% 53.8%
Average 66.0% 53.5% 76.1% 52.5% 53.1%
%RSD 1.3 1.1 1.2 1.4 1.4
Difference 0.1 0.1 0.7 0.3 0.6
Table 8: The table lists result of bench top stability of standard and sample
Parameter Time Coriander Caraway Fennel Ajown Cardamom Linalool D-Carvone Anethol Thymol Cineol Similarity factor
of standard solution
24 hrs 1.01 0.99 1.01 0.99 0.99
48 hrs 0.99 0.99 1.01 1.01 1.0
72 hrs 1.01 1.01 0.99 1.01 1.01
% assay of sample
Initial 67.8% 54.6% 75.3% 52.3% 53.1%
24 hrs 66.1% 54.2% 73.1% 54.1% 54.3%
48 hrs 66.8% 53.3% 74.5% 52.9% 53.5%
72 hrs 66.4% 53.7% 74.8% 52.1% 54.2%
%RSD 1.1 1.1 1.3 1.7 1.1
Table 9: The table lists result of linearity response of marker compound, LOD, LOQ
Concentration (ppm) Area Mean Response
Linalool D-carvone Anethol Thymol Cineol
250 1300513 1851214 1608554 2027489 826444
375 1901023 2838901 2446810 2980629 1249871
500 2617050 3867831 3267831 4041707 1656432
600 3081132 4599560 3864040 4853670 1999449
750 3843220 5716347 4836027 6015142 2464321
Regression coefficient 0.9992 0.9992 0.9997 0.9997 0.9996
LOD/LOQ (ppm) by S/N ratio 3/35 2/25 2.2/25 1.5/18 4/50
Table 10: Result accuracy for the developed method
Concentration Sample Coriander Linalool D-Carvone Caraway Anethol Fennel Thymol Ajown Cardamom Cineol
50%
Sample -1 99.2% 98.1% 99.2% 100.4% 98.5%
Sample -2 99.6% 99.4% 98.8% 101.7% 99.2%
Sample -3 98.3% 99.6% 99.6% 100.1% 98.7%
Sample -4 98.4% 100.3% 99.2% 99.4% 98.2%
Sample -5 101.1% 100.8% 100.4% 99.6% 99.1%
Sample -6 100.5% 101.4% 100.8% 100.3% 101.2%
Average 99.5% 99.9% 99.7% 100.3% 99.2%
%RSD 1.1 1.1 1.2 0.8 0.8
100% Sample -1 Sample -2 100.9% 99.3% 101.4% 100.4% 99.5% 98.1% 98.9% 99.1% 100.9% 100.2%
Sample -3 101.1% 99.1% 99.9% 99.7% 99.3%
Average 100.4% 100.3% 99.2% 99.2% 100.1%
%RSD 1.0 1.1 1.0 0.4 0.8
150%
Sample -1 100.8% 99.3% 99.4% 98.6% 99.6%
Sample -2 99.2% 101.2% 99.2% 100.3% 98.2%
Sample -3 101.1% 99.5% 100.5% 99.2% 99.4%
Sample -4 99.3% 99.1% 100.1% 99.9% 100.5%
Sample -5 98.9% 98.4% 101.3% 100.8% 101.8%
Sample -6 98.4% 100.6% 101.7% 100.1% 99.2%
Average 99.6% 99.7% 100.4% 99.8% 99.8
%RSD 1.1 1.0 1.0 0.8 1.2
To evaluate the desire range of chromatographic condition of these variables, counter desirability plot were established as shown in Fig. 4, Fig. 5 and Fig. 6. These provided the assurance of desire acceptable result obtained in the range of the chromatographic condition of three variables in the desirable space. The red to yellow region in Design space graph indicates the responses are in acceptable range and the green to
blue region shows the responses are below the desired level.
Int. J. Pharm. Sci. Drug Res. October-December, 2014, Vol 6, Issue 4 (291-302)
chromatographic condition where maximum resolution between D-carvone- Anethol has been found.
It was found that, the region of desirability value 0.6 is the maximum desire space where the response was found in the desire level. On consideration of this space, the thermostat time 28 minutes to 32 minutes with respect to flow rate 1.0 ml/minutes to 1.3 ml/minutes is the desirable range of the chromatographic condition of these two variables. Similarly counter plot Fig. 5 demonstrate, the oven temperature can vary from 80°C to 90°C with flow rate 1.0 ml/minuets to 1.3 ml/minutes where the result will be in tolerable range.
From the Fig. 6 it has confirmed that the thermostat range from 28 minutes to 32 minutes with oven temperature 80°C to 90°C is the desire range of the true result when flow was constant.
From the above design plot it facilitated to calculate the chromatographic risk factor of the variable. It has also confirmed the design space inbetween multiple interaction of the varible in the acceptble responses. From the above design, it has proved that the selected chromatographic condition on each variable was lying in middle of the design space and has wide boundary and space. Hence the initial method was finalized and performed method validation.
Analytical method Validation
Method validation is the evidence of degree of tolerability of results of the precise method. The method validation was performed on selected above GC-headspace method by consideration of number of characteristics as System suitability, precision, specificity, linearity, LOD, LOQ establishment, accuracy and range.
System suitability
System suitability parameter was verified from the standard injection which was prepared by taken accurately weighed 5mg of each marker compound in 10 ml volumetric flask and volume made up with methanol used as diluent.
Precision
The precision assess of degree of reproducibility of analytical result. It is expressed by the result of relative standard deviation of six replicate preparation of sample. The method precision was had performed by six replicate preparation of blend of oil in a same concentration and injected in the chromatographic condition and calculated against the standard. The experiment was performed in PerkinElmer gas chromatography with headspace auto sampler.
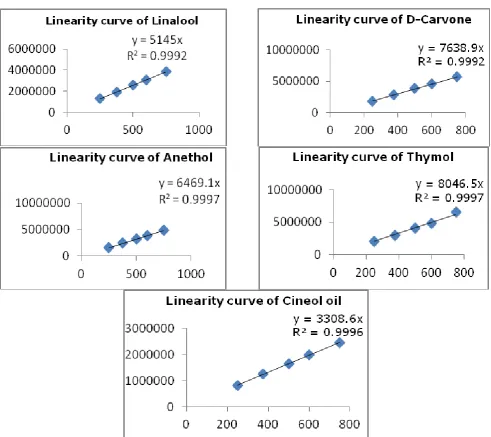
Linearity
The linearity of an analytical test method defines the ability of response are proportional to the amount of analyte present in the sample. It is measure by correlation of regression line under a specify range. To demonstrate the linearity of the method, a series of blend of standard solutions in triplicate was prepared in the range of 50% to 150% of the target assay concentration and inject into the GC system. The
regression curve was plot by Area (y-axis) vs Concentration (X-axis) and correlation coefficient (r2)
was calculated.
LOD and LOQ
Limit of detection and limit of quantification is the lowest amount of analyte can be detect and quantify in a stated chromatographic condition. Number of preliminary run was taken by prepared of individual lower concentration solution of each marker compound and S/N ration was checked from empower software where LOD was consider not less than 3 and LOQ was considered not less than 10. LOQ Precision was performed by prepared six replicate preparation of blend of standard marker in LOQ concentration level and run in the chromatographic system. The % relative standard deviation of the area of each marker compound was calculated.
Accuracy and range
Accuracy of an analytical method defines the degree of true value in a specified range. It was performed by the method of standard addition at three different levels, by multiple level recovery studies. Three levels of solution were made which correspond to 50, 100 and 150% of the nominal analytical concentration 0.5 mg/ml. Each lower level of 50% and higher level of 150% level was made in replicate six preparations and 100% level in triplicate preparations. These solutions were then analyzed for recovery studies and consistent values replicated preparation on each level were evaluated by calculating relative standard deviation. The range was considered from the % relative standard deviation of six replicate preparations of 50% and 150% level.
Ruggedness
The ruggedness indicates the degree of reproducibility of test results of the same sample analyze under variety of conditions such as different instruments, different temperatures, different days, etc. Precision test once again performed in different make Agilent gas chromatography with headspace auto sampler system. Bench top solution stability also established for 72 hours. The sample and standard was used in precision was kept on bench top and refrigerator and analyzed on day-1 and day-2.
Int. J. Pharm. Sci. Drug Res. October-December, 2014, Vol 6, Issue 4 (291-302)
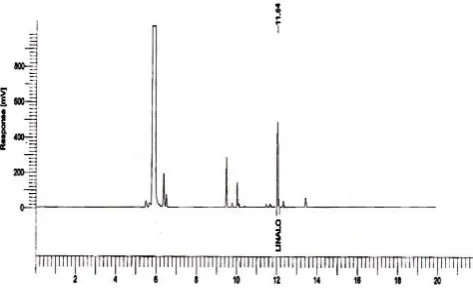
Fig. 7b: Typical chromatogram of coriander oil in assay preparation
Fig. 8a: Typical chromatogram of menthol in assay standard preparation
Fig. 8b: Typical chromatogram of peppermint oil in assay preparation
Fig. 9a: Typical chromatogram of marker compound of D-carvone in standard preparation
Fig. 9b: Typical chromatogram of caraway in assay preparation
Fig. 10a: Typical chromatogram of marker compound of anethol in standard preparation
Fig. 10b: Typical chromatogram of fennel oil assay preparation
Int. J. Pharm. Sci. Drug Res. October-December, 2014, Vol 6, Issue 4 (291-302)
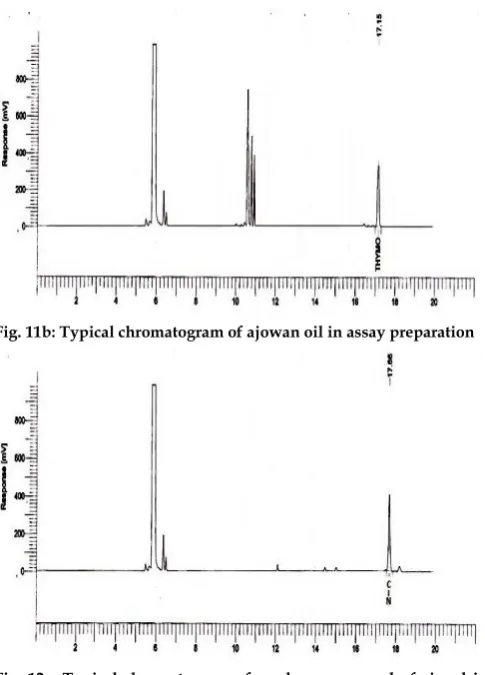
Fig. 11b: Typical chromatogram of ajowan oil in assay preparation
Fig. 12a: Typical chromatogram of marker compound of cineol in assay preparation
Fig. 12b: Typical chromatogram of cardamom oil in assay preparation
Fig. 13a: Typical chromatogram of system suitability solution of standard
Fig. 13b: Typical chromatogram of blend sample solution in precision
RESULT AND DISCUSSION
Physical characterizations of the oils that odor, color, refractive index and optical rotation had done and match with their specification available in the data bank & literature are tabulated in Table 4.
Mass spectrum of marker compound
The obtained Linalool mass m/z 154 [M+H], m/z 153 [M+H-H2],m/z 137 [M+H-H2O], D-ne mass m/z 151
[M+H], m/z 149 [M-H], m/z 137 [M+H] , m/z 123 [M+H], Anethol mass m/z 148 [M+H], m/z 135 [M+H], m/z 121 [M+H], Thymol mass m/z 151 [M+H], m/z 137 [M+H] , m/z 94 [M+H], Cineole mass m/z 155 [M+H], m/z 137 [M+H-H2O] +, m/z 111 [M+H-H2], has
identified by comparison of the obtained mass spectra of the peaks with those standards both reported in the literature and available in the data system library.
Identification and determination of purity of individual oil
The identification has made based on finger print comparison between the retention time of each marker peak present in individual oils with their respective marker compound. Linalool is a marker compound of Coriander oil. In the figure 7a Linalool peak was at about 11.84 minutes which is match with the Figure 7b of Coriander oil sample chromatogram. Like this in Figure 8a, 9a, 10a, 11a and 12a of menthol RT about 13.54 minutes, D-carvone at about 15.52, anethol 16.15 minutes, thymol 17.15 and Cineol 17.68 has match with figure 8b, 9b, 10b, 11b and 12b of peppermint, caraway, fennel, ajowan and cardamom oil sample chromatogram. Purity of the oil has determined from assay of individual oil based on the percentage of marker compound present in the respective oil are tabulated Table 5.
System suitability and Precision, Repeatability with intraday precision and Bench top stability
System suitability parameter was verified from the standard injection was tabulated in Table 5 and the chromatogram shown in Figure 13a.
Int. J. Pharm. Sci. Drug Res. October-December, 2014, Vol 6, Issue 4 (291-302)
assay of six replicate preparation of sample was found less than 2. Ruggedness of intraday precision, bench top stability results shows that the method is precise at any condition and the solution of sample and standard are sable up to 2 day.
Linearity, Limit of detection and quantification
The regression curve was plot by Area (y-axis) vs Concentration (X-axis) has shown in figure 14 and the r2 value was calculated and found 0.999 in all marker
compounds are tabulated in Table 9. LOD & LOQ result was verified based on the signal to noise ratio (S/N).
Fig. 14: Linear curve of the marker compound
Accuracy and range
The recovery and relative standard deviation for each of the analytes were calculated and noted down are tabulated in Table 10. From the recovery study it is evident that the method is highly accurate and can give true results from the range of 50% level to 150% level.
In the present study, an accurate and reliable analytical method for the identification and estimation of purity of active compounds of essential oil (Cineol, linalool, Anethol, D-Carvone, thymol) was established by GC-HS method coupled with FID. Good linearity, repeatability, intra-day and inter-day precision, accuracy and reliability were presented in the method validation procedure.
The proposed method makes the possibility to characterize of the compound from the multi component mixer compound with their marker compound in a shorter run time. Headspace is a modern technique that applied in the method to reduce the time of analysis as well as make accurate results. QBD base experiment design gives confidence on the method and it is a tool to prove the design space of critical parameter. Hence it is easy to determine the purity of the compound which gives a tool of analysis of herbal industry.
ACKNOWLEDGEMENTS
Int. J. Pharm. Sci. Drug Res. October-December, 2014, Vol 6, Issue 4 (291-302)
Uttar Pradesh, India and Rajiv Academy of Pharmacy, Mathura, Uttar Pradesh, India for providing research facilities throughout the project work.
REFERENCES
1. Sharmishtha P, Rittee N, Praveen D. Evaluation of antimicrobial and phytochemical screening of Fennel, Juniper and Kalonji essential oils against multi drug resistant clinical isolates. Asian Pacific Journal of Tropical Biomedicine 2012; S1625-S1629.
2. Olivera P, Mila J, Mladen M. Chemical Composition and Antioxidant Activity of Essential Oils of Twelve Spice Plants. Croat. Chem. Acta. 2006; 79(4): 545-552.
3. Alpha GR, Kamat SD, Kamat DV. Antifungal Activity of Essential Oils against Fluconazole Resistant Fungi. International Journal of Phytomedicine 2011; 3: 506- 510. 4. Darughe F, Barzegar M, Sahari MA. Antioxidant and
antifungal activity of Coriander (Coriandrum sativum L.) essential oil in cake. International Food Research Journal 2006; 19(3): 1253-1260.
5. Jeane S, Worku A, Sousa SM, Duarte VG, Machado MIL, Matos FJA. Analgesic and anti-inflammatory effects of essential oils of Eucalyptus. Journal of ethnopharmacology 2003; 89: 277–283.
6. El-Metwally EM. Evaluation of Antiulcer Activity of Ginger, Clove and Castor Oils against aspirin induced gastric ulcers in rats. World Applied Sciences Journal 2014; 29 (7): 815-824. 7. Philip JM, Robert S, Charles C. Gas chromatographic
technologies for the analysis of essential oils. Journal of Chromatography A 2001; 936: 1–22.
8. Luigi M, Alessandro C, Peter QT, Rosaria C, Paola D, Giovanni D. Fast GC for the Analysis of Citrus Oils. Journal of Chromatographic Science 2004; 42: 410-416.
9. Mehdi H, Zeinab B, Saeide S, Yasub S. Antimicrobial activity of Trachyspermum ammi essential oil against human bacterial. International journal of Advanced Biological and Biomedical Research 2014; 2(1): 18-24.
10. Filomena S, Susana F, Joa o AQ, Fernanda CD. Coriander (Coriandrum sativum L.) essential oil: its antibacterial activity and mode of action evaluated by flow cytometry. Journal of Medical Microbiology 2011; 60: 1479–1486.
11. Wen RD, Qing PH, Hong ZA, Jian GX. Chemical
composition, antibacterial activity and mechanism of action of essential oil from seeds of fennel (Foeniculum vulgare Mill.). Food Control 2014; 35: 109-116.
12. Keshavarz A, Minaiyan M, Ghannadi A, Mahzouni P. Effects of Carum carvi L. (Caraway) extract and essential oil on TNBS-induced colitis in rats. Research in Pharmaceutical Sciences 2013; 8(1): 1-8.
13. Rathore SS, Saxena SN, Balraj S. Potential health benefits of major seed spices. International Journal Seed Spices 2013; 3(2): 1-12.
14. Mi Kyoung L, Jun HL, Mi-Hee C, Jin-Hyun J, Yoon-Cheol N, Kwang-Won L, Jee HJ, Jongki H. Simultaneous Determination of Biological Marker Compounds in Ostericum koreanum by HPLC Method and Discrimination by Principal Component Analysis. Bulletine Korean Chemical Socity 2008; 29(12) 2465 – 2470.
15. Md. Rafiul H, Ansari SH, Abul KN, Kamran JN. Validated HPTLC analysis method for quantification of Thymol content in trachyspermum ammi and polyherbal unani formulation arq zeera. International Journal of Pharmacy and Pharmaceutical Sciences 2012; 4(3): 478-482.
16. Joanet M, Guy K, Simon G, Alvaro V, Sandy VV. The application of GC–MS combined with chemometrics for the identification of antimicrobial compounds from selected commercial essential oils. Chemometrics and Intelligent Laboratory Systems 2014; 130: 172–181.
17. Janka V, Alena B, Zuzana C. In-house validation of a simple headspace gas chromatography mass spectrometry method for determination of furan levels in food. Journal of Food and Nutrition Research 2007; 46(3): 123-127.
18. Naser M, Khalil P, Zahra B, Safar AD. Essential Oil Analysis by Headspace Solvent Microextraction coupled with Hydro-Distillation Method (HD-HSME) of Rosmarinus officinalis L. from Noshahr, Iran. Oriental Journal of Chemistry 2011; 27(4): 1317-1324.
19. Guilherme V, Julio SM, Alceu AJ. Validation of a manual Headspace Gas Chromatography method for determining volatile compounds in biological fluids. Labmedicine 2008; 39(1):42-45.
20. Devesh AB, Smita IR. QbD approach to analytical RPHPLC method development and its validation. International Journal of Pharmacy and Pharmaceutical Sciences 2011; 3(1):179-187. 21. Karmarkar S, Garber R, Genchanok Y, George S, Yang X,
Hammond R. Quality by Design (QbD) Based Development of a Stability Indicating HPLC Method for Drug and Impurities. Journal of Chromatographic Science 2011; 49:439-446.
22. Raghava RTV, Raja KS, Mrutyunjaya R, Someswara RN. Development and validation of a stability indicating HPLC method for the estimation of rabeprazole impurities in pharmaceutical dosage forms by design of experiments. Asian Journal of Pharmaceutical and Research 2013; 6(4):43-51.
23. Deveshri B, Narkhede PD, Ravindra RP. Analytical method validation of gas chromatographic Method for the estimation of related substances in Trimethyl Otho Propionate. International Journal of Pharma and Bio Sciences 2010; 1(2): 1-24.
24. Nikhil G, Amit KG, Rajesh KS, Karan M, Rath G. Method development and validation for the GC assay of á-pinene in tea tree oil Formulation. Pharmacia. 2012, 1(3): 102-106
25. ICH, Q8 (R2). Pharmaceutical Development, International Conference on Harmonization 2009.
26. ICH, Q2 (R1).Validation of Analytical Procedures: Text and Methodology, International Conference on Harmonization 2005.