Page 40 www.ijiras.com | Email: [email protected]
The Influence Of pH On The Compressive Strength Of Concrete
Benjamin Boahene Akomah
Emmanuel Nana Jackson
Department of Building Technology, Cape Coast Technical University, Cape Coast, Ghana
I. INTRODUCTION
Concrete is one of the most complete construction materials. It can be moulded into any shape with the help of a mould. What makes it so useful in construction is its flexibility of handling. Concrete as a material is composed of a binder, aggregates water and sometimes admixtures depending on the intended aim. Concrete solidifies and hardens after mixing with water and placement due to hydration and eventually becomes a stone-like material. Different types of concrete can be produced by varying the mix proportions of the main ingredients (Ata, 2014). However, one special ingredient that cannot be underestimated in concrete production is water. It is an indispensable component. According to (Neville and Brooks, 2010) the quality of water used for concrete production is water that is fit for drinking. Such water according to experts rarely contains dissolved solids in excess of 2000 parts per million (ppm).
II. RESEARCH PROBLEM
Ghana is endowed with fresh water in different parts of the country. Water fit for drinking has been the popular yardstick for the suitability of water for mixing concrete and
in most cases in Ghana that water is referred to treated water. Raw water from streams, wells, boreholes and rivers may be portable for drinking by a particular group of people but the same may not be the case for another group. Therefore, the term portable is relative. Individual developers and some firms use the different sources of water stated above for concrete production without considering the influence of such sources on the overall performance of the concrete elements produced. But the truth is that, the strength and durability of concrete can be impaired by the pH of the water used for its production. Monteiro and Mehta (1999) stated that, any water with pH value less than 12.5 may be aggressive. This is as a result of the reduction in alkalinity of the pore fluid leading to the removal of the cementitious material. When the permeability of concrete is less and the pH of the fluid is above 6, the rate of chemical attack is too slow. Meanwhile, testing the pH of water before it is used for concreting activities is not a practice in Ghana because the belief is that every water used for concrete production is fit production.
III. AIM
The paper seeks to determine the influence of the pH of water on the compressive strength of concrete.
Abstract: Concrete is a very useful construction material and one essential component for its production is water. A combination of water and cement creates a paste that binds other components used in the concrete production. The use of impure water for concrete can harm the setting process and have debilitating effect. The study aims at determining the pHs of the six different sources of water used for the concrete specimen and ascertain the influence of the water sources on their compressive strengths. The study was purely laboratory base and quantitative. The highest pH was recorded by the sea water (8.12 pH units) while the Amissano well water recorded the least pH of (4.96 pH units). The compressive strengths of the concrete specimen produced from the Aquarium and Amissano well were lower than the others.
Page 41 www.ijiras.com | Email: [email protected] IV. CONCRETE
Concrete is a composite material which is very strong and versatile. Concrete can be moulded into different shapes.
It contains fine, coarse aggregates and a binder (usually Portland cement). The cement mixed with water forms a binding matrix which fills the space between the aggregates. Concrete is strong in compression (Ede and Aina, 2015) but weak in tension. The strength of concrete can be affected by many factors such as the quality of raw materials used for the production, the water/cement ratio, coarse/fine aggregate, aggregate/cement ratio, age of concrete, compaction, temperature, relative humidity and curing, shape, size and texture of aggregate, concrete mix, rate of loading, age of the cement, gel-space ratio, maximum size of aggregate and porosity (The Constructor, 2017 and Anre, 2017).
V. pH OF WATER
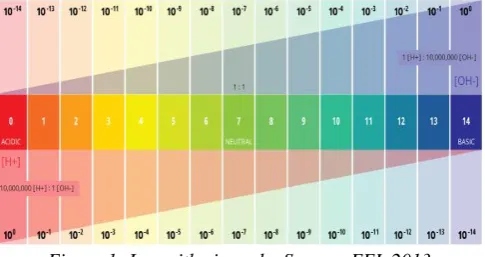
Water is made up of one oxygen atom and two hydrogen atoms (University of Arizona, 2003). It plays a very important role in concrete. There are different sources of water with varying pHs. It is a measure of acidity or alkalinity of water soluble substances (WebFinance Incorporated [WFI], 2018). pH is an established value that is based on a defined scale and not a physical parameter that can be measured as a concentration or in a quantity but a figure between 0 and 14 which defines the acidity or alkalinity of a body of water along logarithmic scale (Fondriest Environmental Incorporated [FEI], 2013). A pH of 7 is considered neutral. A lower number than 7 on the logarithmic scale connotes acidity while a higher number above 7 indicates alkalinity. The acidity of water increases as its pH decreases. On the other hand, the alkalinity of water increases as the number on the logarithmic scale increases. The logarithmic scale means that each number below 7 is 10 times more acidic than the previous number when counting down and when counting up above 7, each number is 10 times more basic than the previous number (WFI, 2018 & FEI, 2013). The pH can be affected by natural and man-made actions. It changes as a result of interactions with surrounding rock (particularly carbonate forms) and other materials. pH also fluctuate with precipitation (especially acid rain) and wastewater or mining discharges (FEI, 2013).
Figure 1: Logarithmic scale. Source: FEI, 2013 The rate of chemical attack on concrete is determined by the pH of the water used and the concrete permeability. When the permeability of concrete is less and the pH of the fluid is
above 6, (Monteiro and Mehta, 1999) say the rate of chemical attack is too slow.
VI. RESEARCH METHODOLOGY
The study was purely experimental. Water sources were sent to the Ghana Water Company Limited for physicochemical analysis to determine the various chemical compositions of the before they were used. Concrete cubes were produced using fine, coarse aggregates, Portland cement (GHACEM 32.5R) and six different sources of water. Grading was achieved using sieve sizes ranged from: 37.5 mm to 5.00 for the coarse aggregates and 4.75mm to 63μm for fine aggregates. River sand was used as fine aggregates and crushed granites as coarse aggregates. All unwanted materials from both fine and coarse aggregates were first removed. Thereafter, silt test was performed on the sand with the aid of cylindrical glass equipment to determine the percentage of silt present in the sand. The aggregates (coarse) were sieved using shaker vibrator machine to determine the maximum size within the all-in aggregates used in the study. Batching was done by weight using digital weighing scale while thorough mixing of the various constituents of concrete was realized using concrete mixer with designed ratio of 1:2:4. Compacting factors tests and slump tests were carried out with the help of a compacting factor test equipment and a conical slump test equipment. Each test was performed three times to establish an average test result. Concrete specimen were produced using six different sources of water (namely: 3 different well water sources – Aquarium (AQWW), Kakumdo (KWW) and Amissano (AWW), sea water (SW), Kakum river water (KRW) and treated water - pipe borne water (PBW). Concrete was cast into steel mould boxes of size (150mm x 150mm x 150mm) and compacted using needle poker vibrator. The fresh concrete specimen remained in the mould for twenty-four hours to form a cube after which the moulds were removed. The cubes were cured using wet method (immersion) in the specific water used for mixing for 7days, 14days, 21days, and 28days. The concrete cubes before testing for their compressive strengths were weighed using digital weighing machine. Actual testing for compressive strength was done using digital compressive test machine. In all, 72 specimen were produced and tested. Each water source produced 12 samples with 3 going for each curing age.
VII.RESULTS A. MATERIAL CHARACTERISTICS
The mix proportion for the production of the cubes was 1:2:4. The weights of the materials according Table 1 are as follows: coarse aggregates 120kg, fine aggregates 60kg, Ordinary Portland cement 30kg and water 15kg.
Constituent Materials Proportion by Weight (kg) Quarry Chippings (coarse aggregates) 120
Page 42 www.ijiras.com | Email: [email protected] Ordinary Portland Cement
(GHACEM 32.5R)
30 Various water (Kakum river, sea, pipe
bond water, Amissano well, Kakumdo well and aquarium well)
15 Table 1: Concrete Mix Proportions
B. SILT TEST
Table 2 gives the results of the silt tests that were conducted. Sample test one (T1) had 5.88% silt whiles (T2) and (T3) had 4.41% silt respectively. The average silt percentage for the three tests was 4.90%. This means that the amount of silt that was present in the fine aggregates used within the range of 6% which is acceptable by IS 2386 part II – 1963. Sample
Test
Description Silt
Percentage Average Silt Percentage (%) 5.88 = 4.90 4.41 4.41 Table 2: Silt Test Result
C. SIEVE ANALYSIS FOR COARSE AGGREGATES All the 10mm - 20mm coarse aggregates sample measuring 1.500kg that was sieved went through the 37.5 and 28 mm sieves, 1.020kg representing (68%) was retained on the 20mm sieve; (17.33%) that is 0.260kg was retained on the 14mm whiles 0.220kg representing (14.67%) was retained on the 10mm sieve. The 14mm-5mm sieves recorded a cumulative percentage passage of zero. The aggregates size that was more in this all-in aggregates sample used for the concrete cubes was 20mm, followed by 14mm and then 10mm. S iev e siz es (m m ) Weig h t o f sie v e (k g ) Weig h t o f sie v e + Ag g re g ates (Kg ) Weig h t re tain ed (Kg ) P erc en tag e re tain ed (% ) Cu m u lativ e p erc en tag e p ass in g ( % ) Cu m u lativ e p erc en tag e re tain ed (% )
37.5 0.639 0.639 0 0 100 0
28 0.675 0.675 0 0 100 0
20 0.601 1.621 1.020 68 32 68
14 0.497 0.757 0.260 17.33 14.67 85
10 0.516 0.548 0.220 14.67 0 100
9.5 0.512 0.512 0 0 0 100
6.3 0.507 0.507 0 0 0 100
5 0.500 0.500 0 0 0 100
Table 3: Sieve Test of Coarse Aggregates
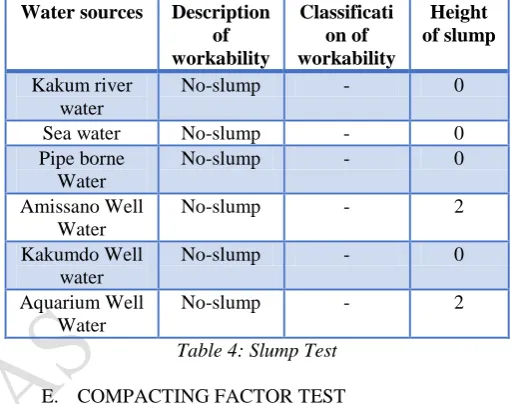
D. SLUMP TEST
The measure of the workability of the fresh concrete produced with the six different sources of water as depicted in Table 4 revealed no-slump for the Kakum river water, sea water, pipe borne water and Kakumdo well water. According to ACI’s cement and concrete terminology (ACI 11 6R-90) the concrete produced from these four sources were stiff or extremely dry and that is why they showed no measurable slump after the removal of the cone. The stiffness of the
concrete may have resulted from the water/cement ratio used. On the other hand, concretes produced with water from Amissano well water and the Aquarium well water each recorded a true slump of 2mm. The decrease in height of the slumped concrete was measured to the highest point of the cone. Even though, there was a slump of 2mm in the case of both the concrete produced from the Amissano and Aquarium well water, this slump can be described as no-slump according to BS EN. The descriptions of workability for these two concrete could not be classified even as S1 under BS EN, 2009. This is because a slump classification of S1 ranges from 10-40mm.
Water sources Description of workability Classificati on of workability Height of slump Kakum river water
No-slump - 0
Sea water No-slump - 0
Pipe borne Water
No-slump - 0
Amissano Well Water
No-slump - 2
Kakumdo Well water
No-slump - 0
Aquarium Well Water
No-slump - 2
Table 4: Slump Test
E. COMPACTING FACTOR TEST
According to Table 5, the water source which recorded the highest compacting factor was Kakum river water with a compacting factor of 0.87, followed by the pipe borne water and Aquarium well water with a CF of 0.85. The Amissano well water recorded 0.84 and came fourth. The sea water and the Kakumdo well water came fifth and sixth with compacting factors 0.83 and 0.81 respectively. The average compacting factor for all six different sources was 0.84. The average compacting factor calculated describes the concrete produced for the study as one with low workability. The only water source whose workability description was medium was the Kakum river water, the rest were all low.
Table 5: Compacting Factor Test Water sources Compacting
factor
Description of workability
Sea water 0.83 Low
Pipe borne water 0.85 Low
Kakum river water
0.87 Medium
Kakumdo well water
0.81 Low
Aquarium well water
0.85 Low
Amissano well water
0.84 Low
Average compacting factor for all
sources
Page 43 www.ijiras.com | Email: [email protected] 0
5 10 15 20 25 30
7 days 14 days
21 days
28 days
C
o
m
p
re
s
s
iv
e
s
tr
e
n
g
th
Test age
Kakum River
Sea Water
Pipe Borne Water
Amissano Well Water
Kakumdo Well Water
Aquarium Well Water
F. pHS OF WATER SOURCES
Out of the six water sources used for the study, four of them namely; the Kakum river water, pipe borne water, sea water, and Kakumdo well water all had their pHs within the acceptable range of 6.5 - 8.5 pH units recommended by the World Health Organisation [WH], (2011). However, the Amissano and Aquarium well water had their pH units falling outside this range. The sea water recorded the highest pH with the Amissano well water recording the least. The Amissano and Aquarium well water were found to be more acidic but the acidity of the Amissano water was higher than that of Aquarium. The Kakum River water, the pipe borne water and the Kakumdo well water were also considered acidic based on the classification given by logarithmic scale but their acidity was less than the two mentioned earlier because their readings were near neutral. The sea water on the other hand was alkaline.
Water Source pH of Water
Acceptable 6.5 – 8.5 Within
Range
Outside Range Kakum river
water
6.73
Pipe borne water 6.76
Sea water 8.12
Aquarium well water
5.71
Amissano well water
4.96
Kakumdo well water
6.89
Table 6: pH of Water Sources
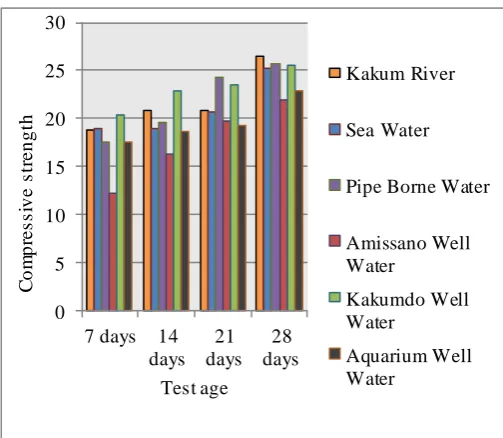
G. COMPRESSIVE STRENGTH AT 7 DAYS
The average compressive strength (ACS) of the three concrete samples produced and cured using the Kakum river water was 18.846N/ as depicted in Figure 1. The sea water concrete recorded 18.970N/ with the pipe borne water recording an ACS of 17.575N/ . The Amissano well water concrete recorded an ACS of 12.173N/ , Kakumdo well water recorded 20.339N/ , with the Aquarium well water registering 17.552N/ The Amissano well water recorded the least ACS. On the other hand, the highest ACS was recorded by the Kakumdo well water. The low ACS recorded by the Amissano well water at 7 days may be due to the high acidity of the water. Even though the Aquarium water and Amissano water were all acidic, the ACS difference between the two was 5.379 N/ , which proves that the more the pH of the Amissano water fell below 5, the more acidic it became. The acidity of the water had influence on its early strength development when it is compared to all other sources.
Figure 1: Compressive of water sources at different ages
H. COMPRESSIVE STRENGTH AT 14 DAYS
The ACS of concrete produced from the Kakum river and tested at age 14 days was 20.797N/ , the sea water and the pipe borne water recorded 19.000N/ and 19.533N/ respectively. The Amissano well water produced an ACS of 16.212N/ with the Kakumdo well water recording 22.909N/ The Aquarium well water on the other hand produced an ACS of 18.576N/ . The ACS of the Amissano well water produced the least strength. But the strength gained was more significant. There was a strength increase of 4.039 N/ . The sea water recorded the least increase after 14 days of curing. Increase in ACS was only 0.03 N/
I. COMPRESSIVE STRENGTH AT 21 DAYS
After 21 days of curing, the Kakum river water recorded an ACS of 20.872N/ ,sea water registered 20.743N/ whiles the pipe borne water and Amissano well water recorded 24.304N/ and 19.736N/ respectively. The Kakumdo well water registered an ACS of 23.567N/ with the Aquarium well water recording 19.242N/ . The pipe borne water recorded the highest increase in strength. The Amissano well water specimen still made significant progress in terms of its strength increase. However, after 21 days the Kakum River water sample recorded the least ACS increase. The strength increase for the pipe borne water and the Amissano well water were more significant than all the others. The Kakumdo well water and the Aquarium well water samples increase were almost the same. The strength difference was recorded as 0.008 N/ .
J. COMPRESSIVE STRENGTH AT 28 DAYS
Page 44 www.ijiras.com | Email: [email protected] 25.702N/ respectively. The Amissano well water
concrete specimen registered 21.873N/ , the Kakumdo well water had 25.484N/ with the Aquarium water recording 22.861N/ . All the specimen produced using the various sources of water recorded significant average strength after curing for 28 days. After 28 days, the Kakum river water sample recorded the highest average strength, followed by the pipe borne water, Kakumdo well water, sea water, Aquarium well water and the Amissano well water. The acidity levels of Aquarium well water and Amissano well water really impacted their strength achievement in the end. The highly acidic water (Amissano well water) recorded the least overall ACS.
VIII. CONCLUSIONS
The study concludes after analysing all test results that: The compressive strengths of the concrete specimen used revealed lower strengths for concrete produced from the Aquarium and Amissano well water. The lower strengths may be attributed to the high acidity of the water sources. The acidity of these two sources is higher than the other four sources. Whiles the Aquarium water was 10 times higher than the other four sources, the Amissano water was 20 times higher. The 10 times basic nature of the sea water did not actually influence its strength when it is compared with other sources of water.
Out of the three well water sources used, the Kakumdo well water recorded a higher ACS than the other two after 28 days of curing. It recorded ACS of 25.484 N/ as compared to the Amissano well water which registered 21.873 N/
The overall strength performance of the Kakum river water specimen was better than the other sources, registering an ACS of 26.439 N/
IX. RECOMMENDATIONS
The study recommends that, water sources should be tested to ascertain their pHs before they are used for concrete production. This is because water with a high pH can have detrimental effect on the strength properties of concrete which may result in strength decline as depicted by the results of the study.
REFERENCES
[1] American Concrete Institute. (1994). American Concrete Institute ACI 116R-90: Manual of Concrete Practice Part 1 - Cement and Concrete Terminology, Materials and General Properties of Concrete. Michigan, USA: American Concrete Institute
[2] Anre, A. (2017). Top 15 factors affecting the strength of concrete. Retrieved from http://www.civilprodyogi.com [3] ATA, O. (2014). Effects of Different Sources of Water on
Concrete Strength: A Case Study of Ile-Ife. Civil and Environmental Research, 6(3):39-43.
[4] Ede, A. N., & Aina, A. O. (2015). Effects of Coconut Husk Fibre and Polypropylene Fibre on Fire Resistance of Concrete. International Journal of Engineering Sciences and Management, 5(2), 171-179.
[5] Fondriest Environmental Incorporated (2013). Fundamentals of Environmental Measurements. Retrieved from http://www.fondriest.com/environmental-measurements/parameters/water-quality/ph/
[6] Monteiro, P. J. M., & Mehta, P. K. (1999). Concrete microstructure, properties and materials, (3rd.). United States, McGraw-Hill publication.
[7] Neville, A. M., & Brooks, J. J. (2010). Concrete Technology, (2nd ed.). England, Longman.
[8] Standards British. (2009). British Standards BS EN 12350-2: Testing Fresh Concrete. London, United Kingdom: British Standard Institution.
[9] Standards Indian. (1997). Indian Standards IS 2386 Part II: Methods of Test for Aggregates for Concrete, Estimation of Deleterious Materials and Organic Impurities. New Delhi, India: Bureau of Indian Standards. [10]The Constructor (2017). Factors affecting the strength of
concrete. Retrieved from
https://theconstructor.org/concrete/factors-affecting-strength-of-concrete/6220/
[11]University of Arizona (2003). The Biology project: the chemistry of water. Retrieved from http://www.biology.arizona.edu/biochemistry/tutorials/ch emistry/page3.html
[12]WebFinance Incorporated (2018) – pH scale. Retrieved