Abstract— Nowadays concerns about climate change and greenhouse effect are increasingly heard around the world. Alternative energy sources to fossil energies show themselves one of the ideal solutions to these issues. However, the use of green energies (solar, wind …) is hardly a perfect solution if it is not done in an intelligent way. Furthermore, environmental pollution is not the only solicitude which requires a better energy management. The betterment of our daily well-being implies a greedy energy consumption. This drives up the price of energy, hence the necessity of seeking an effective way to optimize the daily use of energy. To deal with this, the work presented in this paper introduces a new energy management strategy based on two things: the use of both energy storage means as backup when energy lacks, and the bin packing algorithm as an energy allocation strategy. To foreground the contribution of our solution, elaborated simulations were conducted based on measurements made on several households located in Casablanca, Morocco.
Index Terms— energy as a service; photovoltaics; energy storage systems; bin packing; microgrid.
I. INTRODUCTION
The today’s world encounters an immeasurable number of challenges. Among these challenges we find the greenhouse effect which directly impacts on the daily lives of people around the world, their behavior, their fear of things… [1], [2]. Combined with rapid population growth in the world, the desire to improve their standard of living and other phenomena such as industrial development, major changes in the energy landscape can only be topical [3], [4]. All this has since initiated the modernization of the power grid by integrating new technologies into the grid [5].
Manuscript received July 10, 2016. This work was supported by GREENTIC, a non-profit organization created with the support of the University Hassan II Casablanca and the Hassan II Foundation for Moroccan
in 2010.
N. Benjamin SENDAMA is with RTSE/ENSEM at the University Hassan II Casablanca, Morocco, phone number: +212 656 989 721; e-mail:
sendama.benjamin@ gmail.com.
Aawatif HAYAR was with EURECOM’s Mobile Communication Department in Sophia Antipolis, Nice, France. She is now with the Department of electronics and telecommunication at ENSEM, University
Hassan II Casablanca, Morocco, e-mail: [email protected]
The overwhelming increase in energy consumption caused by those changes in the energy landscape has thus increased the price of electricity [6]. This energy scarcity or/and expensiveness urges us to seek an effective way to manage our energy resources. In this sense, sustained work is needed to guarantee a good energy management, and this in light of the fact that energy is no longer seen as a product, but rather as a service (energy as a service or EAAS) [7].
As a matter of course we did extensive research in the field of energy allocation. An inquiry in the literature indicates that a substantial work has been done in this regard. In [8]– [10] authors consider this difficulty as a multi-objective optimization problem. They propose a solution involving more than one objective function to be optimized simultaneously (for example minimizing investment cost, minimizing the electrical bill, maximize CO2 reduction, maximize investment returns). As to [11], they suggest the use of the Vickrey-Clarke-Groves mechanism to uplift the social welfare of the population. Their solution is to benefit both utility companies and their subscribers. By using batteries, [12]–[14] present a way to capitalize on these components to control the energy consumption inside a house and thus minimize the electrical bill.
Accordingly by taking advantage of a heterogeneous environment of energy resources, where energy from hydraulic, solar, wind and a potential insertion of fuel cell vehicles (FCVs) mix, it is in line with our earlier work that we improve the idea already introduced in [15] to propose a new way not only to allocate energy within one house, but also to manage energy flow between components of a given portion of a power grid. This solution is based on algorithms solving the bin packing problem, which is actually a partition problem. The bin packing problem is formally defined as a way to find a partition and assignment of a set of objects such that a constraint is satisfied or an objective function is minimized (or maximized) [16]. Since these algorithms fall within the operations research and combinatorial optimization, applied to a smart grid, they turn out to be an interesting solution in energy management.
However, as it has been mentioned above, all this is only possible by considering the actual power grid as a smart grid, evolving over time and needs. For this, it is assumed that our power grid includes smart elements (smart metes, smart houses, smart loads, electric vehicles…), and is centered on an
Combining Energy Storage Systems and New
Energy Allocation Strategy Based on the Bin
Packing Algorithms for QoS in EAAS Concept
in Smart Grids.
architecture based on the control/monitoring/supervision of both energy production and distribution, and on the basis of the data/measurements/reports collected throughout the grid.
To reach our goals we proceeded in this way: In section II we present the system model. By a certain number of equations, we formulate a mathematical model describing the energy flow all along a power grid. Then in section III we describe our energy management strategy. It is in this section we develop our solution whose objective is to optimize the utility function introduced in section II. We also present/discuss the results that can be achieved after implementing our solution. Finally, in section IV we end our work with a brief conclusion that sums up well our contribution in this research area.
II. SYSTEM MODEL
In this paper, we consider a microgrid (a small portion of a power grid) which is a localized grid that can disconnect from the traditional grid to operate autonomously if it is self-sufficient in terms of energy needs. Its own energy sources include solar, wind, batteries, and FCV energy. This microgrid mainly connects the residential homes/apartments of the same neighborhood. This is shown on the Figure 1.
Fig. 1. A simplified representation of a Microgrid.
Considering only the energy flow problematic on this microgrid, it is clear that energy consumed at a given point i equals to the energy produced at same point i, plus the energy produced elsewhere, obviously after suffering losses during transport. This is to say that in terms of energy flow, our system includes multiple inputs, multiple outputs and multiple paths that energy borrows to get from one point to another. Thus, the energy mix at different houses is written as follow:
[ ] [
] [ ] [ ]
Which can be also written as follow:
Where, for , column vectors and stand respectively for the energy consumption and the energy production at the house i. is a weighting factor that
represent the line loss due to the energy transmission throughout the microgrid, subjected to:
In fact, if the produced energy at the house i exceeds the house needs, the surplus will be injected on the microgrid to compensate elsewhere energy needs. If it is the needs that surpass the energy produced, the house i is fed by extra energy produced from neighboring houses.
Finally the last column vector corresponds to the energy provided from the main grid (outside of the considered microgrid). This happens when the total energy produced at the microgrid is not enough to meet the needs of different houses i of the microgrid.
Fig. 2. The microgrid’s elements and energy flow.
The Figure 2 helps to understand the elements of the Formula (1). Moreover, to bring this out, here are some examples of some weighting factors:
: Inversely proportional to line loss from A to A. : Inversely proportional to line loss from E to A. : Inversely proportional to line loss from B to C. : Inversely proportional to line loss from C to B. : Inversely proportional to line loss from D to
A.
It is clear that = . This makes a symmetric matrix, whose diagonal elements equals to 1 (they represent both the production and the consumption of energy at the same house: this means that there is no line loss).
A. The energy production
Our paper aims to study a microgrid which covers about a thousand of households. Of course all the houses are not equipped with necessary equipment to produce their own energy. As our study relies precisely on the city of Casablanca in Morocco, our approach is based on our work done in [15] and, in order to refer to the common PV installations in households, we assume that houses that produce energy feature solar panels of 1.5 to 3 kW, i.e. 7 to 20 m² of panels surface [17]. Each panel has a theoretical power peak of 3 kWp within standard conditions [18]. But this is much less than what would be produced for real installation [19].
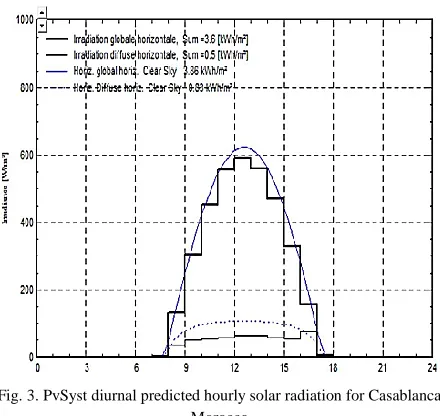
the site covered by our microgrid. To do so, we used a complete photovoltaic simulating software PVSyst [20].This software provides a feature where you can choose a covered geographical position. In our case it is Casablanca, Morocco whose geographical coordinates are 33°65'N07°26'W. The Figure 3 represents the solar potential of this area. It is the amount of energy available per square meter per day (Wh/m2*day) with which we started our modeling our system.
Fig. 3. PvSyst diurnal predicted hourly solar radiation for Casablanca, Morocco.
The platform [21] also consolidates this study on the energetic potential of the Casablanca area, Morocco. On the basis of equation (4) and from the diurnal predicted hourly solar radiation, we can calculate the amount of energy that can be provided by one house.
Where the parameters are: is the photovoltaic field surface is the efficiency of the PV module used is the diurnal predicted hourly solar radiation is the loss coefficient (varies between 0.7 and 0.8)
Assuming that the energy produced by each house differs from another depending on the photovoltaic field surface, Table 1 gives some examples of the amount of energy produced as a function of the photovoltaic field surface and time.
Table I
Energy production as function if the photovoltaic field surface and time.
8am-9am 12am-1pm 4pm-5pm
7 m² 205.8 Wh 411.6 Wh 102.9 Wh 10 m² 294 Wh 588 Wh 147 Wh 12 m² 352.8 Wh 705.6 Wh 176.4 Wh 15 m² 441 Wh 882 Wh 220.5 Wh 18 m² 661.5 Wh 1323 Wh 264.6 Wh 20 m² 735 Wh 1470 Wh 294 Wh
B. Estimation of energy needs
We completed our study on houses belonging to the middle class, so that our model can be as faithful as possible to the Moroccan reality [22]. So houses considered here each of them consists of a living room, two bedrooms, a bathroom and a kitchen. To estimate the energy consumption of such a house, a meticulous monitoring on a dozen house was made over a week to observe the use duration of all electric appliances in each house’s room.
Table II
List of average appliances used in a house and their daily average energy consumptions.
Nber Appliances Power Daily
use
Daily energy
8 Lamps 20W/lamp 7h/day 1120Wh
2 TV/ PC/ Mobile
200W/app. 6h/day 2400Wh
1 Domestic appliances
600W/app. 4h/day 2400Wh
2 Fridge / Deep-freeze
0.80KW/day 24h/day 1600Wh
1 Dish / Cloth-washers
1000W aver 2h/day 2000Wh
1 Ventilation 100W/app. 24h/day 2400Wh
1 Microwave / Coffee maker
1000W/app. 1.5h/day 1500Wh
Stand-by consumers 10W total 24h/day 240Wh
Total daily energy 13660Wh/day
Relying on the PVSyst software, values found in Table 1 give us a general view on the daily global energy consumption of a house i among n other houses of the microgrid, over a 24 hour period. Thus the intended time cycle for all the system’s operation is divided in 24 time slots, in accordance with hours of a full day (day and night).
Fig. 4. Definition of daily consumption for summer in Casablanca.
C. The energy storage system
Among the n houses of the microgrid, those who are equipped with solar panels to generate power are therefore equipped with a battery energy storage system (BESS) in order to store energy for later use (usually at night). A working principle of a photovoltaic and its characteristic is well describe in [23]. For this, our study was based on a
lithium-ion battery of 7 kWh of storage capacity [24],
initially empty.
We also assume that some residents possess FCVs. The model of the fuel cell we used is based on the Polymer Exchange Membrane Fuel Cell (PEMFC), because it is the most used in hybrid/electric cars due to its well detailed characteristics in [25] (relatively operate at low temperature and have high voltage, current and power density). In order to be conform to reality its storage capacity was fixed at 2 kWh [26].
III. ENERGY MANAGEMENT STRATEGY
As the problem in this paper is to find an efficient way to allocate energy within the microgrid presented in Figure 1, the strategy proposed lies on the desire to seek an outcome that optimizes the simplified relationship described in equation (2): .
As we consider energy as a service, the solution is to continuously adjust the power source to the energy consumption. For this, we propose a solution that in the first
place maximizes the use of local energy (the energy produced locally at house i), and finally minimizes line loss (maximizes , the weighting factor inversely proportional to loss line due to the energy distribution between different houses).
A. Maximizing the use of local energy
Our solution that maximizes local energy, , which is a vector representing local energy of each house, is based on the bin packing problem algorithms. Since the problem posed here could be formulated as a partition problem, this approach appears to be one of the best ways to tackle this problem. In fact, as the goal here is to fit different needs of the house depending on the availability of energy and its sources, this ends up by being a partition problem.
Note that in according to time, two operating distinct periods can be defined: daytime and nighttime. The Table 2 gives an overview on energy sources and loads, depending on the involved period.
Table III
Definition of the source and needs, in function of time.
Energy sources Loads
Daytime PV as dominant Needs of house i
BESS as auxiliary BESS
Nighttime BESS as dominant Needs of house i
FCV as auxiliary
our microgrid. Remember that not all houses are equipped with PV. About the assumption made about FCVs, we assume that owners go to their duties the morning and return only at sunset.
Thereby, using the energy from the main grid whether it is the day or the night, depends on the gap to fulfill of every house’s needs.
We defined variables like this: represent respectively the photovoltaics, the battery capacity, the fuel cell capacity, main grid energy and the sum of the energy needs of the house i. The number of appliances in the house i is m. The energy needs of the house i are expressed as:
∑
Where is the energy needs of every appliance a. By analogy with the bin packing problem [27], the formulation of this problem is described as follow:
is the weight of item a.
is the capacity of each energy source (PV, ESS).
This is why the purpose here is to determine the minimum number of energy sources required to store all the energy needs of different appliances. Mathematically, this is translated as:
∑
Under the following constraints: ∑
∑
Where if energy source k is used, and if
appliance requires energy from k energy source.
In [15] we simplified the problem to study only two power sources (PV and the main grid). We did not consider the whole set of houses as a microgrid to allow houses to inject their surplus energy into the grid to compensate a neighboring lack of energy. To deal with this problem, we proposed two methods: the First Fit Decreasing (FFD) and the Best Fit (BF) algorithms. In the continuity of this, we propose in this paper an algorithm derived from the BF and addresses the full complexity of the problem by avoiding all the simplified assumptions made in [15]. It is based on the Best Fit Decreasing (BFD) algorithm, because it requires a lower
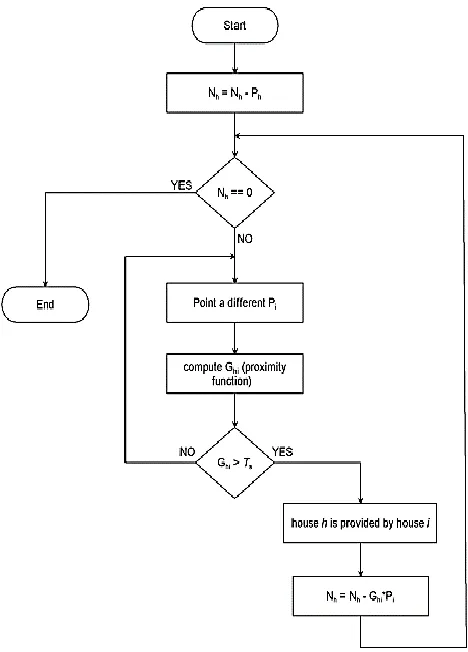
execution time:[28] than both the FFD and the BF algorithms. The proposed algorithm follows the steps presented in Figure 5.
Fig. 5. Flowchart of the Best Fit Decreasing energy allocation algorithm.
To be considered as a source for a specific time slot, the use of either BESS or FCVs during the night as energy sources rely on two conditions:
The stored energy can only be used when its capacity exceed a certain upper threshold. We do not use it beyond a certain lower
threshold: This is to avoid the overuse of their capacities, which have another obligation during the following operating period.
This means that the power management algorithm
implemented has a capacity of learning (a
charging/discharging battery strategy). Depending on the energy production profile of a given place (we assume that we have access to the meteorological data and thus are able to predict the energy production), the proposed solution manages the charging and discharging cycles of the battery in such a way that in the late afternoon, the battery will have stored enough energy to meet the needs of a specific house between 6pm and midnight, the period when electricity is most requested in households.
Fig. 6. Energy allocation strategy based on the BFD algorithm.
The analysis of the Figure 6 shows that the implemented algorithm allows us to use the battery during the day, without penalizing its main role of the night (an invocation to batteries’ energy might be done during daylight to deal with lack of energy on peak load). In this example, the battery may bring around 0.9kWh per house. On the set of several microgrids about a thousand households each, this amount of energy is fairly consistent, and the fact that it is locally produced instead of being drawn from the main grid is an effective solution in the energy mix. This is why our solution considers the battery not only as a way to store energy during daytime and render it at night, but rather as a response which consist in shifting consumption peak load we see repeatedly in most of the households in daytime.
The same happens during nighttime, but at small scale, where FCVs contribute in the energy mix and reduce households’ dependence to the grid. In our simulations, their contribution was not consistent enough (less than 3% in the nighttime energy mix). However, with the current trend in automotive [29] and [30], this is certainly going to be part of the solution to consider.
The main result which follows from this is that, by defining an order of preference between different energy sources, the profile of energy use sticks to the profile of energy production. This is done with a guarantee to meet all the house i energy needs with the least possible energy compensation that would come from elsewhere (either from house j ≠ i or from the main grid as will show the following Part of this section).
B. Minimizing line loss
Since energy sources within our microgrid depend mainly from the sun, which is an intermittent source, minimizing line loss caused by the distribution of energy is of great necessity for not having to compensate a large energy loss. If we take a random house h that is not self-sufficient in energy, its energy lack will be filled by the neighboring energy, and if necessary by the energy of the main grid as shown in the equation (11).
[ ]
We consider households that are part of the microgrid which settle a physical architecture which control, monitor/supervise the production and the distribution of energy by considering it as a service. This helps in the selection of houses participating in equation (11). Mathematically, the loss function to minimize is:
∑ ∑
Where stands for energy from fuel cell vehicles, k and l represent the total number of sources (respectively PV and FCV) that step in to compensate the needs of the house h.
At the first move, our solution offers an alternative to choose houses injecting their energy surplus into the grid based on the fact that their weighting factors are above a
certain threshold Ts to minimize loss along. This is possible due to the multi-subscribers (houses) diversity which allows collecting the needed energy from a limited numbers of households. Houses that are not involved at that move continue to charge their batteries. The algorithm used here is the FF to ensure proximity priority in choosing the paths with the least loss.
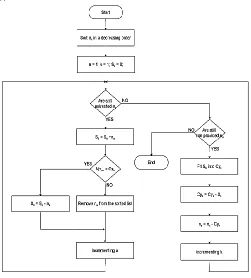
Fig. 7. Flowchart of the Fist Fit energy allocation algorithm.
the energy sources all across the microgrid, with a lower probability of the FCVs presence: We considered households’ energy needs that follow a normal distribution of 13,66kWh/day as mean and 2.4kWh/day as standard deviation.
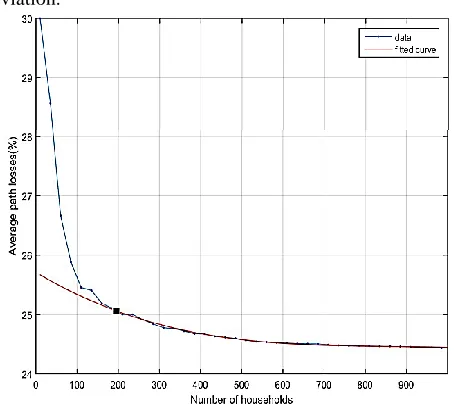
Fig. 8. The evolution of the line loss.
The Figure 8 shows the evolution of the line loss through the microgrid. On the data curve, we notice two areas: the first where the average line loss vary abruptly and a second where the variation is stable. With the help of a linear cubic polynomial function proposed by Matlab, calculated using equation (13), we derived from it the fitted curve. This curve expresses the evolution of the average line loss depending on the number of households that inject energy.
Where x is normalized by mean 1890 and standard deviation of 62.05, and the coefficient are:
p1 = -0.4619 (-1.895, 0.9707) p2 = 25.01 (23.79, 26.22) p3 = 77.03 (74.37, 79.7) p4 = 62.81 (61.26, 64.37)
The first intersection of the data curve and the fitted curve allows us to set our threshold that will be used to select the right number of households that allows us to minimize loss. This corresponds to approximately 25% of loss, or consider only the houses whose exceed 75%. This result confirms what was said previously: Due to a large number of subscribers (at least 200 households injecting energy into the microgrid within 1000), only the best “power” links are selected. But as sooner as needs in energy increase too much, houses that were not selected at the first move will be reconnected t the microgrid as means of making their contribution in the energy mix.
Thus the solution developed in this section allows us to decrease the energy that will eventually be drawn from the main grid, and this on the basis of algorithms that maximize
the use of local energy and minimize line loss, inversely proportional to the weighting factor . This is achieved by
optimizing the utility function given by equation (2) and its result is a better energy allocation not only within a house but also throughout the whole microgrid.
IV. CONCLUSION
A new allocation strategy based on the bin packing is proposed. Since the issue raised in this paper is both to manage energy within a home and possibly energy injected by the latter into the microgrid, the solution comprises two repartition algorithms: the BFD and the FF. The BFD algorithm offers a solution that reduces the midday peak load and in general the daily energy consumption of the house, by insisting on a better use of renewable energies and energy storage systems. Whereas the FF algorithm controls line loss due to the injected energy transmission into the microgrid, on the basis of a discerning selection of houses that contribute in the energy mix within the microgrid. The efficiency of the proposed solution has been demonstrated by a simulation of the two algorithms integrated into a thousand house microgrid featuring energy storage systems.
REFERENCES
[1] K. E. Trenberth, K. Miller, L. Mearns, and S. Rhodes, Effects of changing climate on weather and human activities. Sausalito, California: University Science Books, 2000.
[2] D.S. Lemmen, F.J. Warren, J. Lacroix, and E. Bush, “From Impacts to Adaptation: Canada in a Changing Climate 2007,” Ottawa, Government of Canada, Ottawa: ON, 448 pp.
[3] J. Chandiramani, “Post MDG 2015: The Agenda for Asia and Africa – Are the problems and solutions new?,” International Relations Conference on India and Development Partnerships in Asia and Africa 2013, Volume 157, 2014, pp 143-154.
[4] J. Vandemoortele, “Advancing the global development agenda post-2015: some thoughts, ideas and practical suggestions,” UN System Task Team on the Post-2015 UN Development Agenda, April 2012. [5] A. Naamane, and N.K. Msirdi, “Towards a smart grid Communication,”
7th International Conference on Sustainability in Energy and Buildings, Volume 83, December 2015, pp 428-433.
[6] Q. Fei, and R. Rasiahb, “Electricity Consumption, Technological Innovation, Economic Growth and Energy Prices: Does Energy Export Dependency iand Development Levels Matter?,” International
Conference on Applied Energy, 2014, Volume 61, pp 1142-1145. [7] R. Aldrich, and G. Mellinger, Cisco Energy Management: A Case Study
in Implementing Energy as a Service, Cisco EMS White Paper, 2010. [8] M. D. Yang, Y. P. Cheng, Y. H. Lin, Y. F. Ho, and J. Y. Lin,
“Multiobjective optimization using nondominated sorting genetic algorithm-II for allocation of energy conservation and renewable energy facilities in a campus,” Energy and Buildings. Available: http://dx.doi.org/10.116/j.enbuild.2016.04.027.
[9] T. Mezher, R. Chedidy, and W. Zahabi, “Energy resource allocation using multi-objective goal programming: the case of Lebanon,” Applied Energy, Volume 61, Issue 4, December 1998, Pages 175–192.
[10] S. Shargh, B. K. ghazani, B. Mohammadi-ivatloo , H. Seyedi, and M. Abapour, “Probabilistic multi-objective optimal power flow considering correlated wind power and load uncertainties,” Renewable Energy, Volume 94, August 2016, pp 10–21.
[11] P. Samadi., R. Schober, and V.W.S Wong, “Advanced demand side management for the future smart grid using mechanism design,” IEEE Trans. On Smart grid, Volume 3, no. 3, 2012, pp. 1170-1180
[12] A. Mishra, D. Irwin, P. Shenoy, J. Kurose, and T. Zhu, “Smart charge: cutting the electricity bill in smart homes with energy storage,” e-Energy, 2012, Madrid, Spain.
[14] International Electrotechnical Commission, Electrical Energy Storage, IEC white paper, Switzerland 2011.
[15] N. B. Sendama, M. Laraki, A. Hayar, and Y. Rifi, “New Renewable Energy Allocation Algorithms Based on Bin Packing in a Smart Home,” International Conference on smart cities and green ICT systems, April 2016, pp 309-315.
[16] M. Silvano, and T. Paolo, Bin-Packing problem, Knapsack Problems: Algorithms and Computer Implementations. Chichester, UK: John Wiley and Sons, 1990.
[17] C. Marnay, Introduction to Microgrids, presentation at the Ernest Orlando Lawrence Berkeley National Laboratory, Environmental Energy Technologies Division February 2007.
[18] J. A Duffie, and W. A Beckman, Solar Engineering of Thermal Processes, John Wiley & Sons. New York, 1980.
[19] M. A. Javeed, S. Hussain , S. Saneen, N. Ahmad, S. Ali, Z. Arshad, “Calculation of Power Efficiency of Installed Photovoltaic(PV) Solar Panels at Different Temperatures- A Test Case,” IJVIPNS-IJENS, February 2012, Vol: 12 No: 01.
[20] PVSyst Lab, 2015. PVSyst: photovoltaic software (6.4.0 beta), [software], available: http://www.pvsyst.com/en/download/.
[21] ABB, Power and productivity for a better world, available: https://easyview.auroravision.net/easyview/?entityId=5667729&lang=en , Université Internationale de Rabat, June 2016.
[22] S. Boufous, M. Khariss, “The Moroccan middle class: Evolution and Presentation,” International Journal of Innovation and Applied Studies, July 2014, Vol. 6 No. 4, pp. 801-815.
[23] K.W. Böer, “State-of-the-art in photovoltaic research and application,” Second Arab International Conference, Volume 4, Issue 1, 1987, pp 21-35.
[24] C. Mikolajczak, M. Kahn, K. White, and R. T. Long, Lithium-Ion Batteries Hazard and Use Assessment, Exponent Failure Analysis Associates, July 2011.
[25] S. Litster, and G. McLean, “Review: PEM fuel cell electrodes,” Journal of Power Sources, Volume 130, Issues 1–2, May 2004, Pages 61–76. [26] C. Davis, B. Edelstein, B. Evenson, A. Brecher, and D. Cox, Hydrogen
Fuel Cell Vehicle Study, A Report Prepared for the Panel on Public Affairs (POPA), American Physical Society, June 12, 2003.
[27] L. E. Schreiber; and R. E. Korf, “Improved Bin Completion for Optimal Bin Packing and Number Partitioning,” the 23th International Conference on Artificial Intelligence, Beijing, China: AAAI Press, pp. 651–658. [28] D. S. Johnson, A. Demers, J. D. Ullman, M. R. Gareyi, and R. L.
Graham, “Worst-Case Performance Bounds for Simple One-Dimensional Packing Algorithms,” SIAM Journal on computing, Volume 3, Issue 4. 1974.
[29] D. Block, J. Harrison, and P. Brooker, Electric Vehicle Sales for 2014 and Future Projections, Electric Vehicle Transportation Center, March 2015.
[30] 2013 Global EV Outlook, Understanding the Electric Vehicle Landscape to 2020, April 2013.