Effect of Coal Fly Ash Filler in Silicone Rubber and
Epoxy Resin as Insulating Material in Wet
Environmental Conditions
Ikhlas Kitta, Salama Manjang, Wihardi Tjaronge, Rita Irmawaty
Faculty of Engineering, Hasanuddin UniversityMakassar, Indonesia Email: ikhlaskitta@gmail.com
Abstract— Efforts to optimize the use of silicon rubber and
epoxy resin as an insulating material in the electricity sector continues to be done where one of them is looking for filler are cheap and easily obtained. So in this paper is described about the use of coal fly ash as filler for silicone rubber and epoxy resin, where it is known that fly ash has a very fine particle size that is potentially as filler. Utilization of coal fly ash as filler will help solve problems in the field of environment in Indonesia because these materials as a hazardous waste. So as to determine whether the fly ash can improve the performance of silicone rubber and epoxy resin, it has carried out research on the performance characteristics of silicone rubber and epoxy resin that are conditioned on the wet environments that were simulated by immersion in water for 21 days. Parameter measurement that has been observed is the contact angle, the weight of the test material, and the relative permittivity. The results obtained are fly ash allowed to function as a filler in silicone rubber in wet environments due to the difference in the average value of measurement results between silicone rubber without filler (SRFA0) with silicone rubber which has a filler (SRFA30) ie for a contact angle of 1.3°, weight gain 0.2%, and the relative permittivity of 1.4. While on epoxy resins, fly ash is less possible is used as filler in wet environments, because difference between the average value of the measurement results between the epoxy resin without filler (EPFA0) with epoxy resins which has a filler (EPFA30) ie to the contact angle of 4.7°, the weight gain of 4.6%, and the relative permittivity of 4.8.
Index Term— Silicone rubber; epoxy resin; fly ash; filler, wet environmental.
I. INTRODUCTION
The use of electrical energy for industrial and people is increasing everyday . This causes the depletion of oil reserves and the crisis of fuel so that it appears some use of alternative energy in an effort to overcome this problem. One of them is the coal fire power plant. However, the power plant produces waste that can pollute the environment, such as fly ash [1] and bottom ash. In Indonesia the production of waste fly ash and bottom ash from coal fire power plant reach 2 million tons in 2006, and increased to 3.3 million tons in 2009. The increase in coal consumption is also driven by the Indonesian government's policy which aims to increase the use of energy sources coal from 15.34 % to 33% in 2025 to require that the management does not cause environmental problems, because coal fly ash classified as one of the B3 waste. Fly ash has a particle size that is very smooth, and of some literature research done previously, fly ash coal containing SiO2, Al2O3, TiO2, MgO and ZnO [2-3] potential as a filler,
Since the last few years polymeric material (silicone rubber and epoxy resin) has emerged gradually and was developed as an alternative to ceramic materials and glass. Advantages of silicone rubber and epoxy material that is on the dielectric properties, volume resistivity, thermal properties, mechanical strength and lightweight [4-8]. Because of the lightness, its installation and its maintenance easier than ceramic materials and glass. The weight ratio of the various types of insulators made of polymer is 36.7% - 93% lighter than insulators porcelain / ceramic [4]. In addition to the polymer insulator especially silicone rubber has a water-repellent properties, was able to recover and move to the hydrophobic nature of the layer of pollution that causes pollution join hydrophobic layer. Hydrophobic properties and the ability to transfer it to a layer of pollution is very useful for outdoor insulator because in moist, wet or rain will not prevents the formation of continuous water layer so that the conductivity of the surface of the insulator remains low thus leakage current which occurs very small.
Despite the various advantages of a polymer material, but the materials are a synthetic material that is generally susceptible to climate, pollution and exposure to high electric field. The influence of inertia and high rainfall could lead to erosion of the surface of the polymer insulator. Partial pressure difference between the materials and environmental conditions allows the diffusion process. The amount of water is absorbed and the speed of diffusion processes depending on outside air humidity and ambient temperature. This phenomenon is called polarization effects macroscopic interface that will worsen the dielectric properties of the insulator [9]. Besides, it also caused a decrease in surface properties which can be seen by the disappearance of hydrophobic, the occurrence of cracks and erosion increasingly intense insulator surface followed by an increase in the surface leakage current which can shorten the life of the insulator.
Testing the feasibility of the polymer and the search for materials that can be used as a filler material such as dust of rice husks and silica sand for used as a high voltage insulator material have been done. Hamzah Berahim [10] used an epoxy resin as the insulating material that filled silica. G.Momen [11] used a micro / nano particle such as silica and aluminum tryhidrate on silicone rubber. Arif Jaya [12] utilized waste rice husk ash (RHA) in epoxy polymers.
Vijayalekhsmi [13] utilized OMMT (Organic
Seeing the possibility of fly ash can be used as filler, the great hope of this material can increase the durability of the insulator to cracking and erosion caused by environmental pressures and the possibility of high thermal loading. Fly ash is used as a filler material because this material is cheap [16], readily available, and efforts to utilize waste from coal fire power plants.
The purpose of this study was to obtain performance characteristics of silicon rubber and epoxy resin filled with coal fly ash to be used as a high voltage electrical insulator material. To achieve these objectives, the activities that have been done is to examine the material performance of silicon rubber and epoxy resin that has been filled coal fly ash that is both conditioned on wet environment simulated by immersion in water. Measured parameters are the contact angle, the weight change of the test material, and the relative permittivity.
II. EXPERIMENTAL PROCEDURE
This test follows the procedure as shown in flowchart in Fig. 1.
Silicone Rubber + Fly Ash
(SRFA)
Epoxy + Fly Ash (EPFA)
Humid Environmental
condition
Contact Angle Test
Percentage Diffusion Test
Relative Permittivity
Fig. 1. Experimental procedure flowchart
A. Test Material
Materials used in this research is a kind of RTV 683 silicone rubber, epoxy resins, and coal fly ash derived from coal steam power plant in Indonesia. Fly ash compounds have been examined using XRF is SiO2 = 40.16%; Al2O3 = 19.48%; CaO = 8.35%; Na2O = 2.4%; MgO = 3.8%; P2O5 = 0.15%; SO3 = 1.33%; K2O = 1.75%; TiO2 = 1.3%; Cr2O3 = 0.05%; MnO = 0.29%; Fe2O3 = 20.22%; SrO = 0.12%; ZrO2 = 0.06%; BaO = 0.19%; Pr6O11 = 0.05%; Nd2O3 = 0.08% [17].
In this study, the steps to create test materials was conducted using a room temperature vulcanizing (RTV), in which the silicon rubber and fly ash mixed according to the desired percentage, and epoxy resin material and fly ash is also mixed according to the desired concentration. Subsequently the mixture is put into a vacuum until the conditions are not the bubbly, then put the mixture into the mold. And after test materials dry, test materials inserted into the oven with a temperature of 80 °C until the mass of the test material reaches saturation. Test material is made by 4 kinds SRFA0, SRFA30, EPFA0, and EPFA30 as shown in Table I.
TABLE I.
TYPICAL CHEMICAL COMPOUND CONTENT OF FLY ASH
Name of Test Material Fly Ash
SRFA0 0%
SRFA30 30%
EPFA0 0%
EPFA30 30%
Next, the immersion in a container for each test material just as shown in Fig.2.
Fig. 2. Test materials and containers
Test material is measured performance in testing laboratory. Analysis and characterization of its properties by using various measurement methods will be mutually supportive and complementary. Three main experimental method to do are test the contact angle, the measurement of percentage of water diffusion, and the relative permittivity. The measurement procedure of each of these parameters will be described below.
B. Hydrophobic Contact Angle Measurement
Testing the contact angle is intended to determine the surface properties of test materials, hydrophobic or hydrophilic. Hydrophobic angle reflects the water-resistant properties and surface material, the greater the contact angle, the better the properties of the material to be able to hold the water from getting into the insulating material. The measurement methods used in this study is using the drop method analysis by software Image j. For the image is taken using a camera Sony Xperia C. For the procedure itself that put the material on the test module and turn on the camera, the test material is positioned, so the rear surface of the test material is not visible, and 20 ml of water is dripped on the surface of the test material, turn on the lights as an additional light source so that droplets photographed apparent, photographing the test material with the camera. The test results directly entered into the computer, and contact angle is calculated by the software Image j. To obtain a high accuracy, some references are fulfilled in this research are: a) water droplets of water used is not dirty; b) the volume of water droplets always same of every measurement; c) temperature measurement is always the same around every measurement; and d) the time interval when the hatching to the shooting should be the same [4].
Then the contact angle is obtained by the formula [4]:
C. Measurement of Percentage of Water Diffusion
One of the requirements to become an insulator material is a polymer to be resistant to water damage. At different pressure conditions between the material and the surrounding environment, water from the moisture can penetrate into polymer. The amount of water is absorbed and the rate of diffusion depends on the polymer itself and the circumstances surrounding the polymer. So this study measures the percentage of water absorption which are intended to get the amount of water vapor or moisture adsorbed on the test material is calculated based on the difference between the results of the test material in dry conditions with the condition after a given humidity. Therefore, before the aging test, First of the test material must be dried in a vacuum oven at temperatures of 50 °C. Further testing begins with the diffusion of water immersion test materials in temperature of 50 °C according to the standard (ASTM D570), the test sample is removed from the marinade for 24 hour. Measurement and immersion is done once a day until the sample of saturation. Weight measurement is done by first calibrating the position of equilibrium on the scales equipment. If the value of the position already showed zero scale, test material is placed on the scales then window of weigher closed again in order to avoid the influence of moisture around. To measure the absorption values of water in each test sample is then used formula based Manjang [4]:
In cases,
M (t) : Percentage absorption
m : Mass after immersion
mo : Mass before immersion
D. Measurement of Relative Permittivity
Relative permittivity is obtained by measuring capacitance test material using a meter capacitance. The test material is placed between the parallel circular plate and measurements were performed with a frequency of 800 Hz [16]. Capacitance measurements performed below room temperature 26 °C and humidity around 85%. The capacitance value obtained is then converted into the relative permittivity. The equation for calculating the relative permittivity based Manjang [4]:
(3)
In cases,
C = capacity capacitor (farad) εr = relative permittivity
ε0 = air permittivity (8.85 x 10⁻¹² F/m)
l = the distance separating the two plates (meters) A = cross-sectional area (meter2)
III. RESULT AND DISCUSSION
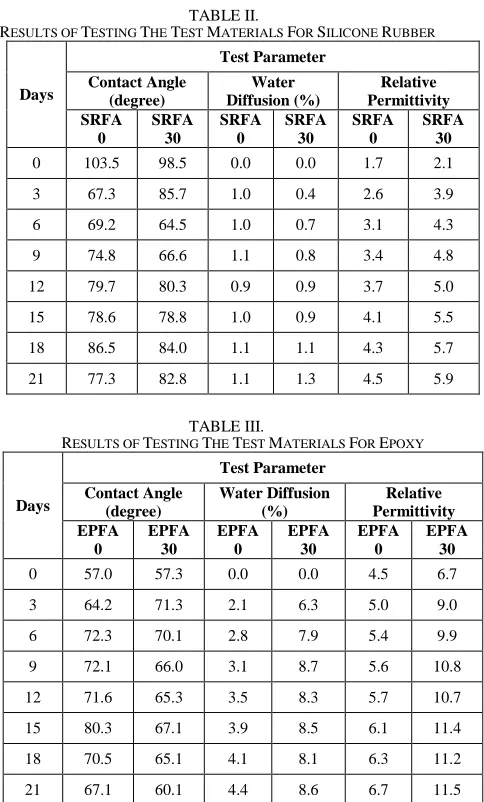
Tables II and III below displays the results of calculations using formulas 1, 2 and 3 based on the testing parameters of the contact angle, the diffusion of water, and
the relative permittivity of the test material with code: SRFA0, SRFA30, EPFA0, and EPFA30.
TABLE II.
RESULTS OF TESTING THE TEST MATERIALS FOR SILICONE RUBBER
Days
Test Parameter
Contact Angle (degree)
Water Diffusion (%)
Relative Permittivity SRFA
0
SRFA 30
SRFA 0
SRFA 30
SRFA 0
SRFA 30 0 103.5 98.5 0.0 0.0 1.7 2.1
3 67.3 85.7 1.0 0.4 2.6 3.9
6 69.2 64.5 1.0 0.7 3.1 4.3
9 74.8 66.6 1.1 0.8 3.4 4.8
12 79.7 80.3 0.9 0.9 3.7 5.0
15 78.6 78.8 1.0 0.9 4.1 5.5
18 86.5 84.0 1.1 1.1 4.3 5.7
21 77.3 82.8 1.1 1.3 4.5 5.9
TABLE III.
RESULTS OF TESTING THE TEST MATERIALS FOR EPOXY
Days
Test Parameter
Contact Angle (degree)
Water Diffusion (%)
Relative Permittivity EPFA
0
EPFA 30
EPFA 0
EPFA 30
EPFA 0
EPFA 30
0 57.0 57.3 0.0 0.0 4.5 6.7
3 64.2 71.3 2.1 6.3 5.0 9.0
6 72.3 70.1 2.8 7.9 5.4 9.9
9 72.1 66.0 3.1 8.7 5.6 10.8
12 71.6 65.3 3.5 8.3 5.7 10.7
15 80.3 67.1 3.9 8.5 6.1 11.4
18 70.5 65.1 4.1 8.1 6.3 11.2
21 67.1 60.1 4.4 8.6 6.7 11.5
Explanation of the tables of test results in Table II and Table III will be shown in the next section.
A. Discussion of Hydrophobic Contact Angle Measurement
In Table II looks the test material Silicone Rubber (SRF0) before the diffusion process (day 0) has a contact angle by 103.5° and Silicone Rubber (SRFA30) by 98.5° in which both the test material the value is greater than 90° so classified refused water (Hydrophobic) [18]. Whereas in Table III for Epoxy (EPFA0) by 57.0° in the condition to 0 days. It is seen that contact angle of silicone rubber is better value than the value of the ignition contact angle of epoxy.
Fig. 3. The results of the contact angle measurements of each test material
Fig. 3 looking the rate of contact angle versus time (days), where the pattern of increase and decrease shown in the graph for silicon rubber that is SRFA0 and SRFA30 almost the same during the 21 days of testing. After coupled with coal fly ash material surface conditions SRFA30 test did not experience a significant difference with SRFA0, so that its contact angle values on average still relatively hydrophobic, that is equal to 77.7° and 76.0°. So it can be seen that the addition of Fly Ash in silicon rubber does not change the nature of hydrophobic of silicon rubber can reduce the volume by 30%.
As for Epoxy tested on condition of in a wet environment, the value of contact angle below of 90° is EPFA0 equal to 70.7° and EPFA30 is 66.6°. So it can be seen that the addition of Fly Ash in epoxy does not change the nature of hydrophobic. In the fig. 3 looks a contact angle values are sometimes subject to conditions up and down, but the decline was not up to the initial value before soaking. From the above results the condition of the contact angle always be between 30° - 89°, it can be influenced by the chemical structure of the surface, meaning that there are elements that are wet table and there is not as well as the differences in temperature and humidity during measurement [18].
B. Discussion of Percentage of Water Diffusion
Weight change as a function of aging time is an indicator of the amount of water absorbed by the test material is based on the percentage of moisture absorption (ΔW) [4] in each sample which can be seen in Table II and Table III.
In Table 2 shows how the characteristics of the diffusion of water in the test material SRFA0 and SRFA30 indicated by the high percentage of absorption of water every day for 21 days of immersion. The relationship between percentage of water diffusion is linear, the longer soaking the amount of water that diffuses into the more insulator, but when it reaches the point of saturation, the rate of diffusion will be more constant. The average percentage of water absorption of the test material immersion SRFA0 for 21 days amounted to 1.0%. While the test material SRFA30 the percentage of water absorption within 21 days of immersion with an average percentage of 0.9%.
Table 3 and Figure 3 is shown the characteristics of the mass measurement of diffusion of water (EPFA0 and EPFA30) that has been soaked in water with a temperature of 50 °C for 21 days. Change in mass of the samples are
recorded from day to day which is absorption of test material. The graph shown in Fig. 4 is linear. The longer immersion will result in the increase of the mass of water absorbed by the material is also getting bigger. The average percentage of water absorption immersion of the test material (EPFA0) for 21 days amounted to 3.4%. While test material EPFA30, the percentage of water absorption within 21 days of immersion with an average percentage of 8.1%.
Fig. 4. C haracteristics of the diffusion of water for each test material
In Fig. 4 shows the pattern of increases and decreases in value during the measurement of diffusion of water for 21 days, was caused by external factors from the surrounding environment that changes the value of the temperature range from 27 °C to 29.4 °C and a change in inertia between 80% to 93%. Where the amount of water absorbed and the rate of diffusion depends on the test material itself and the circumstances surrounding the test material is placed [19].
From the test SRFA0, SRFA30, EPFA0 and EPFA30 seen that with increasing filler then the greater the water absorption capability. Not achieved the diffusion rate of constant (steady-state) for FA30 because there are impurities in the filler material because fly ash contained at 40.16% SiO2 and 19.48% Al2O3 based on several studies which showed that the silica sand has behavior to absorbing water. And also based on research by Manjang [16] that Na2O and K2O are soluble in water, where the fly ash contained Na2O 2.4% and K2O 1.75%. This confirms that the filler role to calculate percentage of water absorption by silicon rubber and epoxy resin.
C. Discusion Of Relative Permittivity Measurement
The results of measurements of relative permittivity (εr) per day will illustrate the behavior of the dielectric properties of silicon rubber and epoxy resin that filler made from fly ash to the conditioning of the immersion in water. Values presented in the form permittivity curve (εr) as a function of time is a normalized value. With the value of the normalization relative permittivity [εr(t) / εr(t0)] can describe clearly the parameter changes to its initial value (before aging).
a value relative permittivity of 1.7 and SRFA30 of 2.1. Furthermore, on day 21, the value of the relative permittivity SRFA0 of 4.5 and SRFA30 of 5.9. Furthermore, in Table III shows the value of permittivity relative to EPFA0 on days 0 by 4.5, and on day 21 by 6.7. To EPFA30 on days 0 equal to 6.7 and on day 21 equal to 11.5.
Fig. 5. The results of the measurement of the relative permittivity of each test material
In the Fig. 5 looks graph showing the relationship between the soaking time with a value of electric permittivity sample SRFA0, SRFA30, EPFA0 and EPFA30. It was found that the rising graph linear approach, which means the longer soaking of the value of relative permittivity test material will also increase. The results of these tests according to testing performed by Kitta [17], where the relationship between the average value of permittivity relative to the concentration of filler material is linear. That is because the concentration of testers affect the increased bandwidth interfaces and increased polarization interface filler material with silicon rubber resulting material becomes more easily absorb water, in addition to the increasing concentration of filler also resulted in the emergence of cracks and small holes in the process of making the test material.
IV. CONCLUSION
SRFA0 and SRF30 is the test materials without fillers such as silicon rubber and silicon rubber filled with fly ash by 30%. EPFA0 and EPFA30 is the test materials without fillers such as epoxy resin and epoxy resin filled with fly ash by 30%. The test materials were immersed for 21 days in a container. In SRFA0 and SRFA30 obtained results measurement of contact angle with an average value SRFA0 of 76.2° and SRFA30 of 77.5°, where both the test material is still quite hydrophobic. The results of the measurement of weight gain on test materials SRFA0 and SRFA30 gained an average percentage of water absorption during the 21 days of immersion to SRFA0 of 1.0% and SRFA30 of 0.9%. Furthermore, for the measurement of relative permittivity obtained average values for SRFA0 by 3.7 and SRFA30 by 5.0.
Furthermore, for testing EPFA0 and EPA30 is obtained results measurement contact angle with the average value for EPFA0 of 71.2° and PFA30 of 66.4°, where both test materials are relatively wet part. The results of the
measurement of weight gain on test materials EPFA0 and EPFA30 gained an average percentage of water absorption of 3.4% for the EPFA0 and EPFA30 of 8.1%. Furthermore, for the measurement of relative permittivity obtained average values for the relative permittivity of EPFA0 by 5.8 and EPFA30 by 10.6.
From these results it can be concluded that the fly ash allows to be used as filler in silicone rubber in wet environments. and fly ash are less likely to function as filler for epoxy resin in wet environments.
REFERENCES
[1] J.S. Mahlaba, E.P. Kearslet, R.A. Kruger, “Microstructural and Mineralogical Transformation of Hidraulically Disposted Fly Ash-Implicataion to the Environment”, Coal Combustion Gasification Product 4, p 21-27, 2012.
[2] N.X. Hai, N.T.L. Phuong, “Characteristics of Fly Ash and Use Ability In Vietnam”, ARPN Journal of Agricultural and Biological Science, Vol. 8, No. 12, December, 2013.
[3] D. Dutta, S. Thokchom, P. Ghosh, and S. Ghosh, “Effect of Silica Fume Additions on Porosity of Fly Ash Geopolymers”, ARPN Journal of Engineering and Applied Sciences, Vol. 5, No. 10, October, 2010.
[4] S. Manjang, “Assessment of Performance Silicone Elastomer as a High Voltage Insulator Material in The Tropics”, Dissertation, Institut Teknologi Bandung, Bandung, 2000.
[5] M.T. Gençoğlu, “The Comparison Of Ceramic And Non-Ceramic Insulators”, ISSN:1306-3111, e-Journal of New World Sciences Academy, Volume: 2, Number: 4, 2007.
[6] M.A.R.M Fernando, and S.M. Gubanski, “Ageing of silicone rubber insulators in coastal and inland tropical environment. Dielectrics and Electrical Insulation”, IEEE Transactions on. 17.2, 2010.
[7] S. Manjang, and M. Nagao, “Characteristics of high voltage polymer insulator under accelerated artificial tropical climate multi stress aging. Electrical Insulating Materials (ISEIM)”, Proceedings of 2011 International Conference on. IEEE, 2011.
[8] K.Y. Lau, M. A. M. Piah, “Polymer Nanocomposites in High Voltage Electrical Insulation Perspective: A Review”, Malaysian Polymer Journal, Vol. 6, No. 1, p 58-69, 2011.
[9] H.C. Kearner, M. Ieda, “Technical aspect of interfacial phenomenain solid insulating system”, Conference On Properties And Application Of Dielectric Materials, Tokyo:Japan, 1991.
[10] H. Berahim, T.Haryono, “Mathematical Analysis for the Electrical Performance Study of RTV Silane Epoxy Resins in Tropical Climate”, 2010 Asia-Pacific International Symposium on Electromagnetic Compatibility, April 12 - 16, Beijing, China, 2010. [11] G. Momen, and M. Farzaneh, “Survey Of Micro/Nano Filler Use
To Improve Silicone Rubber For Outdoor Insulators”, Journal, University of Quebec, Canada, 2011.
[12] A. Jaya, H. Berahim, Tumiran, Rochmadi, “The Performance of High Voltage Insulator Based on Epoxy-Polysiloxane and Rice Husk Ash Compound in Tropical Climate Area”, Electrical and Electronic Engineering 2012, 2(4): p 208-216, 2012.
[13] V. Vijayalekshmi, and A. Majeed, “Mechanical, Thermal and Electrical Properties of EPDM/Silicone blend Nanocomposites”, International Journal of Engineering Research and Applications (IJERA) ISSN: 2248-9622, Vol. 3, Issue 2, March -April 2013, pp.1177-1180, 2013.
[14] M. Musa, Y.Z. Arief, Z.Abdul-Malek, M.H. Ahmad, “Influence of Nano-Titanium Dioxide (TiO2) on Electrical Tree Characteristics in Silicone Rubber Based Nanocomposite”, 2013 Annual Report Conference on Electrical Insulation and Dielectric Phenomena, IEEE, 2013.
[15] J.W. Zha, Z.M. Dang, W.K. Li, Y.H. Zhu, G. Chen, “Effect of Micro-Si3N4–nano-Al2O3 Co-filled Particles on Thermal Conductivity, Dielectric and Mechanical Properties of Silicone Rubber Composites”, IEEE Transactions on Dielectrics and Electrical Insulation Vol. 21, No. 4; August, 2014.
Voltage Insulator”, ARPN Journal of Engineering and Applied Sciences, Vol. 10, No. 17, September, 2015, p 7320-7327.
[17] I. Kitta, S. Manjang, W. Tjaronge, and R. Irmawaty, “Performance Study of Silicone Rubber Polymer was Filled Fly Ash as Insulator Material on High Voltage Transmission Tower”, International Journal of Innovative Research in Advanced Engineering, ISSN: 2349-2763, Issue 01, Volume 3, January, 2016.
[18] A.W. Adamson, “Physical chemistry of surface”, New York,USA, 1982.