1410102-1403-6565-IJMME-IJENS © June 2014 IJENS I J E N S
Evaluation Of Factors Affecting PCD Tool Wear
Behavior Of Al-Fly ash Metal Matrix Composites by
Using Design Of Experiments
Dr. R.Elangovan*
, 1, and M. M. Ravikumar
21
Professor, Moogaambikai College of Engineering, Pudukottai 2 Professor, Pallavan College of Engineering, Kanchipuram.
Abstract--
Aluminum Flyash Silicon Carbide MMCs are increasingly utilized in Aerospace, Marine and Automobile Engineering. Such applications require materials offering light weight, high strength to weight ratio with required mechanical properties such as strength, toughness, stiffness, resistance to wear, and withstanding high temperature. The applications of Al-Flyash-SiC MMCs are limited due to their poor machinability. In order to overcome the machining difficulty, Hybrid Al-Flyash- SiC metal matrix composites are fabricated. The present study deals with t h e machining characteristics of Hybrid Al-Flyash-SiC MMC of different volume fractions (5%, 10% & 15%) by weight. The flyash is added in gradual manner and it is evident that the machinability of the Hybrid Al-Flyash- SiC metal improved significantly which was verified using Fuzzy Logic (FL) and Radial basis function (RBF).
INTRODUCTION
Composite materials are made from two or more constituent materials with significantly different physical or chemical properties and which remain separate and distinct on a macroscopic level within the finished structure. Metal Matrix Composite consists of a metallic matrix combined with a reinforcing material. The matrix materials are Aluminium, Magnesium, and Titanium etc. The reinforcing materials can be Silicon Carbide, Flyash, Alumina, and Graphite.
LITERATURE REVIEW
The driving force behind the development of metal matrix composites are their capability to design to provide needed types of material behaviour, such as their improved strength and stiffness (Ward et al 1996; Ward-Close et al 1999 and Muthukrishnan et al 2009), outstanding
corrosion resistance (Yoshiaki et al 1995; Chen 1997; Blackwood et al 2000), friction resistance (Kennedy et al 1997; Akbulut et al 1998) and wear resistance (Hans 2003; Wang 1996), high electrical and thermal conductivity (Weber 2003) and high temperature mechanical beaviour (LLorca 2002 and Ma 1999). The fabrication and mechanical properties of metal matrix composites has been published in a general review book of Everett (1991). Tomac N. Tonnessen (1992) investigated the effect of cutting speed when turning A1-SiC MMCs with PCD and coated tungsten carbide tools and found that high cutting speeds shorten tool life by causing excessive flank wear. They investigated the effect of feed rate and found that high f e e d r a t e s e t t i n g c a n r e d u c e t h e t o o l w e a r . At h i g h e r f e d e r a t e s t h e temperature of the cutting zone increases. This leads to the softening of the metallic matrix enabling easier removal of the embedded SiC particle in the work piece. Yuan (1993) has shown that, when a PCD cutting tool is used, the depth of cut has no significant effect on the surface roughness of the machined work piece. It was reported by Lane (1992) reported that the tool life of the PCD cutting tool was found to be inversely proportional to the depth of cut.
WORK MATERIAL
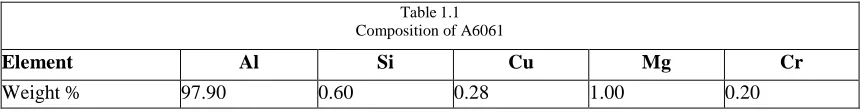
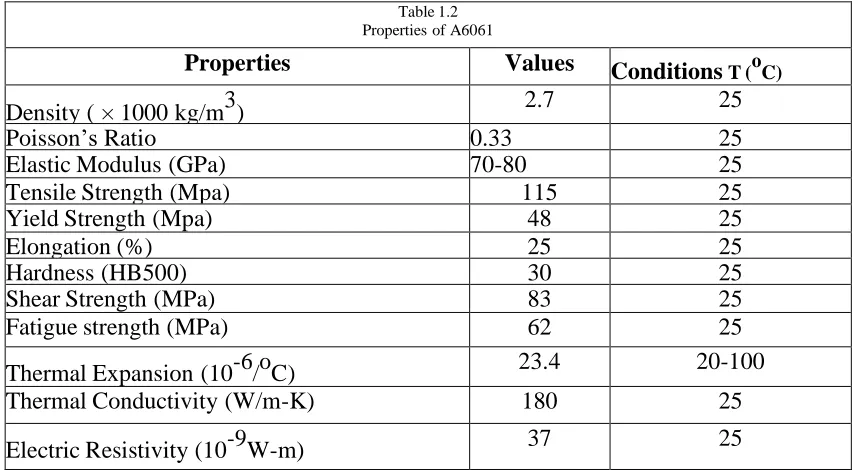
The base materials used for the fabrication of Aluminium Alloy is A6061. Table 1.1 gives the composition of alloy A6061. The basic elements present are Al, Si, Cu, Mn and Cr. Table 1.2 presents the various mechanical and chemical properties of A6061.
Table 1.1 Composition of A6061
Element Al Si Cu Mg Cr
1410102-1403-6565-IJMME-IJENS © June 2014 IJENS I J E N S Table 1.2
Properties of A6061
Properties
Values
Conditions
T (o C)Density ( × 1000 kg/m
3
)
2.7
25
Poisson’s Ratio
0.33
25
Elastic Modulus (GPa)
70-80
25
Tensile Strength (Mpa)
115
25
Yield Strength (Mpa)
48
25
Elongation (%)
25
25
Hardness (HB500)
30
25
Shear Strength (MPa)
83
25
Fatigue strength (MPa)
62
25
Thermal Expansion (10
-6
/
o
C)
23.4
20-100
Thermal Conductivity (W/m-K)
180
25
Electric Resistivity (10
-9
W-m)
37
25
Flyash
Fly ash comes primarily from coal-fired electricity generating power plants. These power plants grind coal to powder fineness before it is burned. Fly ash - the mineral residue produced by burning coal - is captured from the power plant's exhaust gases and collected for use. Fly ash is a fine, glass powder recovered from the gases of burning coal during the production of electricity. These micron-sized earth elements consist primarily of silica, alumina and iron.
Properties of Flyash
The presence of flyash in a work piece helps a lot in machinability.
a) Flyash can be used as Lubricants. b) It has low thermal conductivity. c) The size is less than 250 micrometers.
d) Melting point is above 1000 oC. e) It is chemically inert.
Table 1.3 presents the properties of different constituent used for the fabrication of composites. The melting points of flyash, SiC, A6061 are presented in Table 3.3 for easy comparison.
Table 1.3
Properties of the Composite Material
Material Form Formula
Melting Point (°C)
Density g/cm³
Flyash Powder Combinationof
elements
>1000 0.8
Silicon Carbide Powder SiC 2730 3.22
1410102-1403-6565-IJMME-IJENS © June 2014 IJENS I J E N S Fly ash Composition
Sio2 - 60.62 %,
Al2O3 - 21.93%
Fe2O3 + Fe304 - 7.12%
CaO - 2.28%
MgO - 0.85 %
So4 - Traces
Loss on ignition - 0.72%
Bulk Density - 0.86gm/cc
Fine ness - 0.075mm in m2 / kg
Melting point of aluminium is about 660 ° C Casting periods is about 2 ½ hrs Stirring period is about 20 minutes
Type of furnace is pit furnace
Name of crucible used is graphite crucible. Specification of crucible:
Inner diameter of crucible = 250 mm
Outer diameter of crucible = 280 mm
Thickness of crucible = 15 mm
Height of crucible = 300 mm
Electric blower capacity = 0.25 HP
Melting method is coke fire method. Type of moulding is dry sand moulding . Pattern material i s teak wood. Type of pattern used is solid pattern. Speed of three blade stirrer is 7000 rpm. This speed is reduced to 60 rpm by auto transformer or dimmer stat.
Procedure for the Preparation of Cast Hybrid Al-SiC
MMC with5% Volume Fraction
The A6061 Aluminium in the form of Chip by weight 90 % is placed in the Flyash crucible and is heated to a temperature higher than the melting temperature
660oC of Aluminium. The reinforcement’s like Silicon Carbide by weight 5% and Flyash by weight 5% are preheated for three hours in a separate furnace and after preheating it is poured into the Flyash crucible. The motor with stirrer set up is made on and the stirrer is made to rotate with high speed in order to mix the reinforcements uniformly with A6061. After thorough mixing is done, the liquid MMC is poured to the mould kept at the bottom of the furnace, through the Argon gas chamber with a pressure of 2 bars to cool the hybrid MMC. Thus the solid hybrid Al-SiC-Flyash MMC rod with dia 50 mm and length 250 mm is fabricated.
MACHINING PERFORMANCE EVALUATION
Turning was carried out for the combination of different speeds, feeds and depths of cuts, using a fresh cutting edge. The ranges of cutting conditions were decided for progressive wear of the tool. For each cutting condition, the three components of cutting forces Fx, Fy and Fz, were measured. Measurements were made at different intervals of time. Depending on the length of cut, machining was stopped after every 60-80 seconds, and Vb was measured. Static forces were recorded at two or three intermediate points between two Vb measurements. The set of measurements were taken immediately prior to a wear measurement. One hundred sets of data were collected. During re- insertion of tool inserts after every Vb measurement, inserts were slugged into the slot made out in the tool holder, so that there was no change in the tool overhang.
Tool Wear
1410102-1403-6565-IJMME-IJENS © June 2014 IJENS I J E N S in the size of the tool or machined part. Flank wear can be
measured by using the average Vb and Vb max. The Vb was measured using Radical Tool maker’s microscope. Consequences of tool wear are increase in the cutting force, increase in the surface roughness, decrease in the dimensional accuracy, increase in the temperature, presence of vibration, low production efficiency and poor component quality.
Surface Roughness
The surface roughness depends on the result of the manufacturing process employed to create the surface. Surface roughness Ra is rated as the arithmetic average deviation of the surface peaks and valleys expressed in micro meters. The ability of a manufacturing operation to produce a specific surface roughness depends on many factors. In end mill cutting, the final surface depends on the rotational speed of the end mill cutter, the velocity of the traverse, the rate of feed, the amount and type of lubrication at the point of cutting, and the mechanical properties of the work piece under machining. A small change in any of the above factors can have a significant effect on the surface produced. The surface roughness was measured by using Surtronic 3+ stylus type
instrument manufactured by Taylor Hobson. Surtronic 3+ combines advanced technology with high precision and value to give effective measurement o f s u r f a c e f i n i s h i n t h e w o r k s h o p , inspection room or laboratory.
Cutting Force
Fig. 1.1 Schematic representation of cutting force measurement
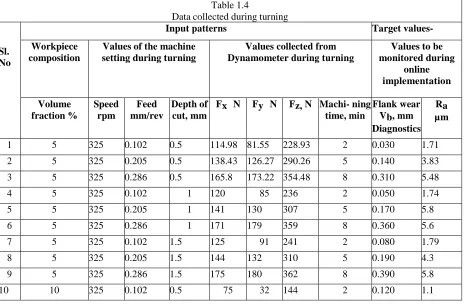
Table 1.4
Data collected during turning
Sl. No
Input patterns Target
values-Workpiece composition
Values of the machine setting during turning
Values collected from Dynamometer during turning
Values to be monitored during
online implementation
Volume fraction %
Speed rpm
Feed mm/rev
Depth of cut, mm
Fx N Fy N Fz, N Machi- ning
time, min
Flank wear Vb, mm Diagnostics
Ra µm
1 5 325 0.102 0.5 114.98 81.55 228.93 2 0.030 1.71
2 5 325 0.205 0.5 138.43 126.27 290.26 5 0.140 3.83
3 5 325 0.286 0.5 165.8 173.22 354.48 8 0.310 5.48
4 5 325 0.102 1 120 85 236 2 0.050 1.74
5 5 325 0.205 1 141 130 307 5 0.170 5.8
6 5 325 0.286 1 171 179 359 8 0.360 5.6
7 5 325 0.102 1.5 125 91 241 2 0.080 1.79
8 5 325 0.205 1.5 144 132 310 5 0.190 4.3
9 5 325 0.286 1.5 175 180 362 8 0.390 5.8
1410102-1403-6565-IJMME-IJENS © June 2014 IJENS I J E N S
11 10 325 0.205 0.5 37 22 190 5 0.320 3.1
12 10 325 0.286 0.5 75 33 71 8 0.010 1.89
13 10 325 0.102 1 78.57 35.72 149.37 2 0.150 1.85
14 10 325 0.205 1 41.45 26.85 193.06 5 0.350 3.12
15 10 325 0.286 1 79.5 35.63 74.36 8 0.040 2.65
6 10 325 0.102 1.5 81 39 151 2 0.180 1.9
17 10 325 0.205 1.5 43 28 197 5 0.380 3.19
18 10 325 0.286 1.5 83 37 81 8 0.070 3.12
19 15 325 0.102 0.5 26 10 29 2 0.300 1.7
20 15 325 0.205 0.5 30 13 28 5 0.310 1.6
21 15 325 0.286 0.5 42 32 69 8 0.186 2.79
22 15 325 0.102 1 30 11 32 2 0.203 1.72
23 15 325 0.205 1 33 13 32 5 0.216 1.7
24 15 325 0.286 1 44 34 72 8 0.200 2.8
25 15 325 0.102 1.5 33.39 12.45 33.39 2 0.217 1.74
26 15 325 0.205 1.5 34 14 55.63 5 0.230 1.73
27 15 325 0.286 1.5 48.07 35.63 74.21 8 0.214 2.81
Table 1.4 (Continued)
Sl. No
Input patterns Target
values-Workpiece composition
Values of the machine setting during turning
Values collected from Dynamometer during turning
Values to be monitored during
online implementation Volume
fraction %
Speed rpm
Feed mm/rev
Depth of cut, mm
Fx N
Fy N
Fz, N
Machi- ning time, min
Flank wear Vb, mm Diagnostics
Ra µm
28 5 500 0.102 0.5 124.94 82.26 241.03 2 0.231 2.11
29 5 500 0.205 0.5 166.98 144.7 323.14 5 0.244 2.75
30 5 500 0.286 0.5 227.28 231.82 416.95 8 0.225 3.17
31 5 500 0.102 1 127 85 249 2 0.242 2.13
32 5 500 0.205 1 170 150 330 5 0.255 2.6
33 5 500 0.286 1 230 235 417 8 0.239 3.4
34 5 500 0.102 1.5 130 90 255 2 0.256 2.5
35 5 500 0.205 1.5 172 160 341 5 0.269 3.1
36 5 500 0.286 1.5 232 240 422 8 0.254 4.2
37 10 500 0.102 0.5 71 34 161 2 0.270 1.32
38 10 500 0.205 0.5 75 42 185 5 0.283 1.79
39 10 500 0.286 0.5 74 47 200 8 0.237 2.2
40 10 500 0.102 1 73.2 37.2 164.32 2 0.253 1.34
41 10 500 0.205 1 76.39 43.43 189.77 5 0.266 1.81
1410102-1403-6565-IJMME-IJENS © June 2014 IJENS I J E N S
43 10 500 0.102 1.5 77 38 167 2 0.267 1.37
44 10 500 0.205 1.5 77 44 190 5 0.281 1.82
45 10 500 0.286 1.5 80 52 210 8 0.295 2.79
46 15 500 0.102 0.5 43 60 52 2 0.259 0.8
47 15 500 0.205 0.5 39 17 54 5 0.276 1.79
48 15 500 0.286 0.5 43 18 55 8 0.289 2
49 15 500 0.102 1 44 17 54 2 0.274 0.9
50 15 500 0.205 1 43 18 55 5 0.290 1.8
51 15 500 0.286 1 44 19 56 8 0.303 2.01
52 15 500 0.102 1.5 45.76 19.59 56.36 2 0.288 1.01
53 15 500 0.205 1.5 44 20 57 5 0.304 1.82
54 15 500 0.286 1.5 46.29 20.71 57.12 8 0.317 2.02
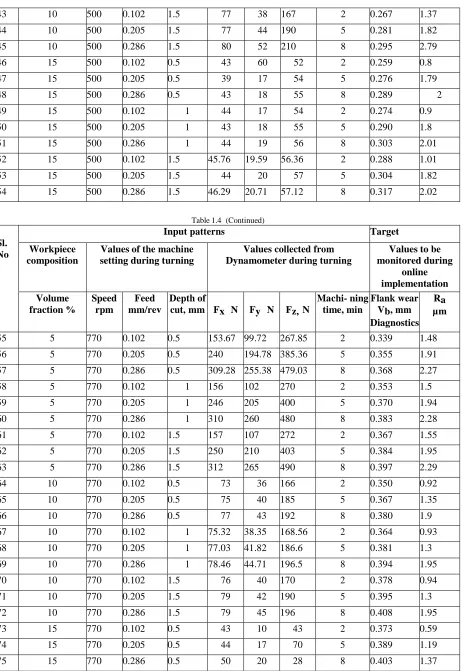
Table 1.4 (Continued)
Sl. No
Input patterns Target
Workpiece composition
Values of the machine setting during turning
Values collected from Dynamometer during turning
Values to be monitored during
online implementation Volume
fraction %
Speed rpm
Feed mm/rev
Depth of
cut, mm Fx N Fy N Fz, N
Machi- ning time, min
Flank wear Vb, mm Diagnostics
Ra µm
55 5 770 0.102 0.5 153.67 99.72 267.85 2 0.339 1.48
56 5 770 0.205 0.5 240 194.78 385.36 5 0.355 1.91
57 5 770 0.286 0.5 309.28 255.38 479.03 8 0.368 2.27
58 5 770 0.102 1 156 102 270 2 0.353 1.5
59 5 770 0.205 1 246 205 400 5 0.370 1.94
60 5 770 0.286 1 310 260 480 8 0.383 2.28
61 5 770 0.102 1.5 157 107 272 2 0.367 1.55
62 5 770 0.205 1.5 250 210 403 5 0.384 1.95
63 5 770 0.286 1.5 312 265 490 8 0.397 2.29
64 10 770 0.102 0.5 73 36 166 2 0.350 0.92
65 10 770 0.205 0.5 75 40 185 5 0.367 1.35
66 10 770 0.286 0.5 77 43 192 8 0.380 1.9
67 10 770 0.102 1 75.32 38.35 168.56 2 0.364 0.93
68 10 770 0.205 1 77.03 41.82 186.6 5 0.381 1.3
69 10 770 0.286 1 78.46 44.71 196.5 8 0.394 1.95
70 10 770 0.102 1.5 76 40 170 2 0.378 0.94
71 10 770 0.205 1.5 79 42 190 5 0.395 1.3
72 10 770 0.286 1.5 79 45 196 8 0.408 1.95
73 15 770 0.102 0.5 43 10 43 2 0.373 0.59
74 15 770 0.205 0.5 44 17 70 5 0.389 1.19
1410102-1403-6565-IJMME-IJENS © June 2014 IJENS I J E N S
76 15 770 0.102 1 46 12 48 2 0.387 0.7
77 15 770 0.205 1 46 18 70 5 0.404 1.27
78 15 770 0.286 1 50 21 30 8 0.417 1.39
79 15 770 0.102 1.5 46.63 13.87 50.84 2 0.401 0.72
80 15 770 0.205 1.5 50.91 19.29 71.79 5 0.418 1.28
81 15 770 0.286 1.5 52 22 32.02 8 0.431 1.4
Table 1.4 (Continued)
Sl. No
Input patterns Target
values-Workpiece composition
Values of the machine setting during turning
Values collected from Dynamometer during turning
Values to be monitored during online implementation Volume
fraction %
Speed rpm
Feed mm/rev
Depth of cut, mm
Fx N
Fy N
Fz, N
Machi- ning time, min
Flank wear Vb, mm Diagnostics
Ra µm
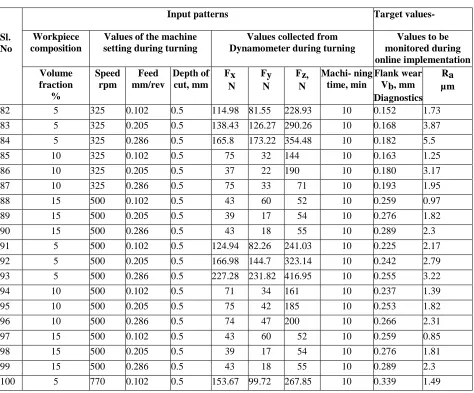
82 5 325 0.102 0.5 114.98 81.55 228.93 10 0.152 1.73
83 5 325 0.205 0.5 138.43 126.27 290.26 10 0.168 3.87
84 5 325 0.286 0.5 165.8 173.22 354.48 10 0.182 5.5
85 10 325 0.102 0.5 75 32 144 10 0.163 1.25
86 10 325 0.205 0.5 37 22 190 10 0.180 3.17
87 10 325 0.286 0.5 75 33 71 10 0.193 1.95
88 15 500 0.102 0.5 43 60 52 10 0.259 0.97
89 15 500 0.205 0.5 39 17 54 10 0.276 1.82
90 15 500 0.286 0.5 43 18 55 10 0.289 2.3
91 5 500 0.102 0.5 124.94 82.26 241.03 10 0.225 2.17
92 5 500 0.205 0.5 166.98 144.7 323.14 10 0.242 2.79
93 5 500 0.286 0.5 227.28 231.82 416.95 10 0.255 3.22
94 10 500 0.102 0.5 71 34 161 10 0.237 1.39
95 10 500 0.205 0.5 75 42 185 10 0.253 1.82
96 10 500 0.286 0.5 74 47 200 10 0.266 2.31
97 15 500 0.102 0.5 43 60 52 10 0.259 0.85
98 15 500 0.205 0.5 39 17 54 10 0.276 1.81
99 15 500 0.286 0.5 43 18 55 10 0.289 2.3
1410102-1403-6565-IJMME-IJENS © June 2014 IJENS I J E N S During machining o f h y b r i d A l -Flyash-SiC M M C ,
l a r g e a m o u n t o f cutting forces are generated between the contact of tool tip and work piece surface. Three components of cutting forces: Fx, Fy and Fz are generated. The tangential force is responsible for removal of material from the work piece surface. Cutting forces are acquired from the three axes kistler dynamometer.
Turning data
Table 1.4 presents the
experimental data obtained during turning. The second column represents volume percent by weight of the work piece. The third column represents speed of the work spindle in revolution per minute. The fourth column represents axial feed of the cutting tool along the axis of the job in mm per revolution. The fifth column represents the depth of cut into the work piece surface by the tool. The values mentioned above are constant for a particular cutting condition.
However, the cutting forces Fx (sixth column), Fy (seventh column) and Fz (eighth column) continuously varies depending upon the hardness of
the work piece material and the wear of the tool surfaces as the machining time increases (ninth column). Frequently, flank wear of the PCD tool and the surface roughness of the workpiece are measured. A total of 100 patterns are measured.
RESULTS AND DISCUSSION
HARDNESS TEST
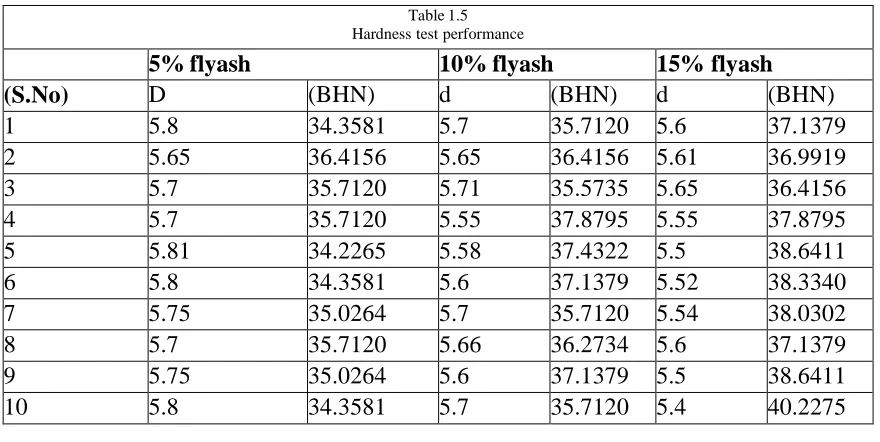
The Brinell hardness number is calculated by dividing the load applied by the surface area in the indentation (Table 1.5).
The specimen diameter is 40 mm. Brinell hardness test specimen diameter = 30mm. diameter of indenter =10mm . Applied load = 1000kg.
Where,
P = applied force
D = diameter of indenter (mm) d = diameter of indentation (mm)
Table 1.5 Hardness test performance
5% flyash
10% flyash
15% flyash
(S.No)
D
(BHN)
d
(BHN)
d
(BHN)
1
5.8
34.3581
5.7
35.7120 5.6
37.1379
2
5.65
36.4156
5.65
36.4156 5.61
36.9919
3
5.7
35.7120
5.71
35.5735 5.65
36.4156
4
5.7
35.7120
5.55
37.8795 5.55
37.8795
5
5.81
34.2265
5.58
37.4322 5.5
38.6411
6
5.8
34.3581
5.6
37.1379 5.52
38.3340
7
5.75
35.0264
5.7
35.7120 5.54
38.0302
8
5.7
35.7120
5.66
36.2734 5.6
37.1379
9
5.75
35.0264
5.6
37.1379 5.5
38.6411
10
5.8
34.3581
5.7
35.7120 5.4
40.2275
Table 3.6 shows the hardness measurements of 10 specimen cut at different portions of the case specimen of 5%,10%,15% flyash composition. Figure 3.17 presents a comparative plot of the reading given in Table 3.6.
TENSION TEST
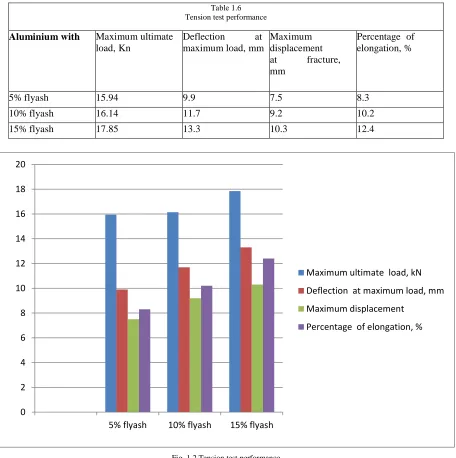
1410102-1403-6565-IJMME-IJENS © June 2014 IJENS I J E N S Table 1.6
Tension test performance
Aluminium with Maximum ultimate
load, Kn
Deflection at
maximum load, mm
Maximum displacement at fracture, mm
Percentage of elongation, %
5% flyash 15.94 9.9 7.5 8.3
10% flyash 16.14 11.7 9.2 10.2
15% flyash 17.85 13.3 10.3 12.4
Fig. 1.2 Tension test performance
TOUGHNESS TEST (CHARPY)
Table 1.7
presents the toughness values for all three combinations of Flyash Table 1.7
Toughness (j/m3)test values
S.No
5% Flyash
10% Flyash
15% Flyash
1
60
120
150
2
65
115
150
3
62
117
145
4
58
121
152
5
60
122
150
6
63
120
155
7
61
119
148
8
65
120
150
9
62
120
150
10
63
121
152
0 2 4 6 8 10 12 14 16 18 20
5% flyash 10% flyash 15% flyash
Maximum ultimate load, kN
Deflection at maximum load, mm
Maximum displacement
1410102-1403-6565-IJMME-IJENS © June 2014 IJENS I J E N S
C
h
an
g
e
in
d
im
e
n
si
o
n
,
mm
C
h
a
n
g
e
in
d
im
en
si
o
n
,
mm
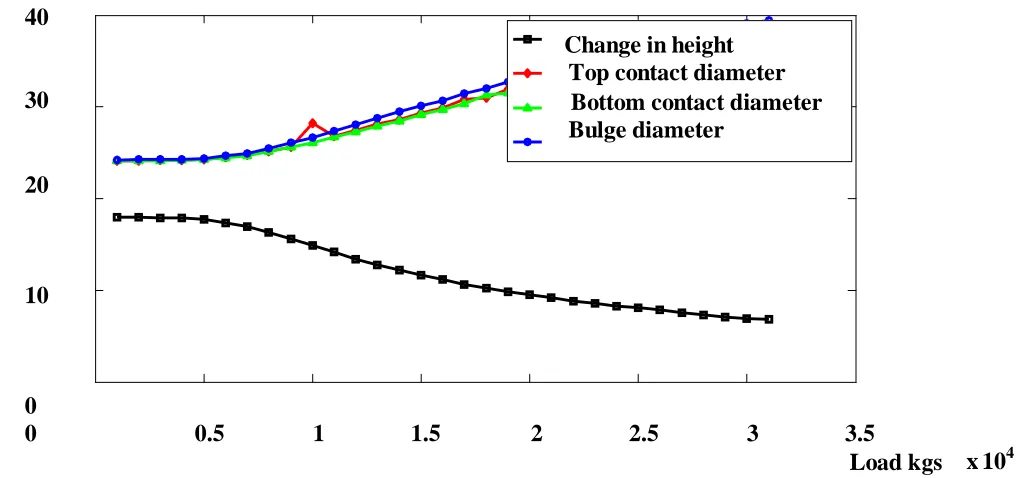
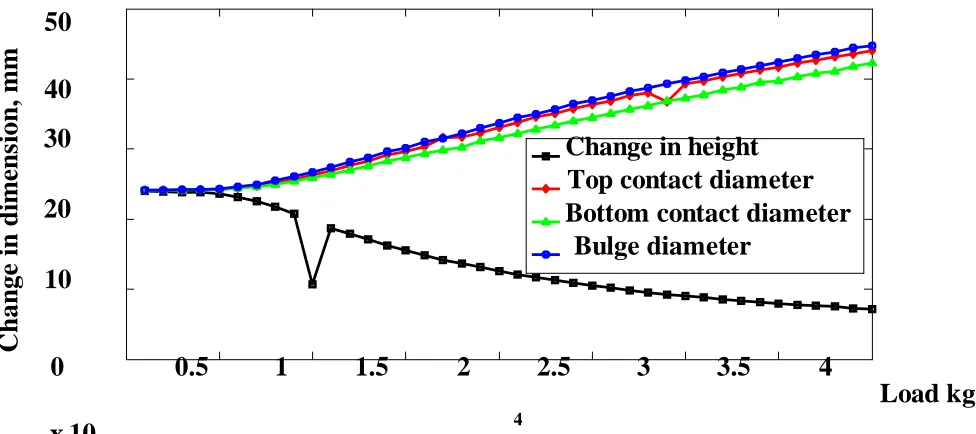
COMPOSITE WORKABILITY DATA
40
Change in height
Top contact diameter
30 Bottom contact diameter
Bulge diameter
20
10
0
0
0.5
1
1.5
2
2.5
3
3.5
Load kgs x 10
4Fig. 1.3 Deformation plot for Aluminium 5% flyash with Aspect ratio :0.75
40
30
Change in height
20
Top contact diameter
Bottom contact diameter
10
Bulge diameter
0
0
0.5
1
1.5
2
2.5
3
Load kgs
x 10
41410102-1403-6565-IJMME-IJENS © June 2014 IJENS I J E N S
C
h
a
n
g
e
in
d
imen
si
o
n
,
mm
50
40
30
Change in height
Top contact diameter
20
Bottom contact diameter
Bulge diameter
10
0
0.5
1
1.5
2
2.5
3
3.5
4
Load kgs
4x 10
Fig. 1.5 Deformation plot for Aluminium 15% flyash with Aspect ratio : 1
CONCLUSION
Gradually the percentage of flyash content in of Al-Flyash-SiC MMCs was increased and was subjected to various hardness tests and with the help of techniques such as it is clear that the machinability property of Al-Flyash-SiC increases significantly. Thus the new combinations of hybrid Al Flyash SIC MMC with increased volume percentage helps in improving machinability, reducing PCD tool wear and reducing surface roughness of the workpiece.
REFERENCES
[1] Tomac N. and Tonnessen K., 1992, Vol. 42, No. 1,pp. 55-58, “Machinability of particulate Aluminium matrix composites”. Annals of CIRP
[2] Akbulut et al, 1998, Vol. 215, No. 1-2, pp. 170-179, “Dry wear and friction properties of Al2O3 short fiber reinforced Al-Si LM 13 alloy metal matrix composites”,Wear
[3] Divakar et al, 1997, pp. 913-914, “Machining A1-SiC, MMC with Wbn-Cbn c o m p o s i t e tool”, Proceedings of the fourth International Conference on Composites.
[4] Lane, 1992, Vols. 1-5, pp. 17-27, “The effect of different Reinforcements on PCD tool life for Aluminium composites”. Proceedings of the Machining of Composites Materials Symposium. ASM Material Week, Chicago, IL.
[5] Kennedy et al, 1997, Vols. 203-204, pp. 715-721, “The friction and wear of Cu-based silicon carbide particulate metal matrix composites for brake applications”, Wear.
[6] Andrews et al, 2000, Vol. 102, pp. 25-29, “Machining of Aluminium – SiC composite u s i n g diamond insets”, Journal of Material Processing Technology.
[7] Yoshiaki et al, 1995, Vol. 198, Nos. 1-2, pp. 113-118, “Corrosion resistance of Al-based metal matrix composites”, Materials Science and Engineering A.
[8] Ward et al, 1996, Vol. 44, No. 5, pp. 1717-1727,
“Semi-solid processing of novel MMCs based on hypereutectic Aluminium-silicon alloys”, Acta Materialia.
[9] Ward-Close et al, 1999, Vol. 263, No. 2, pp. 314-318, “Advances in the fabrication of Titanium metal matrix composite”, Materials Science and Engineering.
[10] Chen, 1997, Vol. 39, No. 6, pp. 1075-1082, “Corrosion protection of an Al 6092/SiCp metal matrix composite”, Journal Corrosion Science.