Using Discrete Data of ECG in the Numerical and
Spectral forms
Sabar Setiawidayat
1, M.Rasjad Indra
2, Djanggan Sargowo
3, Setyawan Sakti
41Engineering Faculty, University of Widyagama Malang, Indonesia 2 Medical Faculty, University of Brawijaya Malang, Indonesia 3 Medical Faculty, University of Brawijaya Malang, Indonesia 4
Mathematics and Natural Sciences Faculty, University of Brawijaya Malang, Indonesia Email : [email protected]
Abstract--
The information the observer needs from the Electrocardiogram (ECG) is principally used to understand the peak value of the PQRST amplitude existing in the boxes in the sheet specific for ECG or in the monitor screen. Based on the counted values of the waves, the observer will be able do diagnose the heart condition. This paper is proposing an ECG-representing concept in the numerical and frequency spectral forms for showing information on the amplitude, segment or interval. From the application of a sampling method from the results of the biosignal tapping, a discrete signal of the amplitude strain versus time duration was obtained. And the filtering of maximal and minimal values of the amplitude from the discrete data in a cycle would result in values from the peak amplitude, meanwhile the time transition method would produce segmental and interval values. The matrice operations and the application of the Fast Fourier Transform (FFT) on the discrete data, the values of signal range and spectrum frequency would be obtained. The ECG presentation in the numerical form will make the results of a diagnosis faster because the calculation is made by a software so that the observer merely sees the results of the calculation. The ECG presentation in the spectral form will result in the normality level or the stadium level of the Arrhythmia.
Index Term-- spectrum, numerical, discrete, sampling, ECG
I. INTRODUCTION
Electrocardiogram (ECG) is an image of the record of the electrical activities of the heart in the form of waves produced by an electronic tool called Electrocardiography [2,3,4,5,6]. But up to now, this electrocardiography tool has been still showing information in the wave form as a time function. The observer should count the peak values of the amplitude, the segment or the intervals of thewaves through boxes in a piece of sheet special for the ECG or in the monitor screen. Based on the observation through the wave, each observer will have different resuts in either the time counting or diagnosis. The exmination will be quicker if the waves presentation of the peak amplitude, segment and the interval is changed into the numerical and spectral forms.
II. METHOD
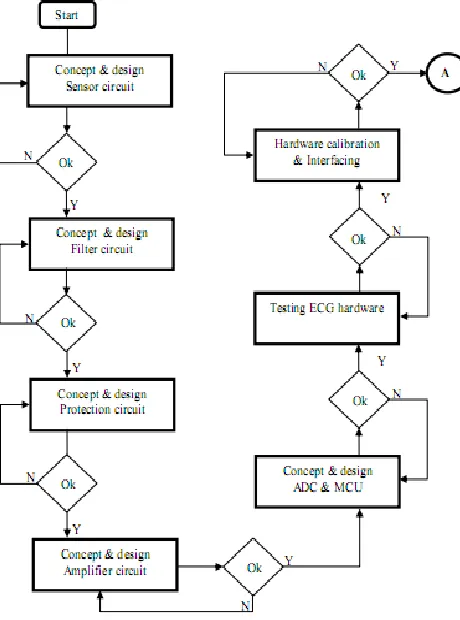
1. The Hardware Design
The discrete data of the ECG are taken by sampling the analogous biosignal tapping of the ECG [1,5,6]. The Biosignal data were obtained from the signal tapping in the surface of the body skin using Jely AgCl and an electrode sensors. A series of protection will protect the sign from any interference and the surrounding magnetic field. A low pass filter (LPF) would filter the sign from any unintended noises. An amplifier serves as the signal-gain amplifying tool for the adaptation to the inputs analog to the Digital Convertion (ADC). The ADC will sample the analogous signals into discrete ones [8,9,10]. The achievement of the discrete signals may be realized by designing a signal-tapping hardware. The hardware may be connected to a computer through a microcontroller prodived with an interface rs232. Picture 1 shows a block of diagram of the hardware design to obtain discrete signals form the biosignal.
2. THE SOFTWARE DESIGN
Fig. 1. The Hardware designing of the signal tapping
Fig. 2. The software designing of the the data storage and signals processing
3. DETERMINING THE ECGPARAMETERS
The informations needed from the ECG are the values of the peak amplitude, segmental and interval duration [1,3,16,17]. In designing the software, referring to figure 3 (lead II), for another may be determined based on the values of the amplitudes as follows :
Point P : obtaining the first maximal positive value Point Q: obtaining the first minimal value
Point R: obtaining the second maximal positive value Point S : obtaining the second minimal value
Point T : obtaining the third maximal value
While for the segmental and interval values, a sign is segmented as follow :
-calculating the duration of the amplitude on the condition: -0.02mVa1, a2, a3, a4 0.01mV
-calculating the duration of the amplitude on the condition : 0.01mV> b1, b2, b3,b4
-calculating the duration of the amplitude on the condition: -0.02mV>c1, c2
Segment PR = a2
Segment ST = a3
Interval PR = b1+a2
Interval QRS = c1+b2+c2
Interval QT = c1+b2+c2+a3+b3
Interval ST = a3+b3
Fig. 3. segmentation cycle wave in the ECG sheet.[5]
4. DETERMINING THE VALUES OF THE SIGNALS
The values of the signals are the those of the length of the signal length, of power signals, of signal energy, of dot product and value of the vector of the signal amplitude. The values obtained as s follows :
- Peak Vector of P,Q,R,S,T in the Cartesian Coordinat is conversed into the polar form so they have a magnitude and phase angle of fasa
2 2
.P A t
Mag
P
tan
1(
A
/
t
)
- Power signal is obtained from theroot of the number quadratic values of the amplitude in each point of time
The value of the power signal :
vA=
a
1
2
a
2
2
a
3
2
...
an
2 - Signal Value is the number of multiplicationbetween the values of the amplitude and of the duration. Value signal = the row vector (amplitude) * the column vector (duration)
- Waves Length= counting the wave length
f
c
f
c
.
/
- Long Line is
{(
V
n
V
n1)
2
(
0
.
004
)
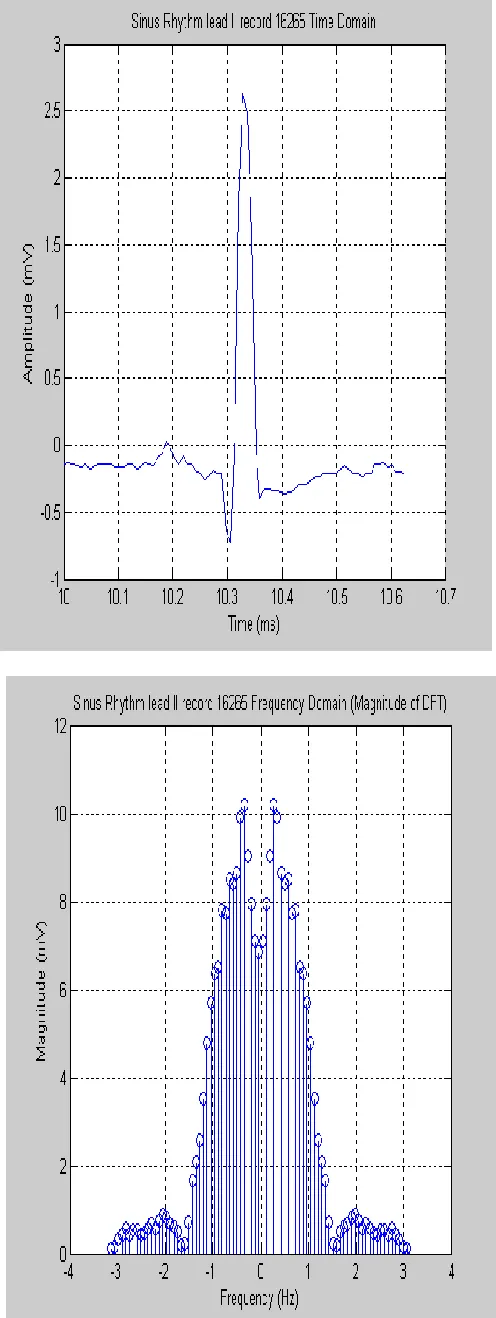
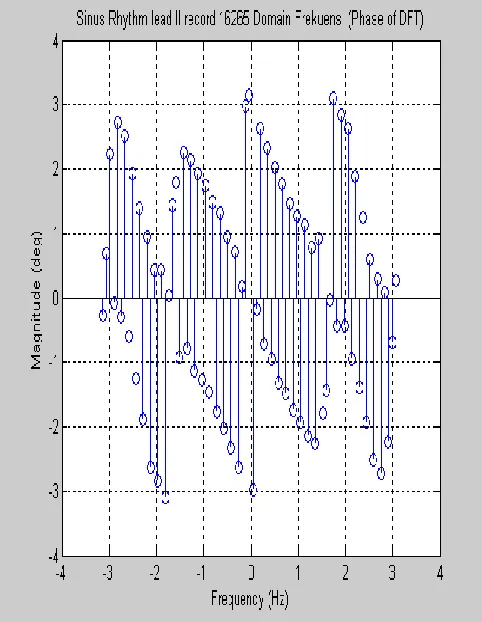
2 5. DETERMINING THE SPECTRUM FREQUENCYThe frequency spectrum is obtained from the application of the FFT method in the first-cycle signal data. From the observation, very valueable information on the bandwith (the width of the frequency area, range frequency), modulation effect, and false signal generation [1,8,9,10].
III. RESULT
Based on the strained discrete data as the time function, the followings are obtained :
- ECG waves appropriate with one cycle - Values of the heart rate in one cycle
- Values of peak amplitude of P, Q, R, S dan T in one cycle
- Values of the internal duration of PR, QRS, ST and QT in one cycle
- Values of the duration of the segments of PR and ST in one cycle
- Values of the wave length in one cycle - Values of the signal power in one cycle - Values of the signal energy in one cycle - Bandwidth of each signal in one cycle
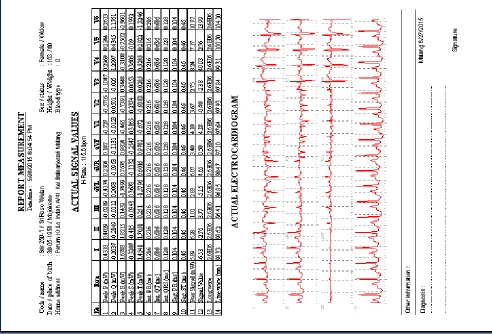
Based on the results of running software that has been designed, using 16265 discrete data records from the MIT-BIH and measurement it self, the obtained ECG parameters as shown in Table I and Table II.
Table I
Table II
ECG parameter for Measurement itself
Fig. 4. Changes discrete signal from the time domain to the frequency domain 1 cycle leads II
for to record 16265
IV. CONCLUSION
The designing of this tool will result in:
- Faciliting the observer because he will be quicker in getting the ECG information due to the fact that he will not make some calculation anymore
- Each variation of signal will be able to be distinguished base done apropriate values of the signals and spectrum
- Facilitating the maintenance of the tool because the hardware and software are separated.
- No dependency happens on the ECG sheet because the results may be printed in ordinary sheet (HVS folio, HVS kwarto,etc) with any printers
- Facilities of the history of the patient’s examination are available because of the existing data storage
- The general practitioners or patients may interprete the results because the information is in the numerical form - The price of the ECG tool is lower than the existing ECG
V. ACKNOWLEDGEMENT
This research was funded by the DP2M Dirjen Dikti in line with the attachment of the Dirlitabmas decision no. 0094/E5.1/PE/2015, under the scheme of Penelitian Hibah Bersaing, with the title of Perancangan Elektrokardiogram 12-lead berbasis computer.
REFFERENCE
[1] Balouchestani M, Raahemifar K, Krisnan S, 2013. Low Sampling-rate Approach for ECG signals with Compressed sensing Theory. Sciverse Sciencedirect, Elsevier, Procedia Computer science 19 (2013) 281-288
[2] David Prutchi, Michael Norris. 2005. Design and Development of Medical Electronic Instrument. A John Wiley & Sons, Inc., Publication
[3] Guyton. Arthur & Hall.E , 2008, Textbook of Medical Physiology, 11th edition, Elsevier, Singapore
[4] GA. Stoufer. 2009. Practical ECG Interpretation. Wiley-Blackwell. A John Wiley & Sons, Ltd, Publication
[5] John R.Cameron, James G. Skofronick, Roderick M.Grant, 2006.
Physics of the Body, 2th, University of Wisconsin-Madison
[6] John R Hampton, 2003. ECG made Easy. Churchill Livingstone [7] Myer Kutz. 2009, Biomedical Engineering and Desain Handbook.
2th, Vol.1, McGrawHill, ISBN: 978-0-07-170472-4
[8] Narayana KVL, Noise Removal using adaptive noise canceling, analysis of ECG using Matlab, International Journal of Engineering Science and Technology (IJEST),ISSN:0975-5462, vol.3, no. 4 April 2011
[9] PA Otubu, For the Realisation of the design of Electrocardiogram for the Monitoring of the Physiology of Human Heart, Journal of Engineering and Applied Sciences 3(11):856-860, 2008. ISSN:1816-949X,@Medwell Journals, 2008
[10] Ramesh Kumar S, The Deterministic Chaos in Heart Rate Variability signal and analysis Techniques, International Journal of Computer Applications (0975-8887), vol.35, no.7, December 2011
[11] Sachin Singh, Netaji Gandhi, Pattern analysis of different ECG signal using Pan-Tompkin’s algorithm, International Journal on Computer Science and Engineering (IJCSE), vol.02, no.07, 2010, 2502-2505
[12] Sarika Tale, Time and Frequency domain analysis of Heart rate variability signal in prognosis of type 2 diabetic autonomic neuropathy, International Journal of Engineering Science and technology (IJEST), ISSN:0975-5462, vol.3, no.4 April 2011 [13] Stevan Silbernagl, Florian Lang. 2000, Color atlas of
Pathophysiology, Thieme, Stuttgart-New York
[14] S.Karpagachelvi, Arthanari, Classification of Electrocardiogram signals with Support vector machine and relevance vector machine, International Journal of Engineering cience and Technology, vol.2(11), 2010, 6511-6520
[15] Shirley A John. 2008. ECG Success, Exercises in ECG Interpretation. F.A. Davis Company. Philadelphia
[16] Takeshi T, et.all, 2014. Time-frequency analysis of the QRS complex in patiens with Ischemic cardiomyopathy and myocardial infarction. IJC Heart & Vessels. Elsevier, IJCHV-00037; No of pages 11
[17] Webster J.G. 2004. Electrical Measurement, Signal Processing and Display. CRS Press LLC
![Fig. 3. segmentation cycle wave in the ECG sheet.[5]](https://thumb-us.123doks.com/thumbv2/123dok_us/1361067.1645296/3.612.49.293.56.310/fig-segmentation-cycle-wave-ecg-sheet.webp)