Page 42 www.ijiras.com | Email: [email protected]
Fault Classification On Power System Transmission Line Using
Pattern Recognition Algorithm
Ogboh V. C.
Obute K. C.
Eleanya M. N
Department of Electrical of Engineering, NnamdiAzikiwe University Awka, Anambra State, Nigeria
I. INTRODUCTION
One of the biggest problems in the continuity of electrical power system supply is the occurrence of faults. These faults are inevitable and normally an abnormal flow of current in a power system’s component. They cannot be completely avoided since some of them occur due to natural reasons which are beyond human control. Hence, when the power system has a well-coordinated protection system, it detects any kind of abnormal flow of current in the power system, identifies the fault type, accurately locate the position of the fault in the power system network and isolate it. The isolation of the fault must be very fast to avoid damage of power equipment and power outage. Also the faults must be cleared very fast so as to restore the power to the isolated areas. The clearing of the faults are done using protective devices which sense the fault, respond immediately and disconnect the faulty section from the good ones.
To protect the power system transmission lines, faults must be detected and isolated accurately. The control center of a power system contains large member of alarms which receives signals from different protection schemes for different types of fault.
II. METHODOLOGY A. FAULT CLASSIFICATION
The classification of fault detected from the transmission line can be achieved using the pattern recognition ANN algorithm. This algorithm selects a new ANN (second neural network) for the classification of fault. It accepts the phase currents and voltages as inputs train with it and give an output as four signals which differentiates the four classes of fault and which are phase – to – phase fault, phase – to – ground
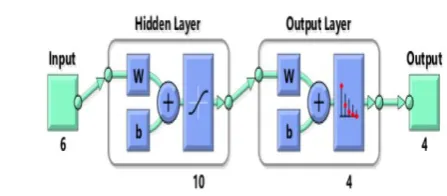
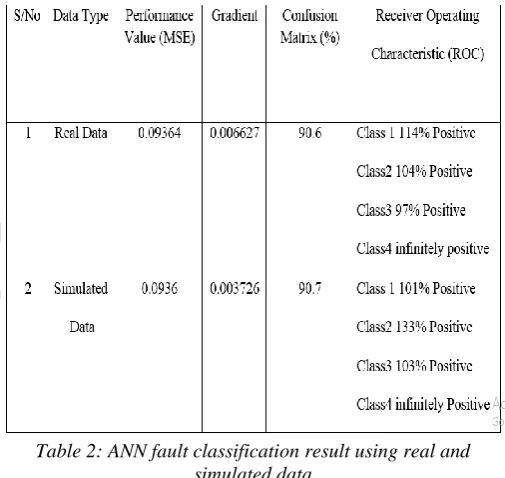
Abstract: This paper present a classification technique based on Artificial Neural Network (ANN) called pattern recognition algorithm. It shows detail diagnosis of faults on a 132KV power system transmission line. It modeled the transmission line using it parameters on Matlab / Simulink 2016. The real and simulated data of pre – fault and fault voltage and current of the transmission line were used as inputs of the ANN network selected for the classification. The selected network consist of 6 inputs data of pre – fault or fault voltage and current, 10 hidden neurons and 4 output neurons representing the four unbalanced fault types (Phase to ground, Phase to phase, Double to ground and Three phase). The simulation was performed with real and simulated data. The result show that, using the real data application, phase A – G = 1.14 (114%), AB – G = 1.04 (104%), A – B = 0.97 (97%) and ABC is infinitely classified. While using the simulated data, phase A – G = 1.01 (101%), AB – G = 1.33 (133%), A – B = 1.03 (103%) and ABC is infinitely classified.
Page 43 www.ijiras.com | Email: [email protected] fault, double phase – to – ground fault and three phase fault
[1].
Figure 1: Model of the transmission line using Matlab/Simulink 2016 [2]
III. RESULT ANALYSIS A. FAULT CLASSIFICATION USING ANN
Table 1: The Back Propagation neural network truth table for the Classification of fault
Table 1 was used as the output and target output of the neural network selected for fault classification using both real and simulated data. When a fault situation is detected, the next step is to classify the fault to know the type of fault occurred. In this section, the backpropagation (BP) algorithm based on the Levenberg Marguardt optimization method is still maintained as the learning rule to be used. Learning rules (Training algorithm) is the procedure for modifying the weight and biases of a network. The learning rule is applied to train a network to perform a particular task.
Therefore, the back propagation learning rule or training algorithm based on LevenbergMarquardt is applied to train the multi-layer perception neural network purposed for the classification of the fault detected.
Figure 2: BP ANN network selected for fault classification
IV. CLASSIFICATION USING REAL DATA
Figure 3: ANN training procedure for the classification of the four faults
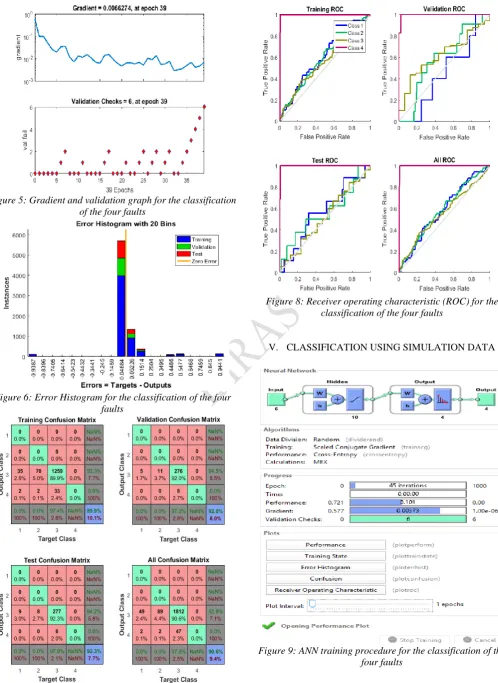
Page 44 www.ijiras.com | Email: [email protected] Figure 5: Gradient and validation graph for the classification
of the four faults
Figure 6: Error Histogram for the classification of the four faults
Figure 7: Confusion matrix for the classification of the four
Figure 8: Receiver operating characteristic (ROC) for the classification of the four faults
V. CLASSIFICATION USING SIMULATION DATA
Page 45 www.ijiras.com | Email: [email protected] Figure 10: MSE Performance graph for the classification of
the four faults
Figure 11: Gradient and validation graph for the classification of the four faults
Figure 12: Error histogram for the classification of the four faults
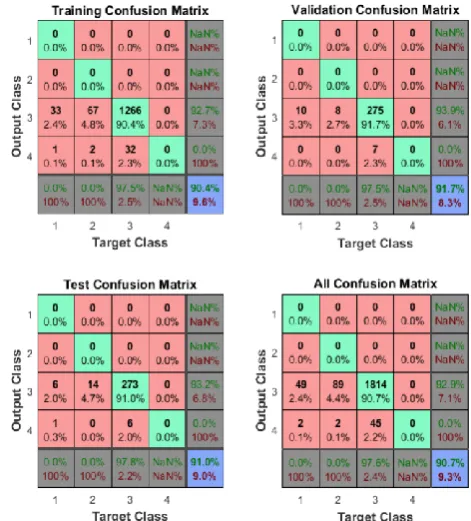
Figure 13: Confusion matrix for the classification of the four faults
Figure 14: Receiver operating characteristics for the classification of the four faults
Page 46 www.ijiras.com | Email: [email protected] percentage rate of classification, we find the gradient between
the true positive and false positive rate of classification and multiply by 100.
Taking a point on the true positive rate say 8. The corresponding false positive rates with respect to all the four faults are; for the real data application, phase A – G = 1.14 (114%), AB – G = 1.04 (104%), A – B = 0.97 (97%) and ABC is infinitely classified. For the simulated data, phase A – G = 1.01 (101%), AB – G = 1.33 (133%), A – B = 1.03 (103%) and ABC is infinitely classified.
Phase A = A, phase B = B, phase C = C, ground = G. In the above truth table, the three phases are represented as phase A, B and C. while G is the binary output of the back propagation neural network training process (Classification process).
When single line - to – ground fault occurs at phase A (as phase A - Ground G) or (A - G), the phase A will have a binary input as I while B and C has 0’s and all gives 1 as the output G. the same thing happens to B and C.
However, when a line – to – line fault occurs, such as A - B, both lines has the binary inputs as 1’s and outputs 0. The same thing happens to B - C and C - A type of faults.
But when Double line – to – ground (A – B - G) fault occurs, the Double lines, say A - B will have binary inputs as 1’s, while C is 0.
The same is applied to B – C - G and C – A - G.
Finally, when three - phase fault occurs at all the phases, the binary inputs will be 1’s, but outputs 0 at G.
After an extensive search for the most suitable network size, the one with only one hidden layer and ten hidden neuron was chosen to carry out the classification task. The proposed BP network is shown in figure 4.160 and 4.161 [2] [3] [4] [6].
Figure 15: BP Neural network for fault classification
Figure 16 - BP network for classification of the power system transmission line
The performance graph illustrates the training result of the actions taken place during the trainings process.
The confusion matrix illustrates the correct classification of faults. Here, the green square represent the high number and percentage of correct fault classified. The red colored square represent low number and percentage of incorrect classification. The light blue illustrates overall accuracies of classification of faults, while the off diagonal ash colored square illustrates the percentage of misclassified data [2] [3] [4] [5] [6].
VI. TESTING (GENERALIZATION) RESULTS OF THE BP CLASSIFICATION NETWORK
In the analysis of the classification process within a particular time interval. The performance result and confusion matrix show that almost all the fault types were classified.
Table 2: ANN fault classification result using real and simulated data
Where Class 1 is phase A to ground fault, Class 2 is phase AB to ground fault, Class 3 is phase A to B fault and Class 4 is three phase fault.
VII.CONCLUSION
Page 47 www.ijiras.com | Email: [email protected] REFERENCES
[1] Ogboh V. C., Madueme T. C., (2015), ‘Theoretical Background to Power System Fault Studies: A Novel Method’, International Journal of Research in Management, Science & Technology (E-ISSN: 2321-3264) Vol. 3, No. 4, December 2015 Available at www.ijrmst.org.
[2] Ogboh V. C., Madueme T. C., (2015), ‘Investigation of Faults on the Nigerian Power System Transmission Line Using Artificial Neural Network’, International Journal of Research in Management, Science & Technology (E-ISSN: 2321-3264) Vol. 3, No. 4, December 2015 Available at www.ijrmst.org.
[3] Singh S., Mamatha K. R., Thejaswini S., (2014), ‘Intelligent Fault Identification System for Transmission Lines Using Artificial Neural Network, IOSR Journal of Computer Engineering’, (IOSR-JCE) e-ISSN: 2278-0661, p- ISSN: 2278-8727Volume 16, Issue 1, Ver. I (Jan. 2014), PP 23-31 www.iosrjournals.org
[4] Suhaas B. A., (2011), ‘Artificial Neural Network Based Fault Location for Transmission Lines’, University of Kentucky Knowledge, 2011.
[5] Karthikeyan J., 2007, ‘Power System Fault Detection and Classification by Wavelet Adapting Resonance Theory Neural Network’, University of Kentucky, www.uknowledge.uky.edu/gradschool_thesis/452