Base Station Localization and Optimized Placement using
Cuckoo Search (CSA) Algorithm
1
Sarabjeet Singh,
2Deepika
1,2Dept. of Electronics & Communication Engineering, LCET, Ludhiana, Punjab India
Abstract
The employment of BTSs is a tiresome work for network designers. The problem considered in the research is to decide the best localities of BTSs to meet traffic demands. Optimal coverage of BTSs is essentially a resource allocation/optimization problem. The path loss, received power, and attenuation are main parameters of considerations during the optimization. Okumara - Hata model is considered for parameters calculations. Cuckoo Search Algorithm is investigated in the research to find optimal locations against PSO technique for same scenarios. Results were analyzed considering fixed population of mobile stations but with varying number of movable stations. Power received from all the BS locations searched by CSA is greater than the power received from BS location searched by PSO. Also the signal which travels from location searched by CSA suffers lesser path loss and attenuation than the location searched by PSO. So CSA outperforms PSO in every respect. The results show that the CSA approach is effective and robust for efficient coverage problem of BTS location and is considered to give almost the optimal solution in implementation of a wireless communication efficient network.
Keywords
Base Station Localization, CSA (Cuckoo Search Algorithm), Cellular Mobile Communication
I. Introduction
In finding out the solutions for optimization , a set of nature inspired algorithms are widely and effectively used nowdays., Collectively, these are called swarm intelligence Algorithms or systems. The focuses on the behavior of certain insects and has developed some of the meta - heuristics which are capable of cloning insect’s ability of finding solution to the problem. A new Cuckoo Search Algorithm (CSA), is a similar type of algorithm which is used for getting numerical optimization that is well inspired from the breed behavior of certain cuckoo species intensively and the algorithm is implemented and investigated, in this research, for the localization of BTSs so that maximum number of users or subscribers could be covered under placed BTSs.
When the cellular concept was first proposed, BTS locations were usually selected according to a regular reuse pattern. With the growth of cellular technology, it is becoming increasingly important for any cellular operator to have a network which is not only better in terms ofquality of service than its competitors but also is more profitable than the others. It is worth noting that cost, required to be spent and invested for providing best QoS Network with a strong backbone depend intensively on number of BTSs installed in that network, more BTS, more is the cost but better coverage at more infrastructural cost.
One of the reason for the difficulty in implementation of network, being the frequency channels becomes increasingly congested and propagation environments become more complex.The problem considered in the research focuses in determining the best and optimal locations of BTSs in a network to meet traffic demands. Optimal coverage of BTSs is essentially a resource allocation/
optimization problem. The research focuses in parameters for optimization and theses are confined to received power, path loss and attenuation.
The paper trails as: Analysis of earlier work is specified in Section. II. Section III focuses on the Planning Model. Section V elaborates the proposed research. Section VI here says anumber of tentative results to display the performance of the new algorithm. In the end, conclusions are drawn in Section VII.
II. Literature Survey
In [Singh and Kaur, 2013] authors reflected how to optimally define positions of Base Transceiver Station (BTS), such that least count of BTS can be connected to insure higher quantity of subscriber at smaller infrastructural cost. Inhabitants based Evolutionary Algorithms (EAs) are established by demonstrating the actions of diverse groups of insects and animals e.g., bees, termites, ants, fishes, birds. These EAs can be utilized to get best results for NP-Hard arbitrary optimization difficulties. Artificial Bee Colony (ABC) procedure is a meta - heuristic exploration process and is examined, in this investigation, to confine BTSs so as to shield maximum count of subscribers. The consequences were then matched with K-Mean clustering technique.
In [Awasthi and Arora, 2014] authors designated that Radio Coverage universally gets affected by Antenna activities, Position of BTS and also the Presentation of Base Station. Their research measured as how to detect the best position of Base Station Transceiver (BTS), so that with smallest count of BTS, largest count of users can be connected at less infrastructural price. The idea of Using Evolutionary process is fairly operative and competent as the processes are established by demonstrating the conduct of various groups of faunas like bees, ants, and birds. These processes can be used to define the best position of BTS. In this investigation, ABC algorithm was utilized to find the position of BTS so as to provide coverage to large count of user. The consequences were then also matched with GA algorithm. In [Pereira et. al., 2014] authors showed the there is a major improvement of using PSO for multiple Base Station (BS) placement over a wide area. They evaluated the algorithm’s performance using a combination of Shannon’s capacity formula and Jain’s index of fairness for two sets of traffic demand points, corresponding to an estimation of average and peak traffic, respectively. They showed results performed by using 8, 32, 128 and 256particles to place sets of new BSs versus number of iterations. They also exhibited potential optimal points for placement found by PSO. The improvement seen using optimization in the average capacity is 17% and also with an increase on the number of BSs smaller than 10%.
III. Planning Models
practice of so named broadcast bends. The most usually castoff path loss representations are:
A. Okumura Model
Okumura developed an empirical model that is derived from extensive radio propagation studies in Tokyo. It is represented by means of curves with which is applicable for urban areas. For other terrain, Okumura has provided correction factors for three types of terrain:
Open Area: this covers rural, desert type of terrain. 1.
Quasi Open area: this covers rural, countryside kind of 2.
terrain. Suburban area. 3.
B. Hata Model
The model is an empirical formulation of the graphical path loss data provided by Okumura. This model says that the urban area propagation loss can be easily presented as a standard formula and hence defines correction equations for other types of areas [Hata, 1980].
The general Path loss equation is given by (Okumara - Hata urban propagation model)
Lp = Q1+Q2 log (f)-13.82 log (Hbts)- a(hm)
+{44.9-6.55log(hbts)} log (d)+Qo (1)
And is determined based on the parameters Lp=path loss in dB
f =Frequency in MHz
d =distance between BTS and the mobile (1-20 Kms) Hbts=base station height in meters (30 to 100m)
a (hm)= Correction required if mobile height is more than 1.5
meters and is given by:
a (hm) ={1.1 log (f)-0.7}hm –{1.56 log (f)-0.8} for urban areas and
= 3.2{log (11.75hm)2-4.97for Dense urban areas
hm = mobile antenna height (1-10m)
Q1 = 69.55 for frequencies from 150 to 1000MHz
=46.3 for frequencies from 1500 to 2000MHz
Q2 = 26.16 for 150 to1000 MHz
= 33.9 for 1500 to 2000 MHz Qo = 0 dB for urban
= 3 dB for Dense urban
IV. Fitness Function and Parameters
The optimum location is finding out in the proposed research considering the three main parameters (a) Path loss, Lp (b) Attenuation, A(c) Power received, using (1), (2) and (3). A = 42.6 + 20 log10 f + 26 log10d (2) Pr = 10 log10(Pt) - abs(Lp) (3) Where Pt = Transmit power
f =Frequency
d = distance between MS and BTS Lp = Path loss determined by equation (1)
The problem of finding the optimal location of any BTS within its coverage area can be articulated as a fitness function described by equation (4) to achieve large received power by Mobile Station, Less Attenuation and less path loss. So the objective function is maximized to achieve these objectives.
Maximum fitness, F, is achieved given by equation (4).
(4)
V. Proposed Algorithm
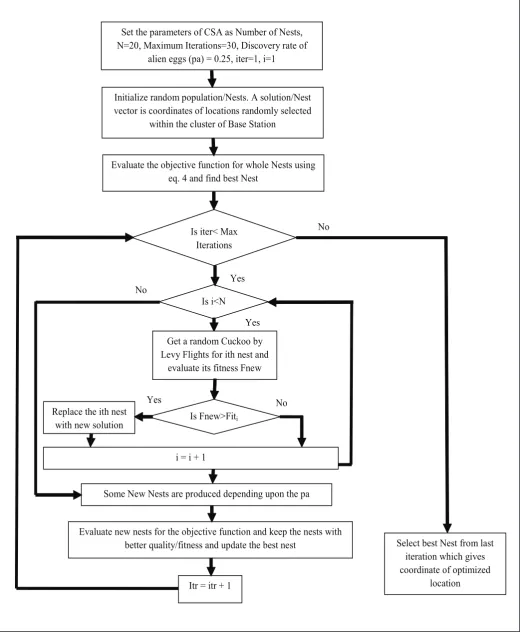
In the proposed work location of Base Transceiver Station (BTS) is optimized using Cuckoo Search Algorithm. Three main parameters; Path Loss, Attenuation, and Power Received by Mobile Station (MS) are considered for this problem of finding the optimized location. And optimal solution is find so that power received is maximum, path loss and attenuation is minimum. The algorithmic flow of work is shown in figure 1. An area of 100 X 100 is considered for deployment of network.
In this area a population of mobile stations (MSs) is created. Then the desired number of Base Stations to cover the whole population is initially deployed on randomly selected locations. Then each MS is assigned under the least distant BS and hence coverage cluster of every BS is built on the basis of Euclidean distance. Then Cuckoo search algorithm as in figure 2 is applied to find the optimal location of each BS in its cluster with respect to the locations of MSs covered under it so that maximum fitness is achieved for the objective function represented by equation (4).
VI. Result and Discussion
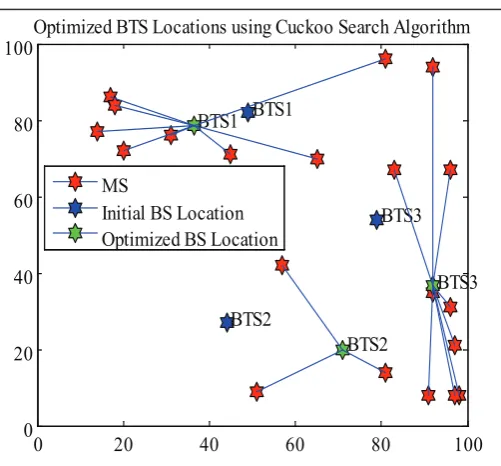
To confine the performance analysis of the projected CSA algorithm in the BTS localization problem and to study its performance against PSO algorithm, experiments are performed using both algorithms for same scenarios. Results were analyzed considering fixed population of mobile stations but with varying number of mobile stations from 2 to 4. And here the results for the case of 3 BSs are discussed and compared. Figures 3 to 11are qualify the performances of CSA over PSO. Figure 3 shows the random locations of population of 20 mobile stations and initial random locations of 3 base stations before optimization. And figure 4 and 5 describes the results after optimization. Fig. 4 shows the optimized locations of BSs searched by PSO and fig. 5 the optimized BS locations searched by CSA.
Figures 6 and 7 describes the statistical analyses of all the parameters Power received, path loss, and attenuation for all three BS locations searched by PSO and CSA respectively.
Start
Create a population of mobile stations (MSs) in
given area
Enter desired number of Base Station (BSs)
required for given population
Create initial random locations of BSs which are to be optimized
Build coverage cluster of every BS on the basis
of Euclidean distance i.e. assign mobile station to a least distant BS
Optimize the location of each BS in its cluster
w.r.t. the locations of MSs covered under it using CSA as in fig. 2
Calculate and analyze the final parameters
Power Received, Path loss, and Attenuation
Stop
Is i<N
No Yes
No Set the parameters of CSA as Number of Nests, N=20, Maximum Iterations=30, Discovery rate of
alien eggs (pa) = 0.25, iter=1, i=1
Initialize random population/Nests. A solution/Nest vector is coordinates of locations randomly selected
within the cluster of Base Station
Evaluate the objective function for whole Nests using eq. 4 and find best Nest
Is iter< Max Iterations
Some New Nests are produced depending upon the pa
Evaluate new nests for the objective function and keep the nests with better quality/fitness and update the best nest
Itr = itr + 1
Select best Nest from last iteration which gives coordinate of optimized
location No
i = i + 1
Get a random Cuckoo by Levy Flights for ith nest and
evaluate its fitness Fnew Yes
Yes Replace the ith nest
with new solution Is Fnew>Fiti
0 20 40 60 80 100 0
20 40 60
80
100Random Mobile Station & BTS Locations before Optimization
BTS1
BTS2
BTS3
Mobile Station BTS
Fig. 3: Initial Random Base Station Locations and Cluster Formation (3 BS and 20 MS)
0 20 40 60 80 100
0 20 40 60
80
100 Optimized BTS Locations using PSO Algorithm
BTS1
BTS2
BTS3 BTS1
BTS2 BTS3
MS
Initial BS Location
Optimized BS Location
Fig. 4: Optimized Locations of all three Base Stations Searched by PSO
0 20 40 60 80 100
0 20 40 60 80
100Optimized BTS Locations using Cuckoo Search Algorithm
BTS1
BTS2
BTS3 BTS1
BTS2
BTS3 MS
Initial BS Location Optimized BS Location
Fig. 5: Optimized Locations of all three Base Stations Searched by CSA
-300 -200 -100
0 100 200
300Power, Path Loss & Attenuation for All the BTS using PSO
191.2098
-238.4729 122.4951
BTS1
187.4806
-163.7329 86.2858
BTS2
220.8858
-210.4406 108.9143
BTS3 Power
Path Loss Attenuation
Fig. 6: Power Received, Path loss, and Attenuation for all three BS locations searched by PSO
-500
0
500Power, Path Loss & Attenuation for All the BTS using CSA
400.2412
-487.9889 67.1508
BTS1
400.9279
-488.6755
67.2404
BTS2
399.6706
-487.4183
67.0764
BTS3
Power Path Loss Attenuation
Fig. 7: Power Received, Path loss, and Attenuation for all three BS locations searched by CSA
0 50 100 150 200 250 300 350 400
450 Power comparison Graph for both Algorithms
400.2412
191.2098
BTS1
400.9279
187.4806
BTS2
399.6706
220.8858
BTS3 CSA
PSO
-500 -400 -300 -200 -100
0 Path Loss comparison Graph for both Algorithms
-487.9889 -238.4729
BTS1 -488.6755
-163.7329
BTS2 -487.4183
-210.4406
BTS3 CSA
PSO
Fig. 9: Path Loss comparison for all three BS Locations Searched by CSA and PSO
0 20 40 60
80
100 120
140 Attenuation comparison Graph for both Algorithms
67.1508 122.4951
BTS1
67.2404
86.2858
BTS2
67.0764
108.9143
BTS3 CSA
PSO
Fig. 10: Attenuation Comparison for all three BS Locations Searched by CSA and PSO
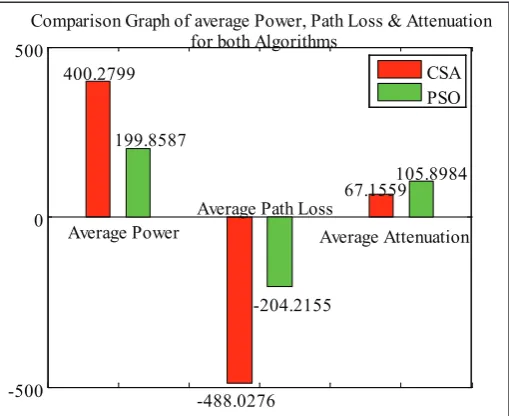
-500
0 500
Comparison Graph of average Power, Path Loss & Attenuation
for both Algorithms
400.2799
-488.0276
67.1559 199.8587
-204.2155
105.8984
Average Power Average Path LossAverage Attenuation
CSA
PSO
Fig. 11: Comparison of Average Power, Average Path Loss, and Average Attenuation of all three BS locations searched by CSA and PSO
Table 1: Comparison of all Parameters of BS Locations Searched by CSA and PSO
Parameter BTS Proposed Algorithm (CSA)
Literature Algorithm (PSO)
Power Received
BTS 1 400.2412 191.2098 BTS 2 400.9279 187.4806 BTS 3 399.6706 220.8858
Average 400.2799 199.8587
Path Loss
BTS 1 -487.9889 -238.4729 BTS2 -488.6755 -163.7329 BTS 3 -487.4183 -210.4406
Average -488.0276 -204.2155
Attenuation
BTS 1 67.1508 122.4951 BTS 2 67.2404 86.2858 BTS 3 67.0764 108.9143
Average 67.1559 105.8984
From figures 8 to 11 and table 1 it is very clear that the power received from all the BS locations searched by CSA are greater than the power received from BS location searched by PSO. Also the signal which travels from location searched by CSA suffers lesser path loss and attenuation than the location searched by PSO. So CSA outperforms PSO in every respect.
VII. Conclusion
In this work a relatively new system of optimization of swarm intelligence family that is defined as “cuckoo search algorithm” is explained in detail. The previous work on Base Station optimization algorithms is tried to be reviewed. Most of the work in the literature is carried out in recent years and researchers mainly concentrated on continuous optimization problems. Previous work has presented that cuckoo search algorithm have a very promising potential for modeling and solving complex optimization problems. In this thesis work CSA is applied to determine the optimal location of BTS. The proposed work has ability to achieve optimal solution of coverage problem with desired number of BTS in cellular networks. This approach cultivates an innovative idea employing the CSA with enhanced fidelity. The results show that the CSA approach is effective and robust for efficient coverage problem of BTS location and is considered to give almost the optimal solution in wireless communication network.
References
[1] Ahmed, I. E., Qazi, B. R., Elmirghani, J. M.,"Energy-efficient base stations locations optimization in an airport environment", In Next Generation Mobile Applications, Services and Technologies (NGMAST), 2012 6th International Conference on, pp. 199-204. IEEE, 2012.
[2] Awasthi, A., Arora, N.,“An Approach to BTS Localization using Optimization Techniques”, International Journal of Engineering Research & Technology (IJERT), Vol. 3, Issue 4, pp. 747-751, 2014.
[3] Dvorsky, M., Michalek, L., Moravec, P., Sebesta, R., "Improved GSM-based localization by incorporating secondary network characteristics", In NETWORKING 2012 Workshops, pp. 139-144. Springer, 2012
[5] Singh, S., Kaur, K.,“Base Station Localization using Artificial bee colony Algorithm”, International Journal of Computer applications, Vol. 64, 9, pp. 1-5, 2013
[6] Soto, C. Y., Covarrubias, D. H., Villarreal, S.,“Base Station Placement Optimization Algorithm for Heterogeneous Distributions of Mobile users with Multi-service requirements”, IEEE Latin America Transactions, Vol. 10, No. 5, pp. 2032-2039, 2012.
[7] Yang, X.-S., Deb, S.,“Cuckoo search via Levy flights”, in: Proc. of World Congress on Nature &Biologically Inspired Computing (NaBIC 2009), December 2009, India. IEEE Publications, USA, pp. 210-214 (2009).
[8] Yang, X.-S., Deb, S.,“Engineering Optimisation by Cuckoo Search”, Int. J. Mathematical Modelling and Numerical Optimisation, Vol. 1, No. 4, pp. 330–343, 2010.
Sarabjeet Singh received his B.Tech degree in Electronics and Communication Engineering from Punjab Technical University, Punjab, India in 2012, the M.Tech. degree Electronics and Communication Engineering from Punjab Technical University, Punjab, India in 2014. He is a Project Executive, Muskaan Power Infrastructure Limited.