VOLUME 10 | ISSUE 3 | 2015 | 815
Influence of sociological aspects on the level of
physical activity in physical education students
JÚLIO MARTINS 1,2 , BRUNO TORRES 1, JOÃO CARDOSO 1, ALDO M. COSTA 1,3,
SAMUEL HONÓRIO 4
1 University of Beira Interior, Department of Sport Sciences, UBI, Covilhã, Portugal 2 Research Centre in Physical Activity, Health and Leisure, CIAFEL, Porto, Portugal 3 Research Centre in Sports, Health and Human Development, CIDESD, Portugal 4 Higher School of Education in Torres Novas, CIFOC, Portugal
ABSTRACT
Martins, J., Torres, B., Cardoso, J., Costa, A.M., & Honório, S. (2015). Influence of sociological aspects on the level of physical activity in physical education students. J. Hum. Sport Exerc., 10(3), pp.815-826. Adopting and maintaining an active lifestyle for adolescent students, seems to be impaired and influenced by several factors, among them stand out environmental, psychological and social factors. Thus, the general objectives of this study were submitted to study and understand the extent to which these environmental, social and personal factors help and influence the level of physical activity (PA) by the adolescents in school age. More specifically, we will study: (1) the possible association between level of physical activity, age and gender; (2) consider and determine whether there is an association between socioeconomic variables and physical activity level of the population sample; (3) assess on the possible association between environmental variables and perceived physical activity of the adolescents. The sample consisted of 286 high school students, male gender (n = 125) and female (n = 161) aged between 15 and 18 years of age. As an instrument of study, a questionnaire was used. The main results of this study demonstrate a possible relationship between gender and level of PA, while boys tend to be more active than girls and also an association between socioeconomic variables and level of physical activity. Key
words:PHYSICAL ACTIVITY, ADOLESCENTS, SOCIO-ECONOMIC STATUS, ENVIRONMENT.
1 Corresponding author. Universidade da Beira Interior, Departamento de Ciências do Desporto Rua Marquês de Ávila e
Bolama. 6201-001 Covilhã. Portugal. E-mail: jmartins4@gmail.com
Submitted for publication September 2013 Accepted for publication March 2015
JOURNAL OF HUMAN SPORT & EXERCISE ISSN 1988-5202 © Faculty of Education. University of Alicante
816 | 2015 | ISSUE 3 | VOLUME 10 © 2015 University of Alicante INTRODUCTION
It is on common sense that physical activity (PA) is indicated as an essential tool for the adoption and maintenance of a healthy lifestyle, according to the parameters of health and well - being, contributing determinedly to prevent diseases, particularly cardiovascular disease (Gordo, Quadros, Camps, Petroski, 2006). This regular practice of physical activity, that in general begins at younger ages, is also associated with the adoption of more active lifestyles, contributing to better physical fitness in adult age, allowing the quality of life to increase over the same, eliminating in a more permanent and long lasting way some styles and lifestyles more sedentary.
However, as recent studies show us (Real, Balaguer, Dias, Corredeira, Fonseca, 2008) this same practice is not yet a habit of life of the Portuguese and this is proved with increased sedentary lifestyle in our society, not only in adult life but also in younger ages, where the practice of physical activity, whether regular or in a controlled environment , has been declining (Real, Balaguer, Dias, Corredeira, Fonseca, 2008), showing a common trend in today's world, not only in Portugal (Campos, Gomes, Oliveira, 2008) but also at European level, supported by quite recent studies (Trost et al., 2002). When we found these data, we established as major challenge, trying to understand the factors that influences the decline of Physical activity in adolescents, and in a way that behaviors lead to a sedentary lifestyle, without habits of practice of any kind of physical activity.
The literature shows influences from different quadrants, where we include the influence of friends, the motivation and predisposition to physical activity, the taste for any sport, the option to perform tasks more pleasurable without energy waste (watching TV, playing on PC ...). However, it is perceptible the relationship between environmental, psychological and social factors in the practice and level of PA in younger ages, being that sex, gender, geographical location and socio - economic aspects are modelers of behaviors in adolescents in school age (Gordo, Quadros, Camps, Petroski, 2006).
Another factor that seems to affect so strongly the level of physical activity at younger ages, is the environmental factor and its involvement. An increase of local crime and the fact that you do not feel safe in physical activity, as the lack of places of leisure and recreation, suitable for various sports may somehow influence directly the level of PA.
We also know that in adolescence, the family plays a central role in the practice of PA in its various forms (Mota & Smith, 1999), whether structured or random, contributing for the teenager to participate and get involved in a more or less facilitated way in various physical activities. According to a study by (Campos et al., 2001), in general, teenagers in school age with poorer backgrounds tend to be less active due to the lack of access to extracurricular practices of physical activity.
VOLUME 10 | ISSUE 3 | 2015 | 817 MATERIALS AND METHODS
Sample
It was selected a sample of 286 students of both genders, being 125 male (43.7%) and 161 female (56.3%), aged between 15 and 20 years of age. All students who participated in this study were attending at the time of this study Sé High School (Guarda). We have to stress that five classes were arbitrarily selected from each of the three levels of education (10º, 11º and 12º year of schooling). To be a part of the study only students who were enrolled at the subject of Physical Education in this academic year (2010-2011) were allowed and were excluded from the study all the classes who possessed less than 10 students.
Sociological Data:
As a way of collecting socioeconomic data from the sample that participated in the study, it was used a questionnaire composed of several closed issues, considering the variables of gender, age and grade. It was also included in this questionnaire, the variables of parents’ socioeconomic status, considering the Father and Mother scholarity, as well as their profession.
As a way to determine the socio-economic positions, the Father and Mother professions were grouped and classified according to the National Classification of Occupations and then be grouped into three levels (Level 1 - Low, Level 2 - Middle; Level 3 - High) The level parents schooling was defined according to the National Education System and it was also divided into three categories (Level 1 - Low, Level 2 - Middle; Level 3 - High).
Physical activity level
Another instrument used to assess the level of physical activity was the Telama questionnaire et al. (1997). This tool, already used previously in similar studies (Mota et al., 2002) was composed by five (5) questions which sought to identify the physical practices and extra - curricular done by the adolescents in Sé High School, specifically with respect to its frequency, intensity, , physical activity character (organized / arranged).
These questions were answered according to a scale of values ranging from 1 to 6, where the final summation of scores obtained in each of the issues set out a physical activity index, providing an assessment of between five (5) and twenty-four (24) values.
Characteristics of environmental involvement
The International Physical Activity Prevalence Study (IPS) was the instrument used to evaluate the characteristics of the surrounding environment. This variable has been used as a way to measure on the relationship between environmental factors and physical activity (Mota & Smith,1999), including many variables that in one form or another are associated with different levels of Physical activity, observed in previous studies, nationally and internationally.
818 | 2015 | ISSUE 3 | VOLUME 10 © 2015 University of Alicante
Statistical analysis
All study data were treated by the statistical program SPSS (Statistical Package for the Social Sciences), version 17.0, with a significance level ≤ 0.05. As a way of grouping the subjects assed on their level of physical activity, four categories were created, "Sedentary" Little active"," Moderately active "and "very active". All the analysis done regarding the socio-economic status and environmental variables in association with the perceived level of AF, were performed separately because is shown in the analysis of the sample the existence of statistically and significant differences between genders.
The crosstab was used to calculate the percentage of individuals for each of the different levels of physical activity, carrying out the same procedure in order to group the adolescents according to the level of physical activity in association with the socioeconomic status variables and the neighborhood environment. It was also applied the Chi-square (X ^ 2) test in order to determine the existence of a relationship of dependence between variables. There has also been a beverage correlation analysis between the socio-economic variables and environmental variables in association with the alleged level of physical activity, through spearman correlation. To enable a better visualization of the results, we constructed a statistical tabular.
RESULTS
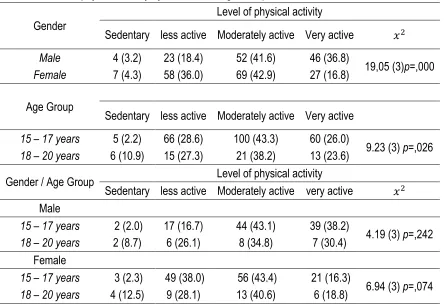
Table 1 shows the level of physical activity by gender and age group. Table 1. Level of physical activity by Gender and Age Group.
Gender
Level of physical activity
Sedentary less active Moderately active Very active 𝑥!
Male 4 (3.2) 23 (18.4) 52 (41.6) 46 (36.8)
19,05 (3)p=,000
Female 7 (4.3) 58 (36.0) 69 (42.9) 27 (16.8)
Age Group
Sedentary less active Moderately active Very active
15 – 17 years 5 (2.2) 66 (28.6) 100 (43.3) 60 (26.0)
9.23 (3) p=,026
18 – 20 years 6 (10.9) 15 (27.3) 21 (38.2) 13 (23.6)
Gender / Age Group Level of physical activity
Sedentary less active Moderately active very active 𝑥!
Male
15 – 17 years 2 (2.0) 17 (16.7) 44 (43.1) 39 (38.2)
4.19 (3) p=,242
18 – 20 years 2 (8.7) 6 (26.1) 8 (34.8) 7 (30.4)
Female
15 – 17 years 3 (2.3) 49 (38.0) 56 (43.4) 21 (16.3)
6.94 (3) p=,074
VOLUME 10 | ISSUE 3 | 2015 | 819
Analyzing the data in Table 1, we are able to verify that concerning the gender on the sample, both in males (41.6% = moderately active and very active = 36.8%) as in females (moderately active = 42.9 % and very active = 16.8%), over 50% of adolescents have a high level of physical activity. However, in females, the percentage of adolescents located in areas of lower physical activity increases considerably (sedentary = 4.3 and less active = 36.0%), in other words a total of 40.3% of girls have a lower level of physical activity practice, unlike the males (sedentary = 3.2% and little active = 18.4%), where only 21.6% of the total male sample have a low level of physical activity.
Comparatively to the statistical differences found between the values of physical activity and gender of the sample, they are significant (p = 0.000), that can suggest a strong relationship between gender and level of physical activity.
Regarding the differences in the level of physical activity among each age groups, we can conclude that in the lower age groups the percentage of adolescents with a level of physical activity considered sedentary is rather minor (2.2%) compared with the largest age group, where there are 10.9% of students in that same physical activity level. We can verify that for higher levels of PA, the youngest age group has a slightly higher percentage (43.3% = moderately active and very active = 26.0%) compared with the higher age group (38.2% = moderately active and very active = 23.6%). The differences found between these two variables are statistically significant (p = 0.026), which leads us to conclude that adolescents of higher age categories have a lower rate of PA, reaffirming the findings of some studies that consider that the level of PA decreases with the increasing of age.
Through the analysis of data recorded, we are able to verify that for males, the total percentage of adolescents with a sedentary level of physical activity and less active, increases with the advancing of age (15 - 17 years = 18.7% / 18 - 20 years = 34.8%), which consequently causes a decrease in the percentage of adolescents with a level moderately active and very active (15 - 17 years = 81.3 / 18 - 20 years = 65.2%) among older people. We also found that for both males (2.0%) and for females (2.3%), the percentage of adolescents with a low level of PA is reduced. The analysis of differences in the level of FA across age groups of the same gender are not statistically significant nor for males or for females (p = 0.242 and p = 0.074).
Socioeconomic status and physical activity
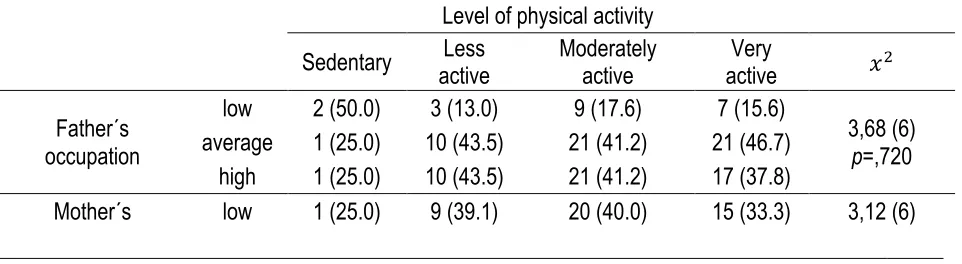
In this parameter in our study, we present in Tables 3 and 4 the results of the analysis to the percentage of adolescents in each group-level physical activity and its possible association with the variables of socioeconomic status, differentiating and making a separate analysis for each a gender, male and female. Table 2. Percentage of adolescent males by level of physical activity, according to the variables of socioeconomic status.
Level of physical activity
Sedentary active Less Moderately active active Very 𝑥!
Father´s occupation
low 2 (50.0) 3 (13.0) 9 (17.6) 7 (15.6)
3,68 (6) p=,720 average 1 (25.0) 10 (43.5) 21 (41.2) 21 (46.7)
high 1 (25.0) 10 (43.5) 21 (41.2) 17 (37.8)
820 | 2015 | ISSUE 3 | VOLUME 10 © 2015 University of Alicante
occupation average 1 (25.0) 2 (8.7) 5 (10.0) 9 (20.0) p=,793 high 2 (50.0) 12 (52.2) 25 (50.0) 21 (46.7)
Father´s education
low 3 (75.0) 11 (47.8) 20 (41.6) 18 (39.1)
2,92 (6) p=,818 average 1 (25.0) 7 (30.4) 19 (39.6) 17 (37.0)
high 0 (0.0) 5 (21.8) 9 (18.8) 11 (23.9) Mother´s education
low 1 (25.0) 6 (26.1) 14 (29.2) 11 (23.9)
5,59 (6) p=,470 average 1 (25.0) 5 (21.7) 14 (29.2) 21 (45.7)
high 2 (50.0) 12 (52.2) 20 (41.6) 14 (30.4)
As regards the analysis of the possible association between physical activity and variables in socioeconomic status for both sexes, it tells us that there are no significant differences for each. However, it is noteworthy the fact that in males in association with his father's profession, it denotes a slight tendency for adolescents whose father is a professional level of medium or high are also at higher percentage levels of physical activity most high (moderately active and very active).
For the male gender and education level of parents, it seems a little influence the level of physical activity, given that students with a sedentary level of PA, are those whose father's educational level is lower (75%) compared with students very active (39.1%). The association between maternal education and the PA level of adolescent males seem to maintain an opposite trend, ie a higher level of schooling by the mother appears to contribute to a lower level of PA.
Table 3. Percentage of adolescent females by level of physical activity, according to the variables of socioeconomic status.
LEVEL OF PHYSICAL ACTIVITY
Sedentary Active Less Moderately active active Very x!
FATHER’S OCCUPATION
LOW 2 (28.6) 6 (10.5) 15 (22.7) 0 (0.0)
15,30 (6) p=,018 AVERAGE 1 (14.3) 32 (56.1) 22 (33.4) 11 (45.8)
HIGH 4 (57.1) 19 (33.4) 29 (43.9) 13 (54.2) MOTHER'S
OCCUPATION
LOW 5 (71.4) 25 (44.6) 31 (44.9) 12 (46.2)
10,12 (6) p=,117 AVERAGE 2 (28.6) 13 (23.2) 10 (14.5) 1 (3.8)
HIGH 0 (0.0) 18 (32.2) 28 (40.6) 13 (50.0) FATHER’S
EDUCATION
LOW 5 (71.4) 34 (59.6) 32 (47.8) 5 (20.8)
11,81 (6) p=,066 AVERAGE 1 (14.3) 12 (21.1) 18 (26.9) 9 (37.5)
HIGH 1 (14.3) 11 (19.3) 17 (25.3) 10 (41.7) MOTHER’S
EDUCATION
LOW 1 (16.7) 23 (40.4) 28 (40.6) 2 (7.7)
14,05 (6) p=,029 AVERAGE 4 (66.7) 16 (28.1) 18 (26.1) 12 (46.1)
HIGH 1 (16.6) 18 (31.5) 23 (33.3) 12 (46.2)
VOLUME 10 | ISSUE 3 | 2015 | 821
Thus, the highest percentage of female adolescents with a sedentary level of AF (57.1%) are related to a higher professional level of the father. In contrast, a mother's education level lower corresponds to the highest percentage of adolescents with a sedentary level of AF (71.4%).
The differences are still statistically significant (p = 0.029) between the mother's education and physical activity level, suggesting that more active girls are related to a higher level of schooling by the mother. Table 4. Percentage of responses to male gender issues perceived environmental variables, according to the level of physical activity.
Perceived environmental characteristics and physical activity:
Disagree Agree don´t know x!
Question 1 - Most residential streets in my area have sidewalks.
Sedentary 1 (25.0) (75.0) 3 0 (0.0)
12.60 (12) p=,050 Less active 5 (21.7) (73.9) 1 (4.4) 17
Moderately
active 3 (5.8) (94.2) 49 0 (0.0) Very active 2 (4.3) (95.7) 44 0 (0.0)
Question 2 - On the roads of my residential area, there are routes for cyclists.
Sedentary 4 (100) 0 (0.0) 0 (0.0)
5,78 (6) p=,449 Less active 17 (73.9) (17.4) 4 2 (8.7)
Moderately
active 39 (75.0) (17.3) 4 (7.7) 9 Very active 31 (67.4) (30.4) 14 1 (2.2)
Question 3 - In my area there are several residential areas of recreation and leisure, for
free.
Sedentary 2 (50.0) (50.0) 2 0 (0.0)
5,86 (6) p=,439 Less active 7 (30.4) (60.9) 14 2 (8.7)
Moderately
active 16 (30.8) (67.3) 1 (1.9) 35 Very active 14 (30.4) (69.6) 0 (0.0) 32
Question 4 - There is so much traffic in the streets it becomes unpleasant or dangerous
walking in a residential area.
Sedentary 3 (75.0) (25.0) 0 (0.0) 1
6,34 (6) p=,386 Less active 17 (73.9) (26.1) 6 0 (0.0)
Moderately
active 44 (84.6) (13.5) 7 1 (1.9) Very active 31 (67.4) (32.6) 15 0 (0.0) Question 5 - I see many people doing exercise
822 | 2015 | ISSUE 3 | VOLUME 10 © 2015 University of Alicante
Less active 10 (43.5) (56.5) 0 (0.0) 13 Moderately
active 17 (32.7) (65.4) 34 1 (1.9) Very active 13 (28.3) (71.7) 33 0 (0.0)
Question 6 - The crime rate in my residential area does not allow day trips in safety
Sedentary 4 (100) 0 (0.0) 0 (0.0)
4,54 (6) p=,604 Less active 19 (82.6) (13.1) 3 1 (4.3)
Moderately
active 49 (94.2) 3 (5.8) 0 (0.0) Very active 43 (93.5) 2 (4.3) 1 (2.2)
Question 7 - There are many sites close to my house where I can easily walk.
Sedentary 0 (0.0) (100) 0 (0.0) 4
0,83 (3) p=,841 Less active 4 (17.4) (82.6) 19 0 (0.0)
Moderately
active 9 (17.3) (82.7) 43 0 (0.0) Very active 8 (17.4) (82.6) 38 0 (0.0)
Now covered in the item, in table 5 and 6, we present the results from analysis of the various questions of the questionnaire used in the study related to environmental variables perceived by the sample. We present for each respective percentages of responses obtained by adolescents in males and females separately.
With regard to the analysis of Table 6, we conclude that for males, significant differences (p = 0.05) between the fact that there are walks in the area of residence and level of physical activity, whereas the highest percentage of agreement occurs in physical activity levels were higher (94.2% = moderately active and very active = 95.7%). The fact that there isn’t a crime rate in the residential area of adolescents (question 8) seems to influence the level of PA, since the greatest percentage of adolescents who disagree with this statement are found in higher levels of FA (moderately active = 94.2% and very active = 93.5%). Table 5. Percentage of responses to female gender issues perceived environmental variables, according to the level of physical activity.
Agree Disagree don´t know x!
Question 1 - Most residential streets in my area have sidewalks.
Sedentary (0.0) 0 7 (100) 0 (0.0)
8,66 (6) p=,194 Less active (15.5) 9 47 (81.1) 2 (3.4)
Moderately
VOLUME 10 | ISSUE 3 | 2015 | 823
Question 2 - On the roads of my residential area, there are routes for cyclists.
Sedentary (85.7) 1 (14.3) 0 (0.0) 6
7,88 (6) p=,247 Less active (75.9) 12 (20.7) 2 (3.4) 44
Moderately
active (82.6) 57 9 (13.1) 3 (4.3) Very active (77.8) 21 2 (7.4) (14.8) 4
Question 3 - In my area there are several residential areas of recreation and leisure, for
free.
Sedentary (57.1) 4 3 (42.9) 0 (0.0)
3,27 (3) p=,352 Less active (32.8) 39 (67.2) 0 (0.0) 19
Moderately
active (33.3) 23 46 (66.7) 0 (0.0) Very active (22.2) 6 21 (77.8) 0 (0.0)
Question 4 - There is so much traffic in the streets it becomes unpleasant or dangerous
walking in a residential area.
Sedentary (85.7) 6 1 (14.3) 0 (0.0)
1,56 (6) p=,956 Less active (79.3) 12 (20.7) 0 (0.0) 46
Moderately
active (78.3) 14 (20.3) 1 (1.4) 54 Very active (77.8) 6 (22.2) 0 (0.0) 21
Question 5 - I see many people doing exercise in my residential area.
Sedentary (71.4) 2 (28.6) 0 (0.0) 5
11,88 (6) p=,065 Less active (19.0) 11 46 (79.3) 1 (1.7)
Moderately
active (23.2) 16 50 (72.5) 3 (4.3) Very active (33.3) 18 (66.7) 0 (0.0) 9
Question 6 - The crime rate in my residential area does not allow day trips in safety.
Sedentary (100) 7 0 (0.0) 0 (0.0)
5,64 (6) p=,464 Less active (84.5) 49 7 (12.1) 2 (3.4)
Moderately
active (91.3) 63 3 (4.3) 3 (4.4) Very active (96.3) 26 1 (3.7) 0 (0.0)
Question 7 - There are many sites close to my house where I can easily walk.
Sedentary (28.6) 5 (71.4) 0 (0.0) 2
2,42 (3) p=,491 Less active (12.1) 17 51 (87.9) 0 (0.0)
Moderately
824 | 2015 | ISSUE 3 | VOLUME 10 © 2015 University of Alicante
Very active (11.1) 24 (88.9) 0 (0.0) 3
Analyzing the Table 5, we conclude that for females there are no significant differences between any of the perceived environmental variables and their association with the level of physical activity. However, relative to question 5, the adolescent females appear to consider it important that there are people working out in your residential area, because the greater percentage of adolescents who disagrees with this assertion is at the level of sedentary AF (71, 4%).
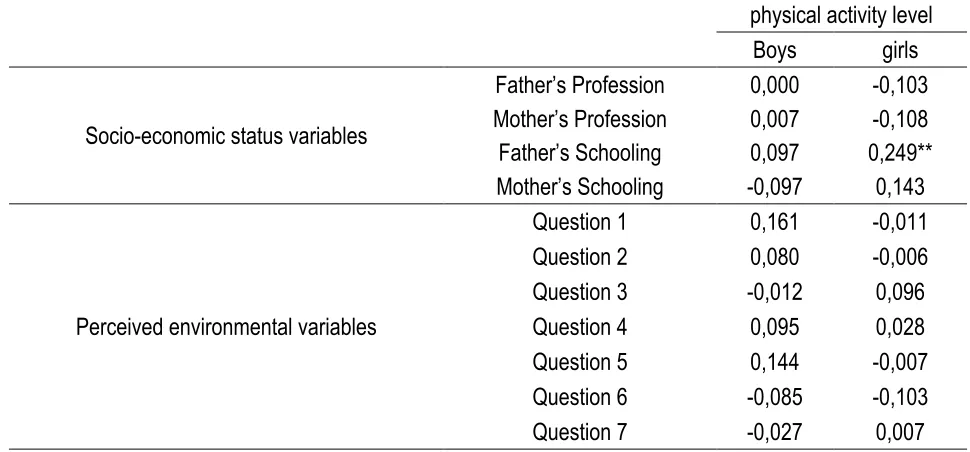
Table 6 presents the correlation coefficients of the analysis between the level of physical activity and socio-economic variables and perceived environmental variables, using for this purpose the Spearman correlation.
Table 6 - Spearman correlation coefficients for the variables of socioeconomic status, perceived environmental and variables, for each gender.
physical activity level
Boys girls
Socio-economic status variables
Father’s Profession 0,000 -0,103 Mother’s Profession 0,007 -0,108 Father’s Schooling 0,097 0,249** Mother’s Schooling -0,097 0,143
Perceived environmental variables
Question 1 0,161 -0,011
Question 2 0,080 -0,006
Question 3 -0,012 0,096
Question 4 0,095 0,028
Question 5 0,144 -0,007
Question 6 -0,085 -0,103
Question 7 -0,027 0,007
With regard to socio-economic variables and their correlation with the level of physical activity, there are only significant correlations for females, in association with the level of paternal education (p = 0.002). For the males, there are no significant correlations. To perceived environmental variables, in both sexes is not verified any significant correlation.
DISCUSSION
VOLUME 10 | ISSUE 3 | 2015 | 825
adolescence contributes decisively to there is a decrease in the number of sedentary people in adulthood (Gordo, Quadros, Camps, Petroski, 2006).
After several studies (Sallis & Owen, 1999; Real, Balaguer, Dias, Corredeira, Fonseca, 2008), have been proven that teenagers do not practice physical activity that allow them to obtain a good level of PA in a future life, with the highest incidence for females. The results obtained during our investigation allow us to find statistically significant differences in the level of physical activity in association with the genre, revealing that 40.3% of girls are in groups of lower PA level (sedentary = 4.3% and very active = 36%), contrary to males, where only 21.6% of adolescents are the same levels of physical activity.
These data indicate a greater predisposition to physical activity by males, which goes against other studies (Mota & Smith, 1999). Regarding the age group, for the higher levels of PA, the youngest age group has a slightly higher percentage (43.3% = moderately active and very active = 26.0%) compared with the higher age group (38.2% = moderately active and very active = 23.6%), which goes against some studies (Harrell, Mcmurray, Baggett, Pennell, Pearce, Bangdiwala, 2005). The family in today's society, it behaves as a fundamental means for creating a healthy lifestyle in adolescents of school age (Mota & Smith, 1999) and is also responsible for youth participation in extracurricular sports activities (Campos et al., 2001). However, according to some studies (Campos et al., 2001; Mota & Smith, 1999), the fact that adolescents belonging to lower socioeconomic levels may be related to a lower level of physical activity.
According to the study, there appears a slight tendency for females only, for teens whose parent's socioeconomic level is higher are at a level of physical activity over sedentary. Yet for the same kind, a mother's education level lower corresponds to the highest percentage of adolescents with a more sedentary level of PA (71.4%). The differences were statistically significant for both cases (p = 0.018 and p = 0.029, respectively). The environmental characteristics of the surrounding area of adolescent are related to a better quality of life and the adoption of healthier lifestyles among young people (Matos, M., Carvalho, S., Diniz, J., 2001). Also according to some studies (Gordo, Quadros, Camps, Petroski, 2006), access to their own areas of recreation and leisure has a positive influence in the PA level of adolescents.
However, analysis of the results of our study can not corroborate them, since only statistically significant differences in environmental variables (existence of walks in the residential area), in association with male gender and level of PA.
In this sense, the socio-economic variables together with environmental variables assume a leading role in creating healthy lifestyles among adolescents of both sexes, which demands a more effective of the various quadrants of our society as a warning to families and bodies, become aware of their influence on the level of physical activity of adolescents in our society.
CONCLUSIONS
826 | 2015 | ISSUE 3 | VOLUME 10 © 2015 University of Alicante
there are only statistically significant differences for one of the questions (there are walks in the residential area).
For the correlations between socio-economic variables and environmental variables, in association with the level of physical activity, they are statistically significant only for the father's education, for females was not observed any correlation between variables the study and the male gender.
REFERENCES
1. Brodersen, N., Steptoe, A., Williamson, S., & Wardle, J. (1999). Sociodemographic, developmental, environmental, and psychological correlates of physical activity and sedentary behavior at age 11 to 12. Annals of Behavioral Medicine, 29, pp.2-11.
2. Campos, L., Gomes, J., & Oliveira, J., (2006). Obesidade Infantil, Actividade Física e Sedentarismo em crianças do 1º ciclo do ensino básico da cidade de Bragança (6 a 9 anos). Revista do Desporto e Saúde, 4(3), pp.17-24.
3. Gonçalves, V. (2005). Factores de Influência na Actividade Física: Estatuto Socio – Económico e Factores Ambientais e a sua relação com as diferenças de nível de Actividade Física dos Adolescentes (Dissertação de Mestrado). FCDEF – UP.
4. Gordia, A., Quadros, T., Campos, W., & Petroski, É. (2008). Nível de actividade física em adolescentes e sua associação com variáveis sociodemográficas. Revista Portuguesa de Ciências do Desporto, 10(1), pp.172-179.
5. Harrell, J., Murray, R., Baggett, C., Pennell, M., Pearce, P., & Bangdiwala, S. (2005). Energy costs of physical activities in children and adolescents. Med Sci Sports Exerc., 37(2), pp.329-336.
6. Lindquist, C., Reynolds, K., Goran, M. (1999). Sociocultural determinants of physical activity among children. Preventive Medicine, 29, pp.305-312.
7. Matos, M., & Carvalhosa, S. (2001). A Saúde dos Adolescentes: Ambiente Escolar e Bem-Estar. Psicologia, Saúde & Doenças, 2, pp.43-53.
8. Matos, M., Carvalhosa, S., & Diniz, J. (2001). Actividade Física e Prática Desportiva nos Jovens Portugueses. Lisboa: Faculdade de Motricidade Humana.
9. Mccormack, G., Hawe, P., Perry, R., & Blackstaffe, A. (2011). Associations between familial affluence and obesity risk behaviours among children.International. Journal of Environmental Research and Public Health, 6, pp.2271-2287.
10. Monteiro, M. (2003). A Influência do ESE no Lazer Activo dos Adolescentes (Dissertação de Licenciatura). FCDEF – UP.
11. Mota, J., & Silva, G. (1999). Adolescent’s Physical Activity: Association with Socio – Economic Status and Parental Participation Among a Portuguese Sample. Sport, Education and Society, 4, pp.193-199.
12. Real, N., Balaguer, I., Dias, C., & Fonseca, A. (2008). Actividade física, prática desportiva, consumo de alimentos, de tabaco e de álcool dos adolescentes portugueses. Revista Portuguesa de Saúde Pública, 26(2), pp.17-25.
13. Santos, M., Gomes, H., Ribeiro, J., & Mota, J. (2000). Variação sazonal na actividade física e nas práticas de lazer de adolescentes portugueses. Revista Portuguesa Ciências do Desporto, 2, pp.192-201.