Abstract — Weld line is always considered as a common issue related with injection molding process and always be the main target by mold designers to avoid it. It is normally impossible to remove it especially when certain parts have a number of holes or there is a material entering into cavity through more than one gate. Therefore many researches and publications we re made on this topic purposely to learn the behavior of weld line occurred on molded parts particularly on plastic parts. In this study, a plastic product is decided to be a subject of analysis. The part is a thin plate with two holes and two cavities by using edge gate. Thermoplastic Polycarbonate/Acrylonitrile Butadiene S tyrene (PC/ABS ) is used as a plastic material. Taguchi Method is applied in identifying the optimum value of injection molding parameters and Moldflow Plastic Insight software is use d to simulate the injection molding process. The temperature differences on core and cavity plates are considered in simulation and the experimental shows that instead of melting temperature, temperature differences on mold also can help to minimize the length of weld line. This finding is absolutely a good way to minimize lengths of weld lines in a thin plate and also to improve the cosmetic appearance of the plastic parts produced.
Index Term— Injection molding; Plastic Injection Mold; Weld Line; Taguchi Method; ANOVA
I. INTRODUCTION
INJECTION molding process is notably known as one of the most productive processes used to form plastic parts. The effectiveness of this method highly depends on the quality of the product to be produced. Mold fabrication as well as machine setting can caus e a number of defects such as weld lines, warpage, jetting or sink marks which can reduce the quality of the molded parts. A weld line defect reduces aesthetical value to the parts as well as physical problems in the design of injection molded parts. The consumers who have no knowledge of injection molding process assume the existence of weld lines on parts they purchased as a kind of a scratch or a defect and this leads to customer’s unhappiness towards the products they have. This further affects sales of the plastic products in a long time.Weld lines are generally formed when two melt fronts come in contact with each other. In a part with multiple gates, variable wall thicknesses, holes or cores from separate melt fronts during mold filling and the separated melt fronts create weld lines, which causes many troubles in the part [1, 2]. It also creates imperfect products cosmetically, especially when using high gloss materials. The marks caused by this issue can be eliminated by the
application of induction heating in surface temperature control, which was investigated on ABS tensile bars by Chen et al. [3]. However, it needs a secondary process which is not cost-effective and it affects the quality of surface of the part. Full elimination of weld lines is not likely to be materialized without modifying the geometry of the part nevertheless their negative influence on its performance and appearance can be minimized. This can be fulfilled by undergoing a trial and error experiment or by model prediction. Computer simulation packages of injection molding are capable of predicting the weld line location accurately, but none of them can predict the weld lines’ properties quantitatively. This is mainly because a mathematical model for weld line properties is apparently not available [4].
The controlling of the flow for weld line positioning of multi-gated parts is normally carried out with a runner resizing method [5]. Mezghani [6] compared the simulated weld line location results with the real position on injection molded parts. Besides, Zhou and Li [7] presented a weld detector algorithm, which is based on the characteristics of th e initial meeting node while Chen [8] applied fuzzy theory for controlling the weld line position by varying the wall thickness and the gate location in part simulation models. Chun [9] showed a simulation effect of wall thickness and gate location on the formation and position of weld lines . This is agreed by Z.Shayfull et al. [10] who proved that the temperature differences of the core and cavity sides have effects on the quality of plastic part molded.
Hence in this research, the weld formation after the plastic material flows through the hole on a thin plate is investigated. The effect of setting parameters on the length of the weld line formation is analyzed properly with a consideration of mold temperature differences.
II. GATINGSYSTEMDESIGN
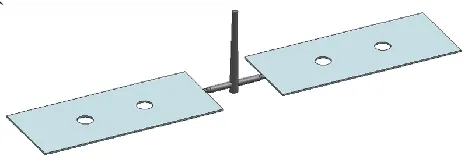
Mold designers should be able to identify types of suitable mold, its dimension, materials used for cavity insert, core insert as well as mold base in fabricating and designing a mold. Fig. 1 show a thin plate parts (120 x 50 x 1) mm with two holes diameter of 10 mm and gating system with edge gate (two-plate mold).
Optimizing Length of Weld Line Formation in
Thin Plate by Taguchi Method and Analysis of
Variance (ANOVA)
Z. Shayfull*, N.A. Shuaib, M.F. Ghazali, S.M. Nasir, Z.Nooraizedfiza,
School of Manufacturing Engineering, Universiti Malaysia Perlis, Malaysia`
The complete dimensions of gating system are shown in details in Fig. 2.
Fig. 3 shows the size of a cooling channel designed for the mold. The size of cooling channel is Ø6mm.
III. EXPERIM ENT
There are a number of parameters that have influences on an injection molding process, which are types of material used, types of mold base material, types of cavity insert material, types of machine, the profile of the parts, selection of coolant runners as well as selection of the coolant liquid. However in this study, only a few major factors are taken into considerations as to make sure the result can be achieved. Some assumptions are made which are;
i. Gate dimension factor is neglected because of its design is not identical for every part.
ii. The temperature of the environment is assumed constant. iii. The coolant is assumed as pure water.
iv. The effects of other minor factors (Other than melting temperature, mold temperature, filling and packing processes) are not to be under the topic of discussion. v. The layout of the cooling channels is assumed to
maintain a constant temperature.
vi. The effects due to the shape and size of the mold and product are neglected due to various shapes of product. vii.The plastic material used in all of the simulations is
amorphous thermoplastic PC/ABS blend, Cycoloy C2950HF from GE. Its viscosity is between 102 and 104 poise where the shear rate is in 102-103 s-1 range. The range of melt temperature is between 220 oC and 400oC approximately.
Basic physical and mechanical properties of PC/ABS are shown in Table I.
The parts comprise of both cavities generated with 67,270 pieces of triangular elements with smoothed mesh length of 1mm. The meshes of the parts are shown Fig. 4.
Specific heat, Cp (J/kgoC) 1871
Glass transition temperature, Tg (oC) 112
T hermal expansion coefficient, α (mm/mo
C) 74
Elastic modulus, E (MPa) 2.63 x 10³
Poisson's ratio, υ 0.23
T hermal conductivity, K (w/moC) 0.27
TABLE I
T HE PHYSICAL PROPERT IES OF PC/ABS
The Signal-to-noise (S/N) ratio is calculated according to Table IV. The length of weld line for hole – X of the thin plates obtained from the experiment is used to calculate the signal-to-noise (S/N) ratio to obtain the best parameter setting arrangement. From this technique, the percentage of contribution is calculated in determining which of the factor has significant effect on part’s warpage.
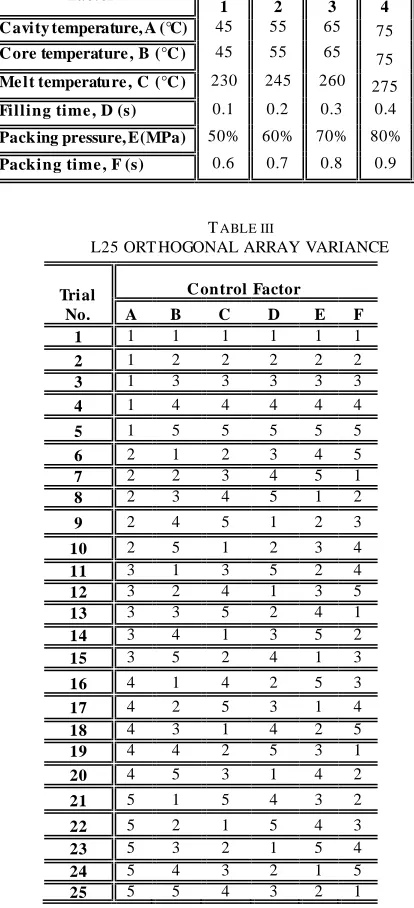
Taguchi method is again applied where there are six factors identified to be controlled; cavity temperature (A), core temperature (B), melt temperature (C), filling time (D), packing pressure (E), and packing time (F). Each factor is downsized to five levels where an orthogonal array of L25 56 is chosen and all parameters have been identified. These orthogonal array variance and parameters control factors are shown in Table II, III and IV respectively.
The length of weld lines data obtained from the simulation process are also analyzed using Analysis of Variance (ANOVA) and the level of confidence is set at 0.05. The results are then taken and compared with the results obtained from the SN ratio method. The interaction effect of factors is identified and the contribution of each factor to wards the total effect is analyzed. The percentage contribution calculated determines which of the factors mainly affect the length of weld lines.
IV. RESULTANDDISCUSSION
Fig. 5 and 6 show the weld line formation resulted from the simulation. The length of weld line is then measured and S/N ratios are calculated. In this case, ‘the smaller the better quality’ equation from Taguchi method is chosen as far as weld line is concerned. The equation of S/N is shown below;
MSD is the mean square deviation and stands for the number of observations where ,is the number of tests in one trial. Table V shows the summary of S/N values for the length of weld lines measured at hole - X and Y in a thin plate obtained from the experiment.
.
Factor Le ve l
1 2 3 4 5
C avity temperature, A (°C) 45 55 65 75 85
C ore temperature , B (°C ) 45 55 65 75 85
Me lt temperature , C (°C ) 230 245 260 275 290
Filling time , D (s) 0.1 0.2 0.3 0.4 0.5
Packing pressure, E (MPa) 50% 60% 70% 80% 90%
Packing time , F (s) 0.6 0.7 0.8 0.9 1.0
Trial No.
C ontrol Factor
A B C D E F
1 1 1 1 1 1 1
2 1 2 2 2 2 2
3 1 3 3 3 3 3
4 1 4 4 4 4 4
5 1 5 5 5 5 5
6 2 1 2 3 4 5
7 2 2 3 4 5 1
8 2 3 4 5 1 2
9 2 4 5 1 2 3
10 2 5 1 2 3 4
11 3 1 3 5 2 4
12 3 2 4 1 3 5
13 3 3 5 2 4 1
14 3 4 1 3 5 2
15 3 5 2 4 1 3
16 4 1 4 2 5 3
17 4 2 5 3 1 4
18 4 3 1 4 2 5
19 4 4 2 5 3 1
20 4 5 3 1 4 2
21 5 1 5 4 3 2
22 5 2 1 5 4 3
23 5 3 2 1 5 4
24 5 4 3 2 1 5
25 5 5 4 3 2 1
Trial No.
C ontrol Factor
A B C D E F
1 45 45 230 0.1 50% 0.6
2 45 55 245 0.2 60% 0.7
3 45 65 260 0.3 70% 0.8
4 45 75 275 0.4 80% 0.9
5 45 85 290 0.5 90% 1.0
6 55 45 245 0.3 80% 1.0
7 55 55 260 0.4 90% 0.6
8 55 65 275 0.5 50% 0.7
9 55 75 290 0.1 60% 0.8
10 55 85 230 0.2 70% 0.9
11 65 45 260 0.5 60% 0.9
12 65 55 275 0.1 70% 1.0
13 65 65 290 0.2 80% 0.6
14 65 75 230 0.3 90% 0.7
15 65 85 245 0.4 50% 0.8
16 75 45 260 0.2 90% 0.8
17 75 55 275 0.3 50% 0.9
18 75 65 230 0.4 60% 1.0
19 75 75 245 0.5 70% 0.6
20 75 85 260 0.1 80% 0.7
21 85 45 290 0.4 70% 0.7
22 85 55 230 0.5 80% 0.8
23 85 65 245 0.1 90% 0.9
24 85 75 260 0.2 50% 1.0
25 85 85 275 0.3 60% 0.6
TABLE II
T HE FIVE LEVEL OF EFFECT IVE FACT OR FOR EXPERIMENT VARIANCE
TABLE III
L25 ORT HOGONAL ARRAY VARIANCE
TABLE IV
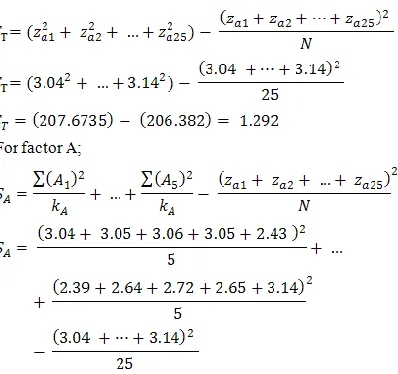
The data in Table V also analyzed using Analysis of Variance (ANOVA) where the relative percentage contribution of all factors is determined by comparing the
relative variance. The ANOVA then computes the degrees of freedom, variance, F-ratio, sums of squares, pure sum of square and percentage contribution. The examples of calculations are shown below and the results of S/N ratio for length of weld line in thin plate are listed in Table 6. Only weld line at hole X is considered because length of weld line formation at both of holes that shows the similar pattern under different parameter settings.
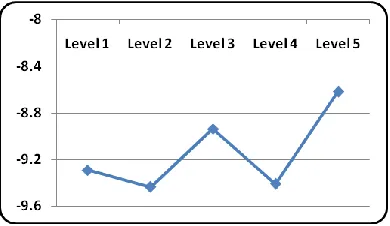
Fig. 7 – 12 show S/N response diagrams constructed for lengths of weld lines in a thin plate based on data acquired from Table 6.
No. C ontrol Factor
Le ngth of We ld Line
S/N For X
A B C D E F X Y
1 45 45 230 0.1 50% 0.6 3.04 2.25 -9.6575
2 45 55 245 0.2 60% 0.7 3.05 2.36 -9.6860
3 45 65 260 0.3 70% 0.8 3.06 2.48 -9.7144
4 45 75 275 0.4 80% 0.9 3.05 2.70 -9.6860
5 45 85 290 0.5 90% 1.0 2.43 2.66 -7.7121
6 55 45 245 0.3 80% 1.0 3.08 2.51 -9.7710
7 55 55 260 0.4 90% 0.6 3.04 2.61 -9.6575
8 55 65 275 0.5 50% 0.7 3.05 2.46 -9.6860
9 55 75 290 0.1 60% 0.8 3.01 2.54 -9.5713
10 55 85 230 0.2 70% 0.9 2.66 1.90 -8.4976
11 65 45 260 0.5 60% 0.9 2.85 2.56 -9.0969
12 65 55 275 0.1 70% 1.0 2.72 2.34 -8.6914
13 65 65 290 0.2 80% 0.6 2.70 2.45 -8.6273
14 65 75 230 0.3 90% 0.7 2.76 2.11 -8.8182
15 65 85 245 0.4 50% 0.8 2.97 2.33 -9.4551
16 75 45 275 0.2 90% 0.8 3.07 2.33 -9.7428
17 75 55 290 0.3 50% 0.9 2.60 2.51 -8.2995
18 75 65 230 0.4 60% 1.0 3.26 2.45 -10.2644
19 75 75 245 0.5 70% 0.6 3.05 2.57 -9.6860
20 75 85 260 0.1 80% 0.7 2.84 2.60 -9.0664
21 85 45 290 0.4 70% 0.7 2.39 2.87 -7.5680
22 85 55 230 0.5 80% 0.8 2.64 2.30 -8.4321
23 85 65 245 0.1 90% 0.9 2.72 2.16 -8.6914
24 85 75 260 0.2 50% 1.0 2.65 2.13 -8.4649
25 85 85 275 0.3 60% 0.6 3.14 2.42 -9.9386
Le ve l A B C D E F
1 -9.291 -9.167 -9.134 -9.135 -9.113 -9.513
2 -9.437 -8.953 -9.458 -9.004 -9.711 -9.056
3 -8.938 -9.397 -9.200 -9.308 -8.831 -9.383
4 -9.412 -9.245 -9.549 -9.326 -9.117 -8.854
5 -8.619 -8.934 -8.356 -8.922 -8.924 -8.981
0.818 0.463 1.193 0.404 0.880 0.659 TABLE V
SUMMARY OF T HE RESULT S LENGT H OF WELD LINE IN T HIN PLAT E
Fig. 7. S/N response for cavity temperature Fig. 5. Weld line formation from filling
analysis
Fig. 6. Length of weld line X mm Weld line formation
Hole - X
Hole - Y
TABLE VI
-9.6 -9.2 -8.8 -8.4
Level 1 Level 2 Level 3 Level 4 Level 5
From the S/N ratio response in Table VI, the highest value from each factor is considered the best and chosen as the finest grouping of parameters. Table VII shows the summary of best parameter settings for the thin plate. The results can also be seen from S/N response diagram shown in Fig. 5–10.
Furthermore the difference between levels in Table VI also shows which factor is more significant that give effects on length of weld line in thin plate. Therefore, it is understood that the most major factor that affects on length of weld line in thin plate is melting temperature (C) and followed by packing pressure (E), cavity temperature (A), packing time (F), core temperature (B) and filling time (D).
The data in Table V is also analyzed using Analysis of Variance (ANOVA) that computes the sums of squares, degrees of freedom, variance and percentage contribution. The examples of calculations for these quantities are shown below and the results lengths of weld line in thin plate are summarized in Table VIII.
Factor Parameters
C avity te mpe rature , (°C ) 85
C ore te mpe rature , (°C ) 85
Me lt te mpe rature , (°C ) 290
Filling time , (s) 0.5
Packing pre ssure , (MPa) 70%
Packing time , (s) 0.9
TABLE VII
BEST SET T ING OF COMBINATION PARAMETERS
Fig. 8. S/N response for core temperature
Fig. 11. S/N response for packing pressure Fig. 10. S/N response for filling time Fig. 9. S/N response for melt temperature
The percentage of contribution for each factor is listed at the last column in Table VIII. It can be observed that for length of weld line in thin plate, melt temperature contributes the most which is 34.52% followed by cavity temperature 20.36%, packing pressure 19.43%, packing time 13.54%, core temperature 6.42% and filling time 5.73%. This proves that melt temperature, cavity temperature, packing pressure, packing time are all significant factors where core temperature and filling time do not have major effects that lead to the formation of weld line formed on a thin plate.
V. CONCLUSION
There are several factors such as feed systems, cooling channel positions, gate sizes that need to be determined first in order to design a plastic injection mold. This study has proven that these factors have significant effects on the quality of parts produced and simulation software can help us reducing time taken to test. Melt temperature is the most significant factors which is 34.52% followed accordingly by cavity temperature 20.36%, packing pressure 19.43%, packing time 13.54%, core temperature 6.43% and filling time 5.73%.
Therefore, it is understood that these factors are significant whereas core temperature and filling time is insignificant.
REFERENCES
[1] J. Shoemaker, Moldflow Design Guide. Carl Hanser Verlag, Munich, 2006.
[2] R.A. Malloy, Plastic Part Design for Injection Molding. Hanser Publishers, 1994.
[3] S.-C. Chen, W.-R. Jong, J.-A. Chang, Dynamic mold surface
temperature control using induction heating and its effects on the surface appearance of weld line. J. Appl. Polym. Sci. 101 (2006) 1174. [4] H. Zhou, D. Li, Computer evaluation of weld lines in injectionmolded
parts. J. Reinf. Plast. Comp. 24 (2005) 315.
[5] M. Zhai, Y. Lam, C. Au, Runner sizing and weld line positioning for plastics injection molding with multiple gates. Eng. Comput. 21 (2006) 218.
[6] K. Mezghani In: The 6th Saudi Engineering Conference, Dharan, 2002, pp. 335–347.
[7] H. Zhou, D. Li, Modelling and prediction of weld line location and properties based on injection moulding simulation. Int. J. Mater. Prod. T echnol. 21 (2004) 526.
[8] M.-Y. Chen, H.-W. Tzeng, Y.-C. Cheng, S.-C. Chen, T he application of fuzzy theory for the control of weld line positions in injectionmolded part. ISA T 47 (2008) 119.
[9] D.H. Chun, Cavity filling analyses of injection molding simulation: bubble and weld line formation. J. Mater. Process. Tech. 89-90 (1999) 177.
[10] Z. Shayfull, M.F. Ghazali, M. Azaman, S.M. Nasir, N.A. Faris, Effect of Differences Core and Cavity T emperature on Injection Molded Part and Reducing the Warpage by Taguchi Method, International Journal of Engineering & Technology, Vol: 10, 2010, pp. 133-140.
Source f S V F P (%)
C avity
te mperature,(°C) 4 0.263 0.0658 - 20.36
C ore
te mperature, (°C) 4 0.083 0.0208 - 6.42
Me lt
te mperature, (°C) 4 0.446 0.1114 - 34.52
Filling time, (s) 4 0.074 0.0185 - 5.73
Packing
pre ssure, (MPa) 4 0.251 0.0627 - 19.43
Packing time, (s) 4 0.175 0.0438 - 13.54
Pooled error 0 0 100
Total 24 1.292
TABLE VIII