Page 52 www.ijiras.com | Email: [email protected]
Regional Variation In Public Provision Of Elementary Education
In Odisha With A Special Reference To Wodc Region: An Analysis
Through Some Basic Indicators
Braja Bihari Panda
Research Scholar, Department of Economics, Sambalpur University, Odisha, India
Muralidhar Majhi
Assistant Professor, G. M. University, Sambalpur, Odisha, India
I. INTRODUCTION
Education and basic health care are the main component of Human Development and Human Development has similar importance in economic growth. Growth or development has no meaning if it not accompanied by reasonable human development. The role of education in (Schultz 1961) and human development (Sen 1985, 1993) in their study of growth has been given due importance. Status and spatial distribution of such sector is needed to be analysed in a backward state of Odisha. The overall literacy rate according to is 73.5%, which is marginally behind of the national average of 74.04%. but the disparity in provision of across the state is disturbing. It may be a proud thing that Bhubaneswar is emerging as a knowledge hub in India with several new public and private universities, including the establishment of an Indian Institute of Technology after five decades of demand but this exposed the severity of regional disparity in spatial distribution of public provision of educational center across the state along with provision of land at subsidised rate or free of cost to private player for establishment of the centre of learning.
Education particularly elementary education has considerable impact on development and distribution of fruits of development. This implies for development of backward region development of elementary education is a must. However, in this study we focus our study about basic education (primary and secondary) provision by the public authority.
Though there are study about intra state disparity in Odisha but very few study covers education as prime focus and none of the study covers to WODC region. Debi (1996) examine some aspect of elementary education and found that inter district variation in literacy rate. She utilized data up to 1991 and compared three time periods 1971, 1981, 1991 and taken literacy as only indicator. Similarly Das et al (2012) studied the disparity of education in Odisha with reference to KBK and Non KBK district analysed through a number index and found that there exist disparity in education between KBK and Non KBK district and suggest opening of more school in remote areas.
The paper tries to access some aspects of variation elementary education in with special reference to WODC Abstract: This paper examines regional disparities in public (Govt.) provision in the enabling the people of backward region through elementary education with special reference to WODC region by using secondary data collect Government publication. The study analyses using simple graphical representation of key indicator also finding a composite index for overall comparison of the status using Sudarshan Iyengar method and beta distribution for objective categorization of districts. The findings clearly show that there exist acute disparity in education between WODC and Non WODC region besides which there are certain more black spot. It require serious reorientation of government policy for provision regarding human resource infrastructure especially education. Public private partnership should be pursued in a mission mode for attainment universal elementary education as it has been successfully applied in polio eradication.
Page 53 www.ijiras.com | Email: [email protected] district. In a view to remove backwardness of certain western
district of Odisha WODC –Western Odisha Development council was constituted in 2000. Elementary education being one of the starting stepping stone in the path of development the study focus on public provision of elementary education skewed distribution of educational infrastructure will not certainly help to achieve the desired growth of WODC region. An attempt has been made to estimate the district wise inequality in provision of education. Number of School per unit area, number of teacher posted per unit of population and unit area, Govt provision of school, teacher pupil ratio, Junior college and Degree college alongwith Literacy rate are taken as indicators.
The paper contains five sections, the current section introduces where as the next section deals with a brief methodology for analysing the data. The third section has discussed the status of primary education in the state through the indicators. The fourth section examines the regional variation in education in the state through composite index and beta distribution. The last section deals with concluding observations with some policy suggestions.
I. METHODOLOGY
The analysis is based on secondary data collected from Economic Survey of Odisha, Statistical Abstract, Odisha Primary Education Programme Authority (OPEPA), District at a Glance, Government of Odisha, etc.
The analysis of the study concentrates to the public provision for elementary education along with other educational indicators
It uses Sudarshar Iyerngar methodology for finding composite index for finding level of development in the status of elementary education .A composite index is required for required for overall comparison and the value of indicators are in different unit hence a normalized variable is calculated by
Let Xij represent the size or value of the i’th educational development indicator in the j’th district
i= 1,2,3,………..,,m and j = 1,2,, …………n Yij =
Where Min Xij and Max Xij are respective maximum and minimum of (Xi1, Xi2, Xi3 ………. Xin) ,
Yij is the standard variable which will have no unit and is
appropriate to combine to get composite index.
Thereafter Yj = W1Y1j+ W2Y2j + W3Y3j +………+
WmYmj
Yj will be the overall district index assume that the weight
vary inversely as the variation in the respective indicators of educational development or more speicifically
Where as
Simple ranking of the district indices can be used for assessing the development status but for more specific classification of different stages of development four fractile classification of Yj .Yj has assumed to be Beta distribution in
the range (0,1). The Beta distribution is generally skewed and relevant to characterise positively valued random variable.
where 0<z<1 and a, b>0
Where β(a,b) = dz
The parameter (a,b) in the assumed Beta distribution can be estimated by solving following equation:
(1-Ȳ)a – Ȳ b=0 (Ȳ -m2) a-m2b=m2- Ȳ
Ȳ is the overall mean of district indices and m2 is given
by m2=Sy2+Ȳ2
where Sy2 is the variance of district indices.
The following indicators are taken into consideration for our study of status of education in inter district comparision Number of Primary School per hundred sq Km (X1j)
Number of Secondary School per Hundred sq. Km (X2j)
Teacher Pupil ratio (X3j)
Number of Govt. School per hundred sq Km (X4j)
Number of Primary School per Hundred sq. Km ((X5j)
Number of Secondary School per ten thousand population (X6j)
Numbr of Junior College per thousand sq Km (X7j)
Number of Degree College per thousand Km (X8j)
Literacy rate. (X9j)
Key Educational Indicators
Pry Sch per hundred sq km Sec Sch per Hundred sq KM Teacher. Pupil Ratio Govt School per '00 Sq km Pr Sch tr '00 Sq km Sec Teacher per Th pop. Jr Coll Deg Coll L iter a cy
2014-15 2014-15 2014-15
2014-15 2010-11 2011-12 2016-17 2016-17 2 011
1 2 3 4 5 6 7 8 9
1 Angul 25.8 4.41 0.044 23.55 75.06 15.49 6.75 4
7 7.5
2 Balasore 74.3 14.79 0.035 62.38 166.34 17.91 26.5 13
7 9.8
3 Baragarh 30.8 5.86 0.039 28.30 71.83 14.99 10.3 6
7 4.6
4 Bhadrak 76.1 13.97 0.036 67.50 196.61 18.89 18.8 12
8 2.8
5 Bolangir 34.8 5.51 0.032 33.35 82.14 13.28 10.8 5
6 4.7
6 Boudh 27.0 2.55 0.046 25.95 53.03 10.95 5.81 2
7 1.6
7 Cuttack 65.8 14.09 0.044 54.88 181.08 18.84 27 15
8 5.5
8 Deogarh 21.4 2.93 0.060 19.76 53.40 16.67 4.08 3
7 2.6
9 Dhenkanal 35.9 6.20 0.043 31.87 90.68 15.33 11.5 7
7 8.8
10 Ganjam 46.1 7.88 0.037 41.20 109.25 11.77 14.5 7
7 1.1
11 Gajapati 32.2 3.82 0.048 31.08 65.62 8.17 4.86 2
5 3.5
12 Jajpur 81.6 10.83 0.036 69.20 194.07 17.75 24.8 15
8 0.1
13 Jagatshingpur 97.2 28.48 0.054 81.77 222.00 18.48 20.4 11
8 6.6
14 Jharsuguda 35.4 6.58 0.053 31.88 84.72 12.29 9.93 5
7 8.9
15 Kalahandi 30.7 4.26 0.030 28.99 73.04 13.54 7.32 4
5 9.2
16 Kendrapara 76.8 14.18 0.038 66.41 168.23 16.82 20.8 12
8 5.2
17 Keonjhar 34.0 6.12 0.037 30.69 70.00 19.34 6.5 4
6 8.2
18 Koraput 28.0 3.33 0.035 27.16 62.20 10.56 3.86 2
4 9.2
19 Kondhamal 24.6 2.48 0.048 23.97 48.40 15.40 2.87 2
6 4.1
20 Khurda 66.8 13.51 0.035 51.55 183.33 13.23 46.2 21
8 6.9
21 Mayurbhanj 42.0 5.89 0.037 39.23 76.91 16.91 9.12 5
6 3.2
22 Malkangiri 22.4 2.12 0.037 21.90 44.02 5.45 3.11 2
4 8.5
23 Nayagarh 31.7 6.35 0.045 28.61 82.54 16.94 10.5 7
8 0.4
24 Nuapara 27.9 3.89 0.039 26.25 70.09 15.19 5.71 3
5 7.3
25 Nawarangpur 34.8 3.97 0.032 33.91 74.30 5.49 4.91 2
4 6.4
26 Puri 62.8 10.75 0.047 54.61 156.51 15.77 17.8 13
8 4.7
27 Rayagada 30.4 3.01 0.038 29.51 65.66 12.95 4.38 2
4 9.8
28 Sambalpur 22.5 3.55 0.053 20.62 51.04 12.73 7.7 3
7 6.2
29 Sonepur 42.4 5.99 0.050 39.41 82.63 13.19 15.4 8
7 4.4
30 Sundargarh 28.5 4.74 0.043 24.72 73.24 16.56 7.93 4
7 3.3
MAX 97.24 28.48 0.06 81.77 222.00 19.34 46.21 21.33
8 6.90
MIN 21.39 2.12 0.03 19.76 44.02 5.45 2.87 1.51
Page 54 www.ijiras.com | Email: [email protected]
STDEV(Xi:Xn) 21.19 5.63 0.01 16.96 53.29 3.64 9.60 5.12
1 2.50
Source: Statistical Abstract of Odisha 2012 Table 1
Various District at a Glance.DES Odisha
Status of Elementary Education and Secondary Education, 2014, OPEPA
The variation in allocation of importance to education is clearly visible from the above data and it will be lucidly palatable for common reader through graphical representation of the key indicators.
Source: District at a glance, DES Odisha.
Graph 1: Primary School per hundred Sq. Km The districts around the Bhubaneswar and Cuttack are at a considerable higher position where as the district of the rest of Odisha are with poor provision. Surprisingly twenty two district could not provide 50 primary school in hundred sq km. Some district like Deogarh Malkangiri, Sambalpur and Kondhamal could not provide 25 primary school per hundred sq km. where as some coastal district have more than 75 school per hundred sq km It shows there exist severe disparity in provision of primary school across the district.
Source: District at a Glance, DES Odisha.
Figure 2: Secondary School per hundred Sq. km Here also we find in the coastal district of Jagatsinghpur, Balasore, Kendrapara, Cuttack, Bhadrak, Puri and Khorda provision of Secondary School by Government including private player is handsome but the district of WODC region and KBK region the situation of government provision is precarious as major share is provided by Government.
Source: Status of Elementary and Secondary Education, Odisha, 2014-15
Figure 3: No. of Govt. School (SM&E, Tr W, Local bodies) The district of Jagatsingpur, Jajpur, Bhadrak, Kendrapara, Balasore, Cuttack, Khorda and Puri have taken a lion share in the govt provision of primary School all other districts are ignored while providing primary education by the Government bodies where as the position of Deogarh, Sambalpur, Malkangiri are at worst.
Source: Status of Elementary and Secondary Education, Odisha, 2014-15
Figure 4: Teacher Pupil Ratio
When Pupil Teacher ratio is taken in consideration the disparity is not region specific not only that disparity is not visible and higher the value lower is the status. Hence, it was converted into teacher pupil ratio. However, Deogarh leading the tally is dubious and previous Figure shows Deogarh has least number of school per hundred sq. KM might be one of the reason. But Kalahandi with comparative less number of school and again trailing the tally of Teacher Pupil ratio Jagatsinghpur with most number of school per hundred sq KM stand second in the Teacher Pupil ration shows severity of disparity in Government provision.
Source: Statistical Abstract of Odisha 2012
Figure 5: Number of Primary School Teacher per thousand Population (2010-11)
Page 55 www.ijiras.com | Email: [email protected] Figure 6: Number of Secondary Teacher per ten thousand
population
The position of Number of teacher per ten thousand population is taken as next indicators and ten thousand population is about a population of a panchayat. The costal district again leads the tally. However, Mayurbhanj and Deogarh are surprising entry in the better group and as common feature of disparity district of WODC region and Southern region are with poor provision of the Government in respect of Secondary teacher and Khurda is at 19th position is surprising however dominance of private education may be compensating Khurda.
Source: District At a Glance, 2018, DES, Odisha
Figure 7: Number of Junior College and Degree College per Thousand Sq KM
Though junior and degree college education has little importance in elementary education but presence less number of teachers in backward areas is the worry factor. The reason might be less number of deployment or deployed staff take transfer route to move to developed place. This can be checked by localized selection of which need development of and junior and degree education that will create a workforce for localized employment of teacher. Here also severe disparity is found.
Last but not the least is the indicators of Literacy which is also a cause but more an effect of Government provision.
Source: Census India/District Statistical Abstract 2012 Figure 8
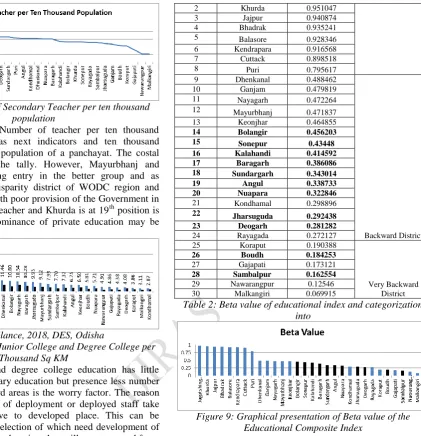
The indicators are converted into standardized variable and composite index is calculated. For objective calculation a beta value of distribution has been devised as follows.
Rank
District Beta Value
1 Jagatshingpur 0.973022 Developed district
2 Khurda 0.951047 3 Jajpur 0.940874 4 Bhadrak 0.935241 5 Balasore 0.928346 6 Kendrapara 0.916568 7 Cuttack 0.898518 8 Puri 0.795617 9 Dhenkanal 0.488462
Backward District 10 Ganjam 0.479819
11 Nayagarh 0.472264 12 Mayurbhanj 0.471837 13 Keonjhar 0.464855
14 Bolangir 0.456203
15 Sonepur 0.43448
16 Kalahandi 0.414592
17 Baragarh 0.386086
18 Sundargarh 0.343014
19 Angul 0.338733
20 Nuapara 0.322846
21 Kondhamal 0.298896
22 Jharsuguda 0.292438
23 Deogarh 0.281282
24 Rayagada 0.272127 25 Koraput 0.190388
Very Backward District
26 Boudh 0.184253
27 Gajapati 0.173121
28 Sambalpur 0.162554
29 Nawarangpur 0.12546 30 Malkangiri 0.069915
Table 2: Beta value of educational index and categorization into
Figure 9: Graphical presentation of Beta value of the Educational Composite Index
II. CONCLUSION AND SUGGESTION
Page 56 www.ijiras.com | Email: [email protected] Any layman can also see the level of variation in
status/provision of education and more particularly elementary education even looking at the ranks of the districts in provision for education through key indicators. The analysis of indicators shows the steps to be taken as it display the problem area and the government may focus specially to improve the situation. The educationally backward and very backward district may be given intensive care by way of correcting the provision of each and every indicator. Public private partnership should be pursued in a mission mode for attainment universal elementary education as it has been successful in polio eradication. Further works can be explored in the area of rural urban disparity in provision of education.
REFERENCES
[1] Das and Sahoo (2012), “Regional Disparity in Education,: A Comparative Study Between KBK and Non KBK
District of Odisha”, International Journal of Educational Science and Research, Vol.2, Issue 2 pp 1-15
[2] Debi (1996)“ Regional Disparity in Education in Orissa”, Indian journal of Regional Science, Vol. 28, No. 2 [3] Iyengar, N. S. and Sudarshan, P. [1982] “A method of
classifying Regions from Multivariate Data”, Economic and Political weekly, Special Article: 2047-52.
[4] Schultz, T.W. (1961) “Investment in Human Capital”. The American Economic Review,51,(1) pp 1-17
[5] Sen,A (1985). “Commodities and Capabilities”. Amsterdam: North Holland
[6] Sen, A.(1999). “Development as Freedom”. New York. [7] Government of Odisha Publication
[8] “Statistical Abstract of Odisha.2012”, Department of Economics and Statistics
[9] “District at a Glance 2015 & 2018”, Department of Economics and Statistics, Planning and Coordination Department, Government of Odisha.