SLA-AWARE SCHEDULING OF VMs FOR LOAD BALANCING IN
CLOUD USING A THREE PHASE OPTIMAL VM MIGRATION
TECHNIQUE
Yadaiah Balagoni1, Dr. R.Rajeswara Rao2
1. INTRODUCTION
Scheduling of Virtual machines for load balancing of cloud data center nodes is, a generic framework based process where the generated workloads are distributed over multiple data center resources.The load balancing techniques brings the advantage of lower response time and better resource utilization [1]. The cloud data center based load balancing is distinguished from the domain name service based load balancing. The domain name service load balancers deploys the hardware and software components to balance load for the hardware resources, whereas the cloud based load balancing techniques deploys the software algorithms or protocols to distribute the load over multiple data center nodes. Also it is to be understood that, the cloud based load balancing techniques allows the customers to use the global or geodetically distributed services based on geodetically distributed servers. Multiple parallel researches have been carried out to demonstrate the benefits of load balancing on cloud based data centers. Making the application scalable based on demand without degrading the performance, increases the reliability at the cost of VM migration. However the recent researches constraint to achieve the optimal SLA violation during VM Migration. Thus this work demonstrates A Service Level Agreement Effective Optimal Virtual Machine Migration Technique for Load Balancing on Cloud Data Centers.
2. VIRTUALIZATION BENEFITS FOR CLOUD DATA CENTERS
This work highlights the benefits of virtual machine migration and also evaluates the parameters influencing the performance and productivity [2] [3].
2.1. Open Access Control
The Virtual Machines come with a reduced abstraction in the system level and allows the provider, customer and researchers to access more properties of the system. The access to computing environment data, system level codes, hardware utilization statistics, traces of the active application, failing and down timing component configurations and the guest operating system configuration parameters and the ability to control them independently helps to understand the performance perimeters [Table -1].
Table 1.Parameters for Open Access Control
Parameter Type Parameter Name
Access Permissions
Traditional Virtual Machine
Migration
Processing CPU Type Not Allowed Allowed
Allocation Allowed Allowed
Priority Allowed Allowed
1 Assistant Professor, Department of CSE, Mahatma Gandhi Institute of Technology, Hyderabad. 2 Professor, Department of CSE, University College of Engineering, Vizianagaram.
Abstract: SLA-Aware Scheduling of virtual machines instances on cloud datacenters for load balancing is one of the challenging issues. One of the useful feature provided by virtualization technology is, migration of virtual machine (VMs) instances from one node to another in the data center. Hence our work addresses the challenge of improving SLAs while not degrading the other performance measures. Our approach uses a three phase framework for selecting, allocating and validating the allocation cost with optimal costs. The major achievement of this work is to minimize the SLA violations compared to existing virtual machine migration techniques for load balancing. Moreover the work is not limited to any specific virtual machine image formats rather gives the best performance over all image formats to make the proposed technique VM format independent. With the extensive experimental setup the work furnishes the comparative analysis of simulations for popular existing techniques and the proposed framework.
Keywords- Cloud-Computing, SLA, Virtual Machine Migration, Load Balancing, VM Image formats.
Memory Size Allowed Allowed
Buffer Not Allowed Allowed
Storage Access IDE Bus Not Allowed, Physical Allowed, Logical
Capture Mode Not Allowed Allowed
Library Group Allowed, Physical Allowed, Logical
Network IP Address Allowed Allowed
MAC Address Not Allowed Allowed
Internal Network Partially Allowed Allowed
2.2. Optimal Hardware Control
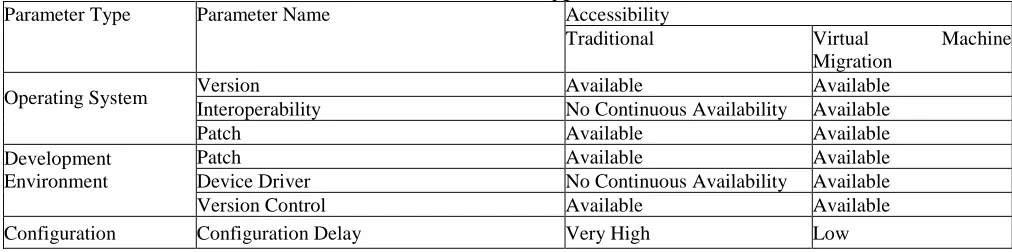
Virtual Machines come with a flexibility to change or alter the operating system and hardware components seamlessly. After the initial cost for setting up a virtual environment, the users are free to modify the computing system including the operating system, libraries, tools and other supporting patches without investing the full time needed for computing system change or upgrade [Table -2].
Table 2.Reduced Hardware Upgrade Constraints
Parameter Type Parameter Name Accessibility
Traditional Virtual Machine
Migration
Operating System Version Available Available
Interoperability No Continuous Availability Available
Patch Available Available
Development Environment
Patch Available Available
Device Driver No Continuous Availability Available
Version Control Available Available
Configuration Configuration Delay Very High Low
2.3. Optimal Replication Control
The replication of the Virtual Machines using the snapshot feature allows the users to take timely and on demand backups of the virtual machine images. Thus the backups help to quickly reproduce the same computing environment without investing the complete setup time [Table -3].
Table 3.Reduced Replication Duration
Parameter Type Replication Time
Traditional Virtual Machine Migration
Windows Server 50 to 90 Mins Just in Time
MAC Servers 40 to 60 Mins Just in Time
Linux Servers 30 to 40 Mins Just in Time
2.4. Service Provider Support for Virtual Machine Migration
The Virtual Machines are hosted by all service providers with similar configurations but with added advantages. Hence adopting to Virtual Machine computing is the best choice to avoid the lack of support and facility availability [Table – 4].
Table 4.Service Provider Support for Migration Server Type Amazon Cloud Microsoft Azure
Cloud
Google App
Engine Cloud
IBM Bluemix Cloud Private Hosted Cloud
Windows Server YES YES YES YES NO
MAC Servers YES YES YES YES NO
Linux Servers YES YES YES YES NO
2.5. Optimal Manageability of Updates
2.6. Optimal Migration Cost Control
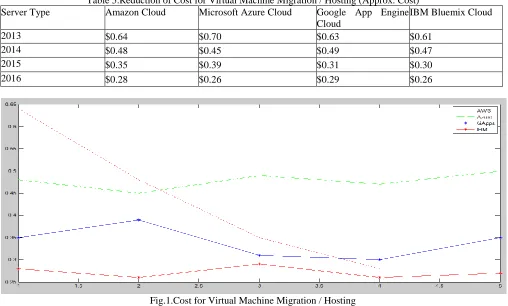
Due to the tremendous competition in the cloud service provider space, the drop of price for each virtualization component used in the virtual machine configuration is dropping with an increasing speed. Hence rather than up-gradation cost for traditional systems, the cloud based virtual machines are very much cost effective [Table-5].And the Cost Compatibility is projected in Fig-1.
Table 5.Reduction of Cost for Virtual Machine Migration / Hosting (Approx. Cost)
Server Type Amazon Cloud Microsoft Azure Cloud Google App Engine
Cloud
IBM Bluemix Cloud
2013 $0.64 $0.70 $0.63 $0.61
2014 $0.48 $0.45 $0.49 $0.47
2015 $0.35 $0.39 $0.31 $0.30
2016 $0.28 $0.26 $0.29 $0.26
Fig.1.Cost for Virtual Machine Migration / Hosting
Henceforth it is been demonstrated that the virtual machine migration and hosting are been advocated by all major service providers.
3. PROPOSED OPTIMAL MIGRATION FRAMEWORK
This work deploys a cost evaluation function to determine the most suitable virtual machine to be migrated considering the least SLA violation. The framework for optimal migration is presented here[Figure - 2]
.
Fig.2.Optimal Framework Virtual Machine Migration
3.1Virtual Machine Identification
The first phase of the algorithm analyses the highest loaded node and migrates the virtual machine to the available less loaded node. After identifying the source and destination, the algorithm identifies the virtual machine to be migrated. The outcome of this algorithm is to obtain optimal load balanced condition for the data center after virtual machine migration. The detail of the algorithm is explained here:
Step-1.1. Calculate the load on each node in the data center
1
( )
nCPUCapacity CPUCapacity i
Phy
VM i
(1)1
( )
nMemoryCapacity MemoryCapacity i
Phy
VM i
(2)1
( )
nIOCapacity IOCapacity i
Phy
VM i
(3)1
( )
nNetworkCapacity NetworkCapacity i
Phy
VM i
(4)(
Phy
CPUCapacityPhy
MemoryCapacityPhy
IOCapacityPhy
NetworkCapacity)
(5)Step-1.2.In the second step, the algorithm identifies the highest and lowest loaded node in the data center
,
,
i j MAX i
MAX
j i MAX j
If
then
Else
then
(6),
,
i j MIN i
MIN
j i MIN j
If
then
Else
then
(7)Step-1.3. Once the source and destination is identified as MAX and MIN respectively, the identification of virtual machine to be migrated is carried out. During the identification, the optimal load balanced condition is identified.
( )
( )
( )
( )
( )
CPUCapacity MemoryCapacity IOCapacity NetworkCapacityVM i
VM i
VM i
VM i
VM i
(8)
( )
MAX
VM i
Source
(9)( )
MIN
VM i
Destination
(10)Step-1.4.After the calculation of the new load, the source and destination nodes must obtain the optimal load condition, where the loads are nearly equally balanced.
,
( )
( )
Source Destination
If
Then Migrate VM i
Else i
n
(11)Where n is total number of virtual machines in Source node.
3.2 Virtual Machine Allocation
During the second phase of the algorithm, this work analyses the time requited for VM allocation for the selected virtual machine with other parameters like Energy consumption, Number of host shutdowns, Execution time - VM selection time, Execution time - host selection time and Execution time - VM reallocation time.These parameters will help in generating the cost function
Step-2.1. Calculate the Energy consumption at the source before migration:
1
(
)
t
Source CPU NETWORK IO MEMORY i i
(12)1
(
)
t
Destination CPU NETWORK IO MEMORY i i
(13)Step-2.3. Calculate the difference in Energy consumption during migration:
Diff Source Destination
(14)Step-2.4. Calculate the Number of host shutdowns, Execution time - VM selection time, Execution time - host selection time and Execution time - VM reallocation time during migration:
Re
Down SelectionTime SelectionTime allocationTime
Host
VM
Host
VM
(15)Henceforth the comparative analysis is been demonstrated in the results and discussion section.
3.3Cost Analysis of Migration
The optimality of the algorithm focuses on the SLA. During the final phase of the algorithm, the migrations is been validated with the help of the cost function to measure the optimality of the cost. The final cost function is described here:
Re
(
)
Diff Down SelectionTime Violation SelectionTime allocationTimeHost
VM
Cost VM
SLA
Host
VM
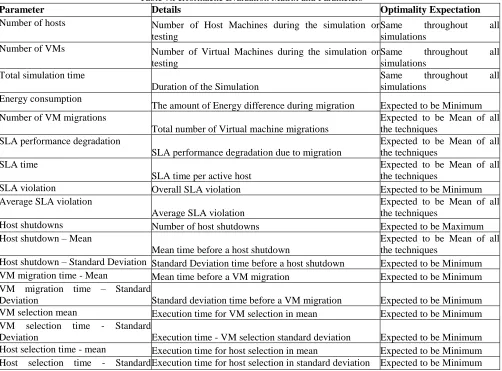
(16)4. PERFORMANCE EVALUATION MATRIX
A novel matrix to evaluate the performance of the proposed migration algorithm is been coined in this work. The parameters names, details of the parameter with the optimality expectation are been proposed here [Table –7]:
Table 7.Performacne Evaluation Matrix and Parameters
Parameter Details Optimality Expectation
Number of hosts Number of Host Machines during the simulation or testing
Same throughout all
simulations Number of VMs Number of Virtual Machines during the simulation or
testing
Same throughout all
simulations Total simulation time
Duration of the Simulation
Same throughout all
simulations Energy consumption
The amount of Energy difference during migration Expected to be Minimum Number of VM migrations
Total number of Virtual machine migrations
Expected to be Mean of all the techniques
SLA performance degradation
SLA performance degradation due to migration
Expected to be Mean of all the techniques
SLA time
SLA time per active host
Expected to be Mean of all the techniques
SLA violation Overall SLA violation Expected to be Minimum
Average SLA violation
Average SLA violation
Expected to be Mean of all the techniques
Host shutdowns Number of host shutdowns Expected to be Maximum
Host shutdown – Mean
Mean time before a host shutdown
Expected to be Mean of all the techniques
Host shutdown – Standard Deviation Standard Deviation time before a host shutdown Expected to be Minimum
VM migration time - Mean Mean time before a VM migration Expected to be Minimum
VM migration time – Standard
Deviation Standard deviation time before a VM migration Expected to be Minimum
VM selection mean Execution time for VM selection in mean Expected to be Minimum
VM selection time - Standard
Deviation Execution time - VM selection standard deviation Expected to be Minimum
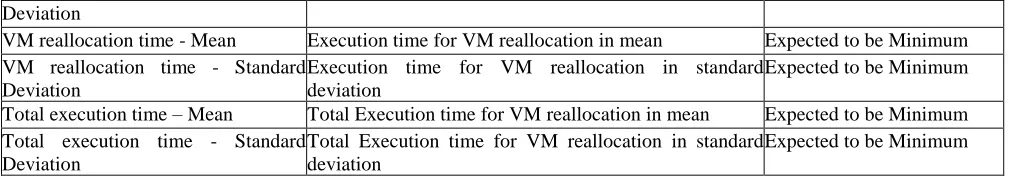
Deviation
VM reallocation time - Mean Execution time for VM reallocation in mean Expected to be Minimum VM reallocation time - Standard
Deviation
Execution time for VM reallocation in standard deviation
Expected to be Minimum
Total execution time – Mean Total Execution time for VM reallocation in mean Expected to be Minimum Total execution time - Standard
Deviation
Total Execution time for VM reallocation in standard deviation
Expected to be Minimum
The analysis of the cost matrix is demonstrated in the results and discussion section of the work.
5. RESULTS AND DISCUSSION
This work has performed extensive testing to demonstrate the improvement over the existing migration techniques [6] [7] [8] [9] [10]. The various considered migration techniques are listed with the used acronyms here [Table – 8]:
Table 8.List of Techniques used for Performance Comparison
Used Name in this Work Selection Policy Allocation Policy
IQR MC Maximum Correlation Inter Quartile Range
IQR MMT Minimum Migration Time Inter Quartile Range
LR MC Random Selection Local Regression
LR MMT Minimum Migration Time Local Regression
LR MU Minimum Utilization Local Regression
LR RS Rom Selection Local Regression
LRR MC Maximum Correlation RobustLocal Regression
LRR MMT Minimum Migration Time RobustLocal Regression
LRR MU Minimum Utilization RobustLocal Regression
LRR RS Rom Selection RobustLocal Regression
MAD MC Maximum Correlation Median Absolute Deviation
MAD MMT Minimum Migration Time Median Absolute Deviation
MAD MU Minimum Utilization Median Absolute Deviation
MAD RS Rom Selection Median Absolute Deviation
THR MC Maximum Correlation Static Threshold
THR MMT Minimum Migration Time Static Threshold
THR MU Minimum Utilization Static Threshold
THR RS Rom Selection Static Threshold
OPT ALGO Proposed Algorithm Part – 1 Proposed Algorithm Part – 2
The simulation of the algorithm is based on CloudSim, which is a framework for modeling and simulation of cloud computing infrastructures and services.The experimental setup used for this work is been explained here [Table – 9]:
Table 9.Experimental Setup
Setup Parameters Number of Physical Hosts Number of Virtual Machines Total Simulation Time(In Sec)
Values 800 1052 86400.00
Firstly this work analyses the energy consumption of the proposed method and compare with the existing policies [Table - 10]:
Table 10.Comparison of Energy Consumption Policies
Energy (kWH)
Change (Increased)
Proposed – Existing Change in %
IQR MC 46.86 2.46 5
IQR MMT 47.85 1.47 3
LR MC 44.35 4.97 11
LR MMT 45.37 3.95 9
LR MU 40.38 8.94 22
LR RS 40.35 8.97 22
LRR MC 40.37 8.95 22
LRR MMT 40.38 8.94 22
LRR RS 40.54 8.78 22
MAD MC 44.99 4.33 10
MAD MMT 45.61 3.71 8
MAD MU 47.36 1.96 4
MAD RS 44.71 4.61 10
THR MC 40.85 8.47 21
THR MMT 41.81 7.51 18
THR MU 44.08 5.24 12
THR RS 41.34 7.98 19
OPT ALGO 49.32 - -
The proposed framework, demonstrates nearly 10% increase compared to the existing policies due to improvement in SLA [Figure –3].
0 10 20 30 40 50 60
IQR MC
IQR MMT
LR MC
LR MMT
LR MU
LR RS LRR MC
LRR MMT
LRR MU
LRR RS
MAD MC
MAD MMT
MAD MU
MAD RS
THR MC
THR MMT
THR MU
THR RS
OPT ALGO
Energy (kWH) IQR MC
IQR MMT
LR MC
LR MMT
LR MU
LR RS LRR MC
LRR MMT
LRR MU
LRR RS
MAD MC
MAD MMT
MAD MU
MAD RS
THR MC
THR MMT
THR MU
THR RS
OPT ALGO
Fig.2.Energy Consumption Comparison
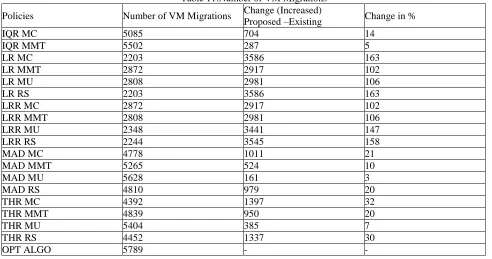
Secondly this work analyses the number of virtual machine migrations during the proposed method and compare with the existing policies [Table - 11]:
Table 11.Number of VM Migrations
Policies Number of VM Migrations Change (Increased)
Proposed –Existing Change in %
IQR MC 5085 704 14
IQR MMT 5502 287 5
LR MC 2203 3586 163
LR MMT 2872 2917 102
LR MU 2808 2981 106
LR RS 2203 3586 163
LRR MC 2872 2917 102
LRR MMT 2808 2981 106
LRR MU 2348 3441 147
LRR RS 2244 3545 158
MAD MC 4778 1011 21
MAD MMT 5265 524 10
MAD MU 5628 161 3
MAD RS 4810 979 20
THR MC 4392 1397 32
THR MMT 4839 950 20
THR MU 5404 385 7
THR RS 4452 1337 30
The proposed framework, demonstrates nearly 50% increase compared to the existing policies due to improvement in SLA [figure – 3].
0 1000 2000 3000 4000 5000 6000 7000
IQR MC
IQR MMT
LR MC
LR MMT
LR MU
LR RS LRR MC
LRR MMT
LRR MU
LRR RS
MAD MC
MAD MMT
MAD MU
MAD RS
THR MC
THR MMT
THR MU
THR RS
OPT ALGO
VM Migrations IQR MC
IQR MMT
LR MC
LR MMT
LR MU
LR RS
LRR MC
LRR MMT
LRR MU
LRR RS MAD MC
MAD MMT
MAD MU
MAD RS
THR MC
THR MMT
THR MU
THR RS
OPT ALGO
Fig.3.Number of VM Migration Comparison
Third, this work analyses the percentage of SLA violation during the proposed method and compare with the existing policies [Table - 12]:
Table 12.SLA Violation Improvement
Policies SLA Violation
(In %)
Change (Decreased)
Existing – Proposed Change in %
IQR MC 1.13% 0.0015 13
IQR MMT 1.05% 0.0007 7
LR MC 3.17% 0.0219 69
LR MMT 3.16% 0.0218 69
LR MU 3.39% 0.0241 71
LR RS 3.17% 0.0219 69
LRR MC 3.16% 0.0218 69
LRR MMT 3.39% 0.0241 71
LRR MU 3.74% 0.0276 74
LRR RS 3.57% 0.0259 73
MAD MC 1.53% 0.0055 36
MAD MMT 1.31% 0.0033 25
MAD MU 1.53% 0.0055 36
MAD RS 1.56% 0.0058 37
THR MC 3.09% 0.0211 68
THR MMT 3.25% 0.0227 70
THR MU 2.73% 0.0175 64
THR RS 3.13% 0.0215 69
OPT ALGO 0.98% - -
0.00% 0.50% 1.00% 1.50% 2.00% 2.50% 3.00% 3.50% 4.00%
IQR MC
IQR MMT
LR MC
LR MMT
LR MU
LR RS LRR MC
LRR MMT
LRR MU
LRR RS
MAD MC
MAD MMT
MAD MU
MAD RS
THR MC
THR MMT
THR MU
THR RS
OPT ALGO
SLA Violation (In %) IQR MC
IQR MMT LR MC LR MMT LR MU LR RS LRR MC LRR MMT LRR MU LRR RS MAD MC MAD MMT MAD MU MAD RS THR MC THR MMT THR MU THR RS OPT ALGO
Fig.4 .SLA Violation Comparison
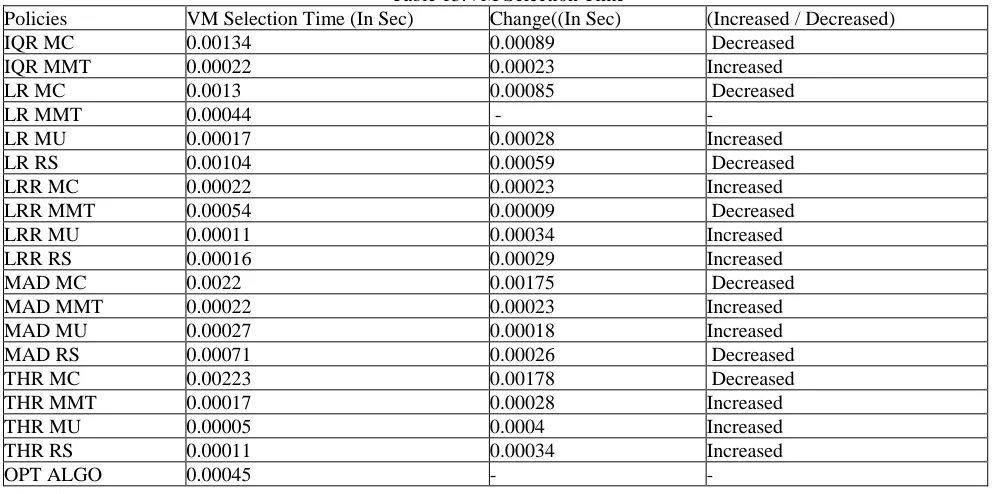
Fourthly this work analyses the VM selection time during the proposed method and compare with the existing policies [Table - 13]:
Table 13.VM Selection Time
Policies VM Selection Time (In Sec) Change((In Sec) (Increased / Decreased)
IQR MC 0.00134 0.00089 Decreased
IQR MMT 0.00022 0.00023 Increased
LR MC 0.0013 0.00085 Decreased
LR MMT 0.00044 - -
LR MU 0.00017 0.00028 Increased
LR RS 0.00104 0.00059 Decreased
LRR MC 0.00022 0.00023 Increased
LRR MMT 0.00054 0.00009 Decreased
LRR MU 0.00011 0.00034 Increased
LRR RS 0.00016 0.00029 Increased
MAD MC 0.0022 0.00175 Decreased
MAD MMT 0.00022 0.00023 Increased
MAD MU 0.00027 0.00018 Increased
MAD RS 0.00071 0.00026 Decreased
THR MC 0.00223 0.00178 Decreased
THR MMT 0.00017 0.00028 Increased
THR MU 0.00005 0.0004 Increased
THR RS 0.00011 0.00034 Increased
OPT ALGO 0.00045 - -
0 0.0005 0.001 0.0015 0.002 0.0025
VM Selection Time (In Sec) IQR MC
IQR MMT LR MC LR MMT LR MU LR RS LRR MC LRR MMT LRR MU LRR RS MAD MC MAD MMT MAD MU MAD RS THR MC THR MMT THR MU THR RS OPT ALGO
Fig.5 .VM Selection Time Comparison
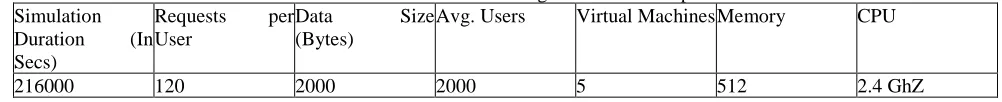
Finally, the proposed technique is been tested for the load balancing with the below furnished simulation setup [Table – 14].
Table 14.Load Balancing Simulation Setup Simulation
Duration (In Secs)
Requests per User
Data Size
(Bytes)
Avg. Users Virtual Machines Memory CPU
216000 120 2000 2000 5 512 2.4 GhZ
The CPU utilization achieved during the simulation is furnished below [Table – 15] and 100% of the CPU utilization is been achieved during load balancing.
Table 15.Load Balancing Simulation
Cloudlet ID STATUS Data center ID VM
ID
Start Time
Finish
Time Time Utilization
1 SUCCESS 1 0 0 800 800 100%
2 SUCCESS 2 0 0 800 800 100%
3 SUCCESS 3 0 0 800 800 100%
9 SUCCESS 1 0 800 1601 801 100%
10 SUCCESS 2 0 800 1601 801 100%
11 SUCCESS 3 0 800 1601 801 100%
25 SUCCESS 1 0 1601 2402 801 100%
28 SUCCESS 2 0 1601 2402 801 100%
31 SUCCESS 3 0 1601 2402 801 100%
37 SUCCESS 1 0 2402 3203 801 100%
40 SUCCESS 2 0 2402 3203 801 100%
43 SUCCESS 3 0 2402 3203 801 100%
26 SUCCESS 1 3 2405 3208 803 100%
29 SUCCESS 2 3 2405 3208 803 100%
32 SUCCESS 3 3 2405 3208 803 100%
35 SUCCESS 1 3 2405 3208 803 100%
49 SUCCESS 2 0 3203 4004 801 100%
52 SUCCESS 3 0 3203 4004 801 100%
55 SUCCESS 1 0 3203 4004 801 100%
293 SUCCESS 2 3 20071 20874 803 100%
6. CONCLUSION AND FUTUREWORK
Load Balancing can be achieved through virtual machine migration. However the existing migration techniques constraints to improve the SLA and often compromise to a higher scale on the other performance evaluation factors. This work, demonstrates the optimal three phase virtual machine migration technique with up to 70% improvement to retain SLA compared to the other virtual machine migration technique. The work also elaborates on the virtual machine image operability most suitable for migration and determines the best format. However the proposed technique is independent of the virtual machine image format and demonstrates the same improvement. The comparative analysis is been done with the proposed technique with the existing techniques like IQR MC, IQR MMT, LR MC, LR MMT, LR MU, LRR MC, LRR MMT, LRR MU, LRR RS, LR RS, MAD MC, MAD MMT, MAD MU, MAD RS, THR MC, THR MMT, THR MU and THR RS. The work also furnishes the practical evaluation results from the simulation to retain the improvement of the other parametersat least to the mean of other techniques during SLA improvement.Also this proposed technique for virtual machine migration demonstrates no loss in existing CPU utilization during load balancing.
7. REFERENCES
[1] T. N. Y. Times, "The cloud factories: Power, pollution and the internet. [Online]. Available:
http://www.nytimes.com/2012/09/23/technology/data-centers-waste-vast-amounts-of-energy-belying-industry-image.html, 2014"
[2] Beloglazov and R. Buyya, "Managing overloaded hosts for dynamic consolidation of virtual machines in cloud data centers under quality of service constraints", IEEE Trans. Parallel Distrib. Syst., vol. 24, no. 7, pp. 1366-1379, 2013 [3] H. Xu and B. Li, "Anchor: A versatile and efficient framework for resource management in the cloud", IEEE Trans.
Parallel Distrib. Syst., vol. 24, no. 6, pp. 1066-1076, 2013
[4] S. Di and C.-L. Wang, "Dynamic optimization of multi-attribute resource allocation in self-organizing clouds", IEEE Trans. Parallel Distrib. Syst., vol. 24, no. 3, pp. 464-478, 2013
[5] J. Zhan , L. Wang , X. Li , W. Shi , C. Weng , W. Zhang and X. Zang, "Cost-aware cooperative resource provisioning for heterogeneous workloads in data centers", IEEE Trans. Comput., vol. 62, no. 11, pp. 2155-2168, 2013
[6] X. Liu , C. Wang , B. Zhou , J. Chen , T. Yang and A. Zomaya, "Priority-based consolidation of parallel workloads in the cloud", IEEE Trans. Parallel Distrib. Syst., vol. 24, no. 9, pp. 1874-1883, 2013
[7] D. Carrera , M. Steinder , I. Whalley , J. Torres and E. Ayguad, "Autonomic placement of mixed batch and transactional workloads", IEEE Trans. Parallel Distrib. Syst., vol. 23, no. 2, pp. 219-231, 2012
[8] Y. Lee and A. Zomaya, "Energy efficient utilization of resources in cloud computing systems", The J. Supercomput., vol. 60, no. 2, pp. 268-280, 2012
[9] T. Ferreto , M. Netto , R. Calheiros and C. De Rose, "Server consolidation with migration control for virtualized data centers", Future Generation Comput. Syst., vol. 27, no. 8, pp. 1027-1034, 2011