Power System Security of IEEE-14 Bus with
Contingency Analysis
Chandrashekhar S. Hiwarkar
1, Prakash G. Burade
21
Department of Electrical Engineering
Research Scholar, Priyadarshini College of Engineering, Nagpur, Maharashtra, India.
2
Department of Electrical Engineering
Sandip Institute of Technology & Research Center, Nashik, Maharashtra, India
Abstract- Power system security is the ability to maintain the flow of electricity from the generators to the customers, especially under disturbed conditions. Since disturbances can be small or large, localized or widespread, the planning and design of the power system must achieve a certain level of security. To secure the system against more severe disturbances obviously requires more expensive designs; hence, the design criteria are chosen to meet an appropriate level of security. In the more developed countries, the customer is often willing to pay more for minimizing the interruption of power, whereas in the less developed countries the scarcity of capital and other reasons keep the level of power system security lower. The Power System needs to be operationally secure, i.e. with minimal probability of blackout and equipment damage. An important component of power system security is the system’s ability to withstand the effects of contingencies. A contingency is basically an outage of a generator, transformer and or line, and its effects are monitored with specified security limits. This work reviews the techniques for contingency analysis based on line flow analysis. Contingency analysis is performed considering the line and generator outage contingencies, in order to identify the effect of an increase in loading to critical line and generator outages. The effectiveness of the proposed is tested on IEEE-14 bus system.
Keywords – Contingency analysis, Contingency Selection, Security assessment, UPFC
I. INTRODUCTION
The power system operation is said to be normal when the power flows and the bus voltages are within acceptable limits despite changes in load or available generation. From this perspective, security is the probability of a power system‟s operating point remaining in a viable state of operation. System security can be broken down into two major functions that are carried out in an operations control center:
i) Security assessment and ii) Security control.
1.1 Security Assessment 1.1.1 Static security assessment
Static security assessment (also referred to as steady state security) is the ability of a power system to reach a steady state operating point without violating system operating constraints. The violations of thermal limits of transmission lines and bus voltage limits are main concern for static security analysis. Under normal operating conditions, the following constraints must be satisfied:
(1) (2)
Where represents real power generation at bus, is the total system demand; is the total real power loss in the transmission network; | | is the voltage magnitude at bus; represents MVA flow in branch ; is the number of generators.
Constraints (1) and (2), when referred to the post contingency scenarios, are referred to as Security Constraints [2]. If any of the constraint violates, the system may experience disruption resulting in a „severe black out‟.
1.1.2 Transient Security Assessment
will cause loss of synchronism among system generators [1]. Transient security assessment is a subset of transient stability of the power system. Transient stability pertains to rotor angle stability, where the stability phenomena are characterized by the rotor oscillations under a severe perturbation. The goal of TSA is to solve non-linear dynamic equations describing the transient behavior of the system under a set of credible contingencies. In this paper, generators are represented by simple classical model and rotor dynamics of the system is studied [2].
I.2 Security Control
It determines the exact and proper security constraint scheduling which is required to obtain the maximized security level. Power systems are designed to survive all probable contingencies. A contingency is defined as an event that causes one or more important components such as transmission lines, generators, and transformers to be unexpectedly removed from service. Survival means the system stabilizes and continues to operate at acceptable voltage and frequency levels without loss of load. Operations must deal with a vast number of possible conditions experienced by the system, many of which are not anticipated in planning.
II. OPERATING STATE OF POWER SYSTEM
The former gives the security level of the system operating state [4]. The latter determines the appropriate security constrained scheduling required to optimally attaining the target security level. Before going into the static security level of a power system, let us analyze the different operating states of a power system. Based on the Security level of power system, its operating states are classified into;
Normal
Alert
Emergency
Extreme Emergency and
Restorative.
Figure 1 below depicts these states and the ways in which transition can occur from one state to another.
Disturbance Control Action
Figure 1. Power system operating states [1]
Normal State: In normal state, the power balance between generation and load is satisfied and no equipment is overloaded. All the voltages are within limits. In addition, the system has sufficient security margin to withstand any of the credible contingencies.
Alert state: Under this state, the power balance between generation and load is still met. No equipment is overloaded. No voltage is out of its limits. However, when a severe contingency occurs, the system will either have overloaded equipment‟s or have voltage violations.
Emergency state: The power balance between generation and load is still satisfied. However, either overloaded or voltage violations happen in emergency state. If suitable corrective control actions are taken, the state can still be restored to normal state or at least alert state.
Extreme State: Under this state, the power balance between generation and load is lost. Voltage violation may happen and some equipment is overloaded. There are cascading outages. Load shedding may be taken, to save as much of the system as possible.
Restorative Alert
Normal
Extreme
III. CONTINGENCY ANALYSIS
Maintaining power system security is one of the challenging tasks for the power system engineers. The security assessment is an essential task as it gives the knowledge about the system state in the event of a contingency. Contingency analysis technique is being widely used to predict the effect of outages in power systems, like failures of equipment, transmission line etc. The off line analysis to predict the effect of individual contingency is a tedious task as a power system contains large number of components. Practically, only selected contingencies will lead to severe conditions in power system like violation of voltage and active power flow limits. The process of identifying these severe contingencies is referred as contingency selection and this can be done by calculating performance indices for each contingencies. Contingency analysis is one of the most notified issue in security assessment of any power system because with the existing complex infrastructure and with no extensive development of power stations, it is obvious that most of existing power systems cannot cope with the increase in demand. Contingency analysis should be performed for the unexpected and severe events that may occur in power system and preventing other related cascade accidents. The contingency analysis for a considered power system model involves the simulation of individual contingency. In order to make the contingency analysis easier, it comprises of three basic steps [3]. They are as follows:
A. Contingency creation: it is the first step of analysis. It consists of all set of possible contingencies that may occur in a power system. This process comprises of creating contingencies lists.
B. Contingency selection: it is the second step and it is the process which involves
selection of severe contingencies from the list that may lead to bus voltage and power limit violations. Here in this process contingency list is minimized by elimination of least severe contingency and taking into account of most severe ones. The severity of contingencies is found by index calculation for this process.
C. Contingency evaluation: it is the third step and the most important one as it involves necessary control action and necessary security actions which are needed in order to mitigate the effects of most severe contingencies in a power system. Performance index (PI) is the method which is used for quantifying the severity and ranking those contingencies in the order of their severity.
The main motivation of the work is to carry out the contingency selection by calculating the two kinds of performance indices; active performance index (PIP) and reactive power performance index (PIQ) for severe transmission line outage [4].
For calculating those performance indices various iterative methods can be used.
3.1 Power Flow Solution
Power flow studies are necessary for control and planning of an existing power system and also for planning its future expansion. Determining of active and reactive power flow for each line and calculation of magnitude and phase angle of voltages at each bus is a challenging thing. While solving the power flow problem, assumption is taken as, power system is a single phase model and is operating under balanced condition. With each bus four quantities are associated. These are voltage magnitude |V|, phase angle (δ), real power P and reactive power Q. The system buses are divided into three categories: they are as follows:
SLACK BUS: This bus is also known as swing bus. This bus is used as reference where the magnitude and phase angle of the voltages are only specified. This bus finds the difference between the scheduled loads and generated power which are caused by the losses in the networks.
LOAD BUSES: The magnitude of bus voltage and the phase angle of the bus voltage are unknown. The active and the reactive power is specified. These buses are also known as P-Q buses.
REGULATED BUSES: These are also known as generator buses, or voltage controlled buses. Real power and voltage magnitude are specified at these buses. The phase angle of the voltages and the reactive powers are to be determined. These buses are known as P-V buses. The mathematical formulation of the power flow or the load flow problem results into nonlinear algebraic equations which can only be solved by iterative techniques. There are various iterative techniques.
Gauss-Seidel (GS) load flow method
Newton-Raphson (NR) load Flow method
Fast Decoupled load flow (FDLF) method
3.2 Fast Decoupled Load Flow (Fdlf) Method
The fast decoupled power flow method is a very fast and efficient method of obtaining power flow problem solution. In this method, both, the speeds as well as the sparsity are abused. This is actually an extension of Newton-Raphson method formulated in polar coordinates with certain approximations which result into a fast algorithm for power flow solution. This method exploits the property of the power system where in MW flow-voltage angle and MVAR flow-voltage magnitude are loosely coupled. In other words a small change in the magnitude of the bus voltage does not affect the real power flow at the bus and similarly a small change in phase angle of the bus voltage has hardly any effect on reactive power flow.
Because of this loose physical interaction between MW and MVAR flows in a power system, the MW- δ and MVAR-V calculations can be decoupled. This decoupling results in a very simple, fast and reliable algorithm. As we know, the sparsity feature of admittance matrix minimizes the computer memory requirements and results in faster computations. The accuracy is comparable to that of the N-R method.
The load flow predicts all flows and voltages in the network when given the status of generators and loads. The principal information obtained from a power flow study is the magnitude and phase angle of the voltage at each bus and the real and reactive power flows in equipment such as transmission lines and transformers in a power system under balanced three-phase steady state conditions. Newton method and fast decupled load flow (FDLF) are widely used for their good convergence, fast calculation speed and moderate computer storage request. Comparing with the Newton method, The FDLF method is much faster [5].
3.3 Contingency Selection
Maintaining Power system security (PSS) is one of most demanding practical tasks for power system (PS) engineers. The safety determination is necessary job as it provides knowledge about system while it is in state of contingency. Contingency analysis function is used to decide consequence of faults such as failures of devices, transmission line (TL) error etc. & to apply for obligatory actions to prevent PS instability & dependable. The off line analysis of individual contingency is tedious job because PS have a huge amount of elements. Actually, only selected contingencies will guide to severe conditions in PS. Recognize severe contingencies is referred as contingency selection & this can be performed via manipulative presentation indices for each line. The contingency investigation technique is much time overwhelming and its convoluted calculation of complex AC load flow computation subsequent to every probable fault at different generators & TL.
In sort to alleviate above issue, an automatic contingency screening (CS) demand is assume that recognize & ranks faults that actually due to abnormal circumstances. So CS & ranking for unsymmetrical fault. The contingencies are screened as per to severity index or performance index (PI) in which maximum value of these indices symbolize maximum level of hardness. The major purpose of this work is to hold contingency selection via manipulative the two types of performance indices namely, active power performance index (PIP) & reactive power performance index (PIV) for individual line fault. (PIV) have been calculated for IEEE-14 bus test system that is presented in figure 3. Employing algorithm implemented in MATLAB software. With help of Fast Decoupled Load Flow (FDLF), PIP & PIV performed in MATLAB & contingency ranking is obtained. Founded values of the PIQ, contingencies is ranked in TL contingency guiding to maximum value of PIV has been ranked first & least values of PIV is ranked last. The solutions of active PF (APF), reactive PF (RPF) in different TL & bus voltages at the buses has been studied. Since contingency analysis techniques involve prediction of effect of individual contingency cases, the above process becomes very tedious & time consuming while complex PS network is wide and big. In sort to avoid exceeding problem of CS or contingency selection technique (CST) found critical concern. As it found overall probable faults do not cause overload voltage or beneath voltage in different PS devices. The procedure of recognizing contingencies that really go to encroachment of real operational restrictions is termed as contingency selection [10]. The contingencies are chosen via manipulative type of severity indices termed as Performance Indices (PI). These indices are computed utilizing conventional power load flow algorithms for single contingencies in an off line mode. Set along values attained contingencies are ranked in manner, where they obtained maximum value of PI is ranked 1st. The investigation is basically preliminary via eventuality that is ranked 1 & is persisted in from no severe contingencies are available. Here two kinds of PI, that is highly utilize, these are active power performance index (PIP) & reactive power performance index (PIQ). PIP shows violation of line APF & is shown via equation (3)
Here,
= Voltage at bus = Voltage at bus
= Reactance of line linking bus & bus
Another PI parameter that is utilized to bus voltage magnitude violations. It mathematically presented in following equation;
(5)
Where = voltage of bus , & are highest & lowest voltage limits, is average of & , is overall no. of load buses in system [7].
To find the line by line contingencies, following algorithm is developed by using FDLF.
Figure 2: Algorithm for the selection contingency ranking [5]
IV. IEEE-14 BUS (TEST SYSTEM)
The single line figure of IEEE 14-bus standard test system is presented in figure 3 that is made up of 20 TL. Five no. synchronous machines, consisting two generators, located at buses 1 & 2 as well as three synchronous compensators utilized for RPF handles, located at buses 3, 6 & 8.
Start
Read the system bus data and line data
Set the contingency counter K=0
Simulate the line outage contingency
Calculate the power flow in all the Xn line & Pmax using FDLF
Calculate the voltage at all the buses using FDLF
Last contingency reached
Increment the counter K=K+1
Rank the contingencies as per the highest value of PIp & PIv
Do the power flow analysis for the most severe contingency case
Print the result
Calculate PIp using (4.7)
Calculate PIv using (4.9)
Figure 3: Single diagram of IEEE-14 Bus system [11]
V. RESULT
To search Contingency Ranking subsequently technique is assumed: The AC power load flow program for contingency analysis (CA) by adopting the Fast Decoupled Load Flow (FDLF) algorithms that provides a quick solution for the contingency investigation as it possesses benefits of matrix alteration equation included & applied to suggest issue of possible contingencies concerning TL fault without reinventing system Jacobian matrix for alliteration. The ranking of line contingency is shown in shown in following table.
Table 1: (Test Result) Line by Line Contingency Ranking
Outage Line No. PIP PIV Ranking
1 1.1693 7.3032 10
2 0.9807 7.6696 11
3 1.1654 10.0014 7
4 0.9999 7.3213 12
5 0.9820 8.8759 9
6 0.9640 13.2572 2
7 0.9915 0.3566 19
8 1.0747 1.1753 17
9 0.9807 10.5776 4
10 1.2396 1.6047 16
11 1.0142 9.5907 8
12 1.0127 1.8089 15
13 1.0569 1.3669 18
14 1.0072 10.4518 6
15 1.0759 0.0844 20
16 1.0114 13.3464 1
17 1.0164 2.3482 13
18 1.0030 10.5217 5
19 1.0008 12.5538 3
0 5 10 15
1 2 3 4 5 6 7 8 9 10 11 12 13 14 15 16 17 18 19 20
P
IV
Outage Line Number
PIV
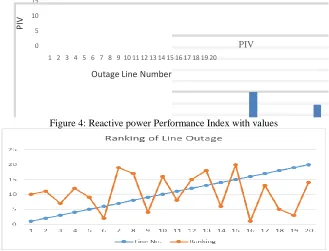
Figure 4: Reactive power Performance Index with values
Figure 5: Ranking of Line outage
VI. CONCLUSION
The system has a total 20 no. of transmission lines, hence we evaluate for 20 line contingency scenarios by considering the one line outage contingency at a time. The performance indices are summarized in the above table where it can inferred that outage in the line no.16 (Shown in bold) is the most harmful one and its outage will result a great impact on the whole system .The high value of PIV for this outage also suggest that the highest attention be given for this line during the operation. The contingency have been ordered by their ranking where the most severe contingency is being ranked 1 and the least has been rank 20.
VII. REFERENCES
[1] Saud S. Halilˇcevic´, Senior Member, IEEE, Ferdinand Gubina, Life Senior Member, IEEE, and Andrej F. Gubina, Member, IEEE, “Prediction of Power System Security Levels” IEEE TRANSACTIONS ON POWER SYSTEMS, VOL. 24, NO. 1, FEBRUARY 2009. [2] Yong Fu, Member, IEEE, Mohammad Shahidehpour, Fellow, IEEE, and Zuyi Li, Member, IEEE, “Security-Constrained Unit Commitment
with AC Constraints” IEEE TRANSACTIONS ON POWER SYSTEMS, VOL. 20, NO. 3, AUGUST 2005.
[3] Toshi Mandloi1 and Anil K Jain, “A STUDY OF POWER SYSTEM SECURITY AND CONTINGENCY ANALYSIS” International Journal of Scientific Research Engineering & Technology (IJSRET), Volume 3, Issue 4, July 2014.
[4] B. Rajanarayan Prusty, Bhagabati Prasad Pattnaik, Prakash Kumar Pandey, A. Sai Santosh, “Power System Security Analysis” International Journal of Scientific & Engineering Research, Volume 5, Issue 5, May 2014.
[5] T. Hariharan and M. Gopalakrishnan, “Weak Bus Identification in Power System Using Contingency Ranking” IRET Transaction on Power Systems and Modelling (ITPSM) Vol. 1, Issue. 1, pp. 1-3, Dec. 2013.
[6] S. Ravindra, V. C. Veera Reddy and S. Sivanagaraju, “Power System Severity Analysis under Generator Outage Condition” International Journal of Advanced Research in Electrical, Electronics and Instrumentation Engineering, Vol. 4, Issue 1, pp. 317-323 , January 2015.
[7] P. Sobha Rani, “ENHANCEMENT OF POWER SYSTEM SECURITY USING PSO-NR OPTIMIZATION TECHNIQUE” International
Journal of Electrical Engineering & Technology (IJEET), Volume 7, Issue 1, pp.35-44, Jan-Feb, 2016.
[8] Alexey Osak1, Daniil Panasetsky, and Elena Buzina, “Methods of analysis of the power system security” E3S Web of Conferences 58, pp.1-6, 2018.
[9] H. Arul Devi and S. Padma, “ Optimal Location and Parameter Setting of FACTS Devices based on WIPSO and ITLBO for Power System Security Enhancement under Single Contingency” International Journal of Engineering and Advanced Technology (IJEAT), Volume-6, Issue-6, pp.177-185, August 2017.
[10] Magesh Paramasivam, Student Member, IEEE, Sambarta Dasgupta, Student Member, IEEE, Venkataramana Ajjarapu, Fellow, IEEE, and Umesh Vaidya, Member, IEEE, “Contingency Analysis and Identification of Dynamic Voltage Control Areas” IEEE TRANSACTIONS ON POWER SYSTEMS, pp. 1-10, 2014.
![Figure 1. Power system operating states [1]](https://thumb-us.123doks.com/thumbv2/123dok_us/1414872.1654462/2.612.137.493.373.536/figure-power-system-operating-states.webp)
![Figure 2: Algorithm for the selection contingency ranking [5]](https://thumb-us.123doks.com/thumbv2/123dok_us/1414872.1654462/5.612.137.483.220.543/figure-algorithm-selection-contingency-ranking.webp)
![Figure 3: Single diagram of IEEE-14 Bus system [11]](https://thumb-us.123doks.com/thumbv2/123dok_us/1414872.1654462/6.612.71.340.382.666/figure-single-diagram-of-ieee-bus-system.webp)