ISSN: 2278-7461, www.ijeijournal.com
Volume 1, Issue 2 (September 2012) PP: 23-35
Performance Evaluation of a Low Heat Rejection Diesel Engine
with Jatropha
N. Janardhan
1, M.V.S. Murali Krishna
2, P.Ushasri
3, and P.V.K. Murthy
41
Mechanical Engineering Department, Chaitanya Bharathi Institute of Technology, Gandipet, Hyderabad-500075. 2
Mechanical Engineering Department, College of Engineering, Osmania University, Hyderabad- 500 007 3,4
Vivekananda Institute of Science and Information Technology, Shadnagar, Mahabubnagar-509216.
Abstract––Investigations were carried out to evaluate the performance of a low heat rejection (LHR) diesel engine consisting of air gap insulated piston with 3-mm air gap, with superni (an alloy of nickel) crown, air gap insulated liner with superni insert and ceramic coated cylinder head with different operating conditions of crude jatropha oil (CJO) with varied injection timing and injection pressure. Performance parameters were determined at various values of brake mean effective pressure (BMEP). Pollution levels of smoke and oxides of nitrogen (NOx) were recorded at the various values of BMEP. Combustion characteristics of the engine were measured with TDC (top dead centre) encoder, pressure transducer, console and special pressure-crank angle software package. Conventional engine (CE) showed deteriorated performance, while LHR engine showed improved performance with vegetable operation at recommended injection timing and pressure and the performance of both version of the engine improved with advanced injection timing and higher injection pressure when compared with CE with pure diesel operation. Relatively, peak brake thermal efficiency increased by 14%, smoke levels decreased by 27% and NOx levels increased by 49% with vegetable oil operation on LHR engine at its optimum injection timing, when compared with pure diesel operation on CE at manufacturer’s recommended injection timing.
Keywords––Vegetable oil, LHR engine, Performance, Exhaust emissions, Combustion characteristics.
I.
INTRODUCTION
[25] experiments on LHR engine, with an air gap insulated piston, air gap insulated liner and ceramic coated cylinder head. The piston with nimonic crown with 2 mm air gap was fitted with the body of the piston by stud design. Mild steel sleeve was provided with 2 mm air gap and it was fitted with the 50 mm length of the liner. The performance was deteriorated with this engine with pure diesel operation, at recommended injection timing. Hence the injection timing was retarded to achieve better performance and pollution levels. Experiments were conducted [12] with air gap insulated piston with superni crown and air gap insulated liner with superni insert with varied injection timing and injection pressure with different alternate fuels like vegetable oils and alcohol and reported that LHR engine improved the performance with alternate fuels. Experiments were conducted [26] on different degrees of insulation and reported that performance was improved with higher degree of insulation. Investigations were carried out [27] with air gap insulated piston, air gap insulated liner and ceramic coated cylinder head with crude jatropha oil an crude pongamia oil based biodiesel and reported alternate fuels increased the efficiency of the engine and decreased smoke emissions and increased NOx emissions.
The present paper attempted to evaluate the performance of LHR engine, which consisted of air gap insulated piston, air gap insulated liner and ceramic coated cylinder head with crude jatropha oil with varied injection pressure and injection timing and compared with pure diesel operation on CE at recommended injection timing and injection pressure.
II.
METHODOLOGY
LHR diesel engine contained a two-part piston Fig 1, the top crown made of low thermal conductivity material, superni-90 screwed to aluminum body of the piston, providing a 3-mm-air gap in between the crown and the body of the piston. The optimum thickness of air gap in the air gap piston was found to be 3-mm [23], for better performance of the engine with superni inserts with diesel as fuel. A superni-90 insert was screwed to the top portion of the liner in such a manner that an air gap of 3-mm is maintained between the insert and the liner body. At 500oC the thermal conductivity of superni-90 and air are 20.92 and 0.057 W/m-K respectively. Partially stabilized zirconium (PSZ) of thickness 500 microns was coated by means of plasma coating technique.
1. Crown with threads 7 Insert with threads 2. Gasket 8. Air gap
3. Air gap 9. Liner 4. Body
5. Ceramic coating
6. Cylinder head
Insulated piston Insulated liner Ceramic coated cylinder head
Figure.1 Assembly details of air gap insulated piston, air gap insulated liner and ceramic coated cylinder head
The properties of the vegetable oil and the diesel used in this work are presented in TABLE 1
Table 1. Properties of the test fuels
Experimental setup used for the investigations of LHR diesel engine with jatropha oil based bio-diesel is shown in Fig 2. CE had an aluminum alloy piston with a bore of 80 mm and a stroke of 110mm. The rated output of the engine was 3.68 kW at a speed of 1500 rpm. The compression ratio was 16:1 and manufacturer’s recommended injection timing and injection pressures were 27obTDC and 190 bar respectively. The fuel injector had three holes of size 0.25mm. The
Test Fuel Viscosity at
25oC (centi-poise)
Density at 25oC
Cetane number Calorific value (kJ/kg)
Diesel 12.5 0.84 55 42000
combustion chamber consisted of a direct injection type with no special arrangement for swirling motion of air. The engine was connected to electric dynamometer for measuring its brake power. Burette method was used for finding fuel consumption of the engine.
1.Engine, 2.Electical Dynamo meter, 3.Load Box, 4.Orifice meter, 5.U-tube water manometer, 6.Air box, 7.Fuel tank, 8, Three way valve, 9.Burette, 10. Exhaust gas temperature indicator, 11.AVL Smoke meter, 12.Netel Chromatograph NOx Analyzer, 13.Outlet jacket water temperature indicator, 14. Outlet-jacket water flow meter, 15.Piezo-electric pressure transducer, 16.Console, 17.TDC encoder, 18.Pentium Personal Computer and 19. Printer.
Figure 2. Experimental Set-up
Air-consumption of the engine was measured by air-box method. The naturally aspirated engine was provided with water-cooling system in which inlet temperature of water was maintained at 60oC by adjusting the water flow rate. The
engine oil was provided with a pressure feed system. No temperature control was incorporated, for measuring the lube oil temperature. Copper shims of suitable size were provided in between the pump body and the engine frame, to vary the injection timing and its effect on the performance of the engine was studied, along with the change of injection pressures from 190 bar to 270 bar (in steps of 40 bar) using nozzle testing device. The maximum injection pressure was restricted to 270 bar due to practical difficulties involved. Exhaust gas temperature (EGT) was measured with thermocouples made of iron and iron-Constantan. Pollution levels of smoke and NOx were recorded by AVL smoke meter and Netel Chromatograph
NOx analyzer respectively at various values of BMEP. Piezo electric transducer, fitted on the cylinder head to measure pressure in the combustion chamber was connected to a console, which in turn was connected to Pentium personal computer. TDC encoder provided at the extended shaft of the dynamometer was connected to the console to measure the crank angle of the engine. A special P- software package evaluated the combustion characteristics such as peak pressure (PP), time of occurrence of peak pressure (TOPP), maximum rate of pressure rise (MRPR) and time of occurrence of maximum rate of pressure rise (TOMRPR) from the signals of pressure and crank angle at the peak load operation of the engine. Pressure-crank angle diagram was obtained on the screen of the personal computer. The accuracy of the instrumentation used in the experimentation is 0.1%.
III.
RESULTS AND DISCUSSION
3.1 Performance Parameters
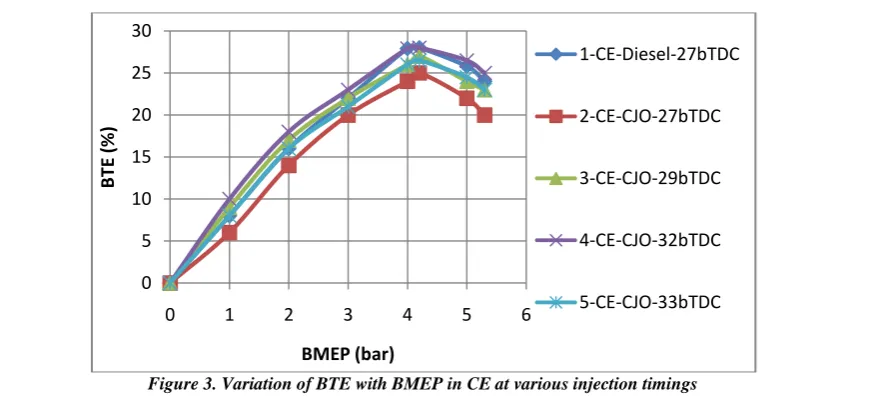
Fig 3 indicates that CE with vegetable oil showed the deterioration in the performance for entire load range when compared with the pure diesel operation on CE at recommended injection timing.
Figure 3. Variation of BTE with BMEP in CE at various injection timings 0
5 10 15 20 25 30
0 1 2 3 4 5 6
B
TE
(%
)
BMEP (bar)
1-CE-Diesel-27bTDC
2-CE-CJO-27bTDC
3-CE-CJO-29bTDC
4-CE-CJO-32bTDC
Although carbon accumulations on the nozzle tip might play a partial role for the general trends observed, the difference of viscosity between the diesel and vegetable oil provided a possible explanation for the deterioration in the performance of the engine with bio-diesel operation. The result of lower jet exit Reynolds numbers with vegetable oil adversely affected the atomization. The amount of air entrained by the fuel spray was reduced, since the fuel spray plume angle was reduced, resulting in slower fuel- air mixing. In addition, less air entrainment by the fuel spay suggested that the fuel spray penetration might increase and resulted in more fuel reaching the combustion chamber walls. Furthermore droplet mean diameters (expressed as Sauter mean) were larger for vegetable oil leading to reduce the rate of heat release as compared with diesel fuel. This also, contributed the higher ignition (chemical) delay of the vegetable oil due to lower Cetane number. According to the qualitative image of the combustion under the crude vegetable oil operation with CE, the lower BTE was attributed to the relatively retarded and lower heat release rates. BTE increased with the advancing of the injection timing in CE with the vegetable oil at all loads, when compared with CE at the recommended injection timing and pressure. This was due to initiation of combustion at earlier period and efficient combustion with increase of air entrainment in fuel spray giving higher BTE. BTE increased at all loads when the injection timing was advanced to 32obTDC in CE at the normal temperature of vegetable oil. The increase of BTE at optimum injection timing over the recommended injection timing with vegetable oil with CE could be attributed to its longer ignition delay and combustion duration. BTE increased at all loads when the injection timing was advanced to 32obTDC in CE, at the preheated temperature of the vegetable oil. The performance improved further in CE with the preheated vegetable oil for entire load range when compared with normal vegetable oil. Preheating of the vegetable oil reduced the viscosity, which improved the spray characteristics of the oil.
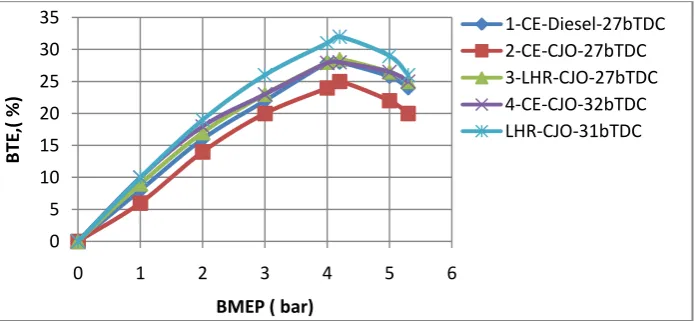
From Fig 4, it could be noticed that LHR version of the engine showed the improved performance for the entire load range compared with CE with pure diesel operation.
Figure 4. Variation of BTE with BMEP in LHR engine at various injection timings
High cylinder temperatures helped in better evaporation and faster combustion of the fuel injected into the combustion chamber. Reduction of ignition delay of the vegetable oil in the hot environment of the LHR engine improved heat release rates and efficient energy utilization. Preheating of vegetable oil improves performance further in LHR version of the engine. The optimum injection timing was found to be 31obTDC with LHR engine with normal vegetable oil operation. Since the hot combustion chamber of LHR engine reduced ignition delay and combustion duration and hence the optimum injection timing was obtained earlier with LHR engine when compared with CE with the vegetable oil operation.
Fig 5 indicates that peak BTE was higher in the LHR engine when compared with CE at all loads with vegetable oil operation. Preheating of the vegetable oil improved the performance in both versions of the engine compared with the vegetable oil at normal temperature. Preheating reduced the viscosity of the vegetable oils, which reduced the impingement of the fuel spray on combustion chamber walls, causing efficient combustion thus improving BTE.
Figure 5. Variation of BTE with BMEP in both versions of the engine at recommended and optimized injection timings 0
5 10 15 20 25 30 35
0 1 2 3 4 5 6
B
TE
(%
)
BMEP (bar)
1-CE-Diesel-27bTDC
2-LHR-CJO-27bTDC
3-LHR-CJO-31bTDC
4-LHR-CJO-32bTDC
0 5 10 15 20 25 30 35
0 1 2 3 4 5 6
B
TE
,(
%
)
BMEP ( bar)
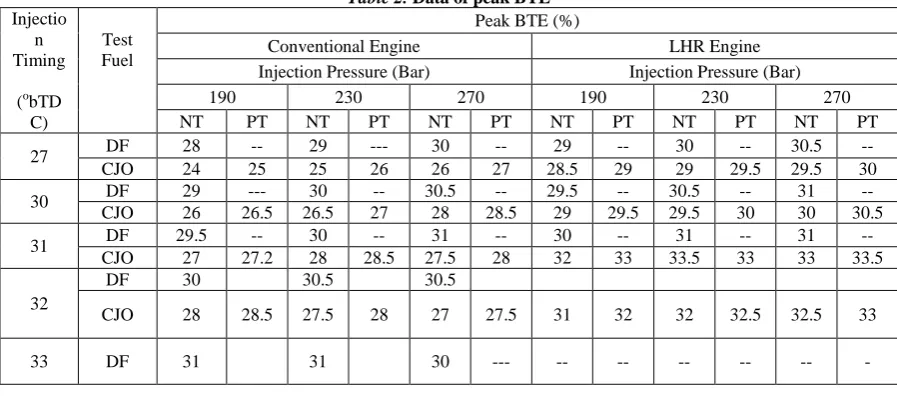
Injection pressure was varied from 190 bars to 270 bars to improve the spray characteristics and atomization of the vegetable oils and injection timing is advanced from 27 to 34obTDCfor CE and LHR engine. The improvement in BTE at higher injection pressure was due to improved fuel spray characteristics. However, the optimum injection timing was not varied even at higher injection pressure with LHR engine, unlike the CE. Hence it was concluded that the optimum injection timing is 32obTDC at 190 bar, 31obTDC at 230 bar and 30obTDC at 270 bar for CE. The optimum injection timing for LHR engine was 31obTDC irrespective of injection pressure.
From TABLE 2, it could be noticed that improvement in the peak BTE was observed with the increase of injection pressure and with advancing of the injection timing in both versions of the engine. This was due to improved spraying characteristics and efficient combustion as vegetable oil got long duration of combustion and hence advancing of injection timing helped efficient energy release from the fuel leading to produce higher BTE. Peak BTE was higher in the LHR engine when compared to CE with different operating conditions of the vegetable oil
Table 2. Data of peak BTE
Injectio n Timing
(obTD C)
Test Fuel
Peak BTE (%)
Conventional Engine LHR Engine
Injection Pressure (Bar) Injection Pressure (Bar)
190 230 270 190 230 270
NT PT NT PT NT PT NT PT NT PT NT PT
27 DF 28 -- 29 --- 30 -- 29 -- 30 -- 30.5 --
CJO 24 25 25 26 26 27 28.5 29 29 29.5 29.5 30
30 DF 29 --- 30 -- 30.5 -- 29.5 -- 30.5 -- 31 -- CJO 26 26.5 26.5 27 28 28.5 29 29.5 29.5 30 30 30.5
31 DF 29.5 -- 30 -- 31 -- 30 -- 31 -- 31 --
CJO 27 27.2 28 28.5 27.5 28 32 33 33.5 33 33 33.5
32
DF 30 30.5 30.5
CJO 28 28.5 27.5 28 27 27.5 31 32 32 32.5 32.5 33
33 DF 31 31 30 --- -- -- -- -- -- -
From TABLE 3, it is evident that brake specific energy consumption (BSEC) at peak load decreased with the increase of injection pressure and with the advancing of the injection timing at different operating conditions of the vegetable oil.
Table 3. Data of BSEC at peak load operation
Inje ctio n Ti min
g (O bT DC )
Test Fuel
BSEC (kW/ kW)
Conventional Engine LHR Engine
Injection Pressure (Bars) Injection Pressure (Bars)
190 230 270 190 230 270
NT PT NT PT NT PT NT PT NT PT NT PT
27
DF 4.00 -- 3.92 -- 3.84 -- 4.16 --- 4.08 -- 4.00 -- CJO 4.96 4.70 4.70 4.65 4.65 4.60 3.96 3.92 3.92 3.88 3.88 3.84
30
D 3.92 --- 3.88 -- 3.84 -- 4.08 -- 4.00 -- 3.90 -- CJO 4.70 4.65 4.65 4.60 3.92 3.88 3.93 3.89 3.89 3.85 3.85 3.81
31 DF 3.84 -- 3.80 -- 3.77 -- 3.86 3.85 3.84
CJO 4.45 4.40 3.92 3.88 3.96 3.92 3.78 3.76 3.76 3.74 3.74 3.72
32 DF 3.82 --- 3.78 -- 3.79 -- -- -- -- -- -- -- CJO 3.98 3.94 3.94 3.90 3.90 3.86 3.90 3.86 3.86 3.82 3.82 3.78 33 DF 3.77 -- 3.77 -- 3.84 --- -- ---- ---- ---- --- --- DF-Diesel Fuel, CJO- Crude Jatropha Oil, NT- Normal or Room Temperature , PT- Preheat Temperature
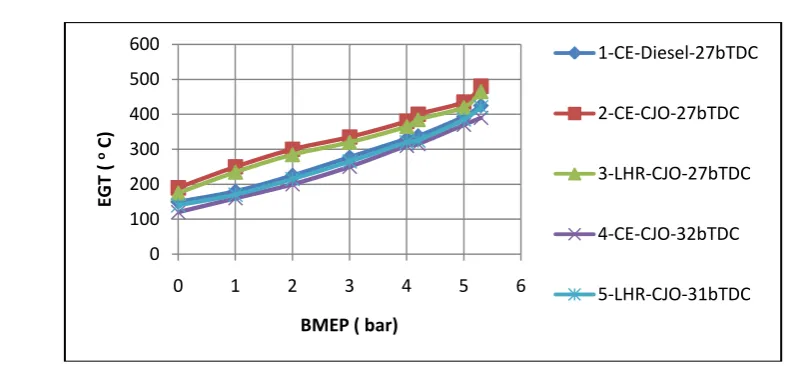
Figure 6 Variation of EGT with BMEP in both versions of the engine at recommended and optimized injection timings
The value of EGT at peak load decreased with advancing of injection timing and with increase of injection pressure in both versions of the engine with vegetable oil as it is evident from TABLE 4. Preheating of the vegetable oil further reduced the magnitude of EGT, compared with normal vegetable oil in both versions of the engine.
Table 4. Data of EGT at peak load operation
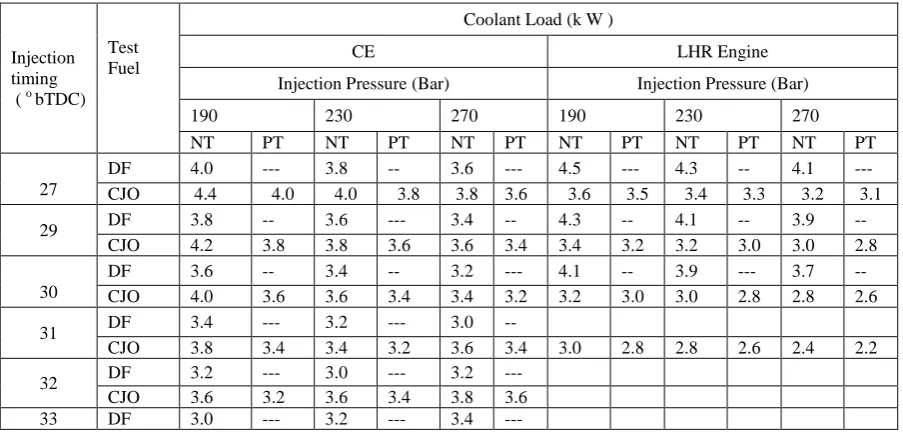
Curves from Fig 7 indicate that that coolant load (CL) increased with BMEP in both versions of the engine with test fuels. However, CL reduced with LHR version of the engine with vegetable oil operation when compared with CE with pure diesel operation.
0 100 200 300 400 500 600
0 1 2 3 4 5 6
EGT
(
oC)
BMEP ( bar)
1-CE-Diesel-27bTDC
2-CE-CJO-27bTDC
3-LHR-CJO-27bTDC
4-CE-CJO-32bTDC
5-LHR-CJO-31bTDC
Inject ion timin g (o b
TDC) Test Fuel
EGT at the peak load (oC)
Conventional Engine LHR Engine
Injection Pressure (Bars) Injection Pressure (Bars)
190 230 270 190 230 270
NT PT NT PT NT PT NT PT NT PT NT PT
27
DF 425 -- 410 --- 395 -- 475 --- 460 -- 445 -- CJO 480 450 450 420 420 390 465 460 460 455 455 450
30
DF 410 --- 400 -- 385 --- 455 --- 450 -- 445 -- CJO 450 420 420 390 390 370 440 420 420 390 390 370
31 DF 400 --- 390 -- 375 --- 450 --- 445 --- 440 --- CJO 420 390 390 370 410 390 420 390 390 370 370 350
32 DF 390 380 380 --
Figure.7. Variation of coolant load (CL) with BMEP in both versions of the engine at recommended and optimized injection timings with CTSO operation at an injection pressure of 190 bar.
Heat output was properly utilized and hence efficiency increased and heat loss to coolant decreased with effective thermal insulation with LHR engine. However, CL increased with CE with vegetable oil operation in comparison with pure diesel operation on CE. This was due to concentration of fuel at the walls of combustion chamber. CL decreased with advanced injection timing with both versions of the engine with test fuels. This was due to improved air fuel ratios. From TABLE .5, it is noticed that CL decreased with advanced injection timing and with increase of injection pressure.
Table 5. Data of CL at peak load operation
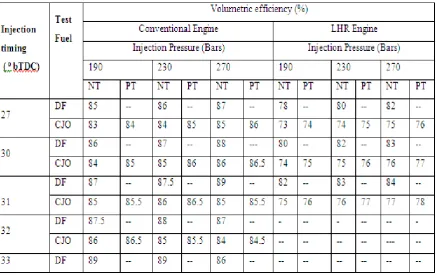
This was because of improved combustion and proper utilization of heat energy with reduction of gas temperatures. CL decreased with preheated vegetable oil in comparison with normal vegetable oil in both versions of the engine. This was because of improved spray characteristics. Curves from Fig 8 indicate that volumetric efficiency (VE) decreased with the increase of BMEP in both versions of the engine. This was due to increase of gas temperature with the load.
0 0.5 1 1.5 2 2.5 3 3.5 4 4.5 5
0 1 2 3 4 5 6
CL
(k
W)
BMEP (bar)
CE-Diesel-27 bTDC
CE-CJO-27 bTDC
LHR-CJO-27 bTDC
-CE-CJO-32 bTDC
LHR-CJO-31 bTDC
Injection timing ( o bTDC)
Test Fuel
Coolant Load (k W )
CE LHR Engine
Injection Pressure (Bar) Injection Pressure (Bar)
190 230 270 190 230 270
NT PT NT PT NT PT NT PT NT PT NT PT
27
DF 4.0 --- 3.8 -- 3.6 --- 4.5 --- 4.3 -- 4.1 --- CJO 4.4 4.0 4.0 3.8 3.8 3.6 3.6 3.5 3.4 3.3 3.2 3.1
29 DF 3.8 -- 3.6 --- 3.4 -- 4.3 -- 4.1 -- 3.9 -- CJO 4.2 3.8 3.8 3.6 3.6 3.4 3.4 3.2 3.2 3.0 3.0 2.8
30
DF 3.6 -- 3.4 -- 3.2 --- 4.1 -- 3.9 --- 3.7 -- CJO 4.0 3.6 3.6 3.4 3.4 3.2 3.2 3.0 3.0 2.8 2.8 2.6
31 DF 3.4 --- 3.2 --- 3.0 --
CJO 3.8 3.4 3.4 3.2 3.6 3.4 3.0 2.8 2.8 2.6 2.4 2.2
Figure 8 Variation of VE with BMEP in both versions of the engine at recommended and optimized injection timings
At the recommended injection timing, VE in the both versions of the engine with vegetable oil operation decreased at all loads when compared with CE with pure diesel operation. This was due increase of temperature of incoming charge in the hot environment created with the provision of insulation, causing reduction in the density and hence the quantity of air with LHR engine. VE increased marginally in CE and LHR engine at optimized injection timings when compared with recommended injection timings with vegetable oil operation. This was due to decrease of un-burnt fuel fraction in the cylinder leading to increase in VE in CE and reduction of gas temperatures with LHR engine.
TABLE 6 indicates that VE increased marginally with the advancing of the injection timing and with the increase of injection pressure in both versions of the engine. This was due to better fuel spray characteristics and evaporation at higher injection pressures leading to marginal increase of VE. This was also due to the reduction of residual fraction of the fuel, with the increase of injection pressure. Preheating of the vegetable oil marginally improved VE in both versions of the engine, because of reduction of un-burnt fuel concentration with efficient combustion, when compared with the normal temperature of the oil.
Table 6. Data of volumetric efficiency at peak load operation
3.2. Exhaust Emissions
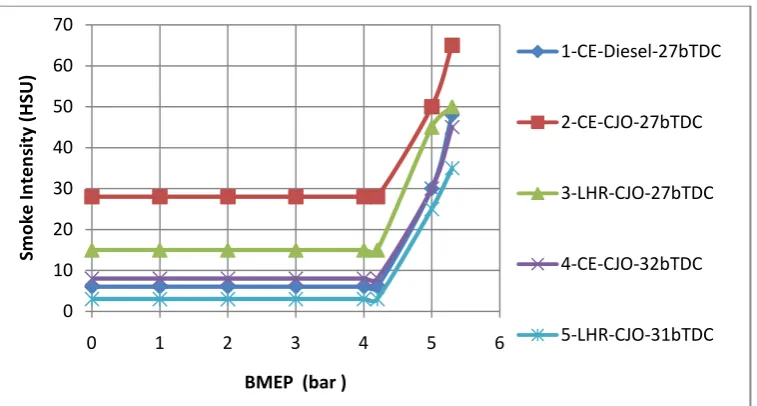
It was reported that [28] fuel physical properties such as density and viscosity could have a greater influence on smoke emission than the fuel chemical properties. It could be observed from Fig 9, that the value of smoke intensity
70 75 80 85 90 95 100
0 1 2 3 4 5 6
VE
(
%
)
BMEP (bar)
1-CE-Diesel-27bTDC
2-CE-CJO-27bTDC
3-LHR-CJO-27bTDC
4-CE-CJO-32bTDC
increased from no load to full load in both versions of the engine. During the first part, the smoke level was more or less constant, as there was always excess air present. However, in the higher load range there was an abrupt rise in smoke levels due to less available oxygen, causing the decrease of air-fuel ratio, leading to incomplete combustion, producing more soot density. The variation of smoke levels with the brake power typically showed a U-shaped behavior due to the pre-dominance of hydrocarbons in their composition at light load and of carbon at high load. Drastic increase of smoke levels was observed at the peak load operation in CE at different operating conditions of the vegetable oil, compared with pure diesel operation on CE. This was due to the higher value of the ratio of C/H of vegetable oil (0.83) when compared with pure diesel (0.45).
Figure 9 Variation of smoke intensity in Hartride Smoke Unit (HSU) with BMEP in both versions of the engine at recommended and optimized injection timings
The increase of smoke levels was also due to decrease of air-fuel ratios and VE with vegetable oil when compared with pure diesel operation. Smoke levels were related to the density of the fuel. Since vegetable oil had higher density compared to diesel fuels, smoke levels were higher with vegetable oil. However, LHR engine marginally reduced smoke levels due to efficient combustion and less amount of fuel accumulation on the hot combustion chamber walls of the LHR engine at different operating conditions of the vegetable oil compared with the CE. Density influences the fuel injection system. Decreasing the fuel density tends to increase spray dispersion and spray penetration. Preheating of the vegetable oils reduced smoke levels in both versions of the engine, when compared with normal temperature of the vegetable oils. This was due to i) the reduction of density of the vegetable oils, as density is directly proportional to smoke levels, ii) the reduction of the diffusion combustion proportion in CE with the preheated vegetable oil, iii) the reduction of the viscosity of the vegetable oil, with which the fuel spray does not impinge on the combustion chamber walls of lower temperatures rather than it directs into the combustion chamber.
From TABLE 7 it is evident that smoke levels decreased at optimized injection timings and with increase of injection pressure, in both versions of the engine, with different operating conditions of the vegetable oil. This was due to improvement in the fuel spray characteristics at higher injection pressures and increase of air entrainment, at the advanced injection timings, causing lower smoke levels.
Table 7. Data of smoke levels at peak load operation 0
10 20 30 40 50 60 70
0 1 2 3 4 5 6
Sm
o
ke
In
te
n
sit
y
(HSU)
BMEP (bar )
1-CE-Diesel-27bTDC
2-CE-CJO-27bTDC
3-LHR-CJO-27bTDC
4-CE-CJO-32bTDC
5-LHR-CJO-31bTDC
Injection timing ( o bTDC)
Test Fuel
Smoke intensity (HSU)
Conventional Engine LHR Engine
Injection Pressure (Bars) Injection Pressure (Bars)
190 230 270 190 230 270
NT PT NT PT NT PT NT PT NT PT NT PT
27 DF 48 -- 38 -- 34 -- 55 -- 50 -- 45 -- CJO 65 60 63 58 58 54 45 40 40 35 35 30
30 DF 36 -- 34 -- 32 -- 45 -- 42 -- 41 -- CJO 60 55 55 50 45 55 40 35 35 30 30 25
31
DF 33 --- 32 -- 30 -- 43 -- 41 -- 40 -- CJO 55 50 50 45 55 52 35 30 30 25 25 22
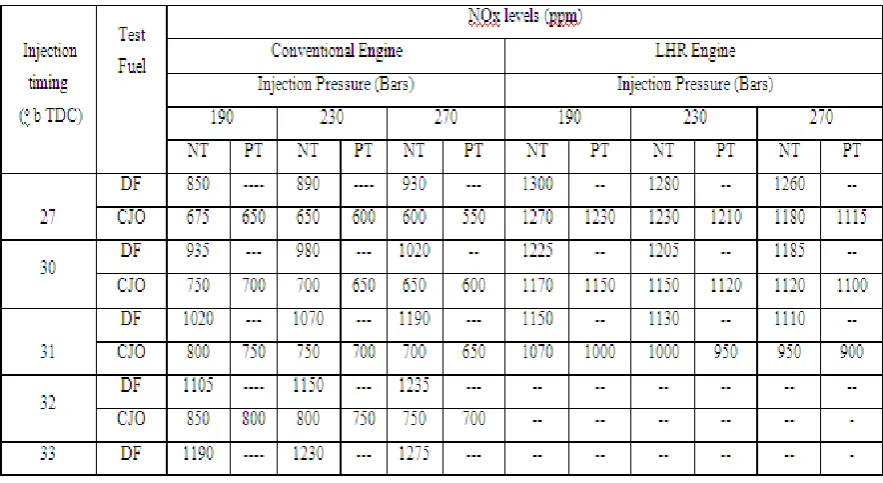
Curves from Fig10 indicate that NOx levels were lower in CE while they are higher in LHR engine at different operating conditions of the vegetable oil at the peak load when compared with diesel operation. This is due to lower heat release rate because of high duration of combustion causing lower gas temperatures with the vegetable oil operation on CE, which reduced NOx levels. Increase of combustion temperatures with the faster combustion and improved heat release rates in LHR engine cause higher NOx levels. As expected, preheating of the vegetable oil further increased NOx levels in CE and reduced the same in LHR engine when compared with the normal vegetable oil. This was due to improved heat release rates and increased mass burning rate of the fuel with which combustion temperatures increase leading to increase NOx emissions in the CE and decrease of combustion temperatures in the LHR engine with the improvement in air-fuel ratios leading to decrease NOx levels in LHR engine.
Figure 10. Variation of NOx levels with BMEP in both versions of the engine at recommended and optimized injection timings
TABLE 8 denotes that NOx levels increased with the advancing of the injection timing in CE with different operating conditions of vegetable oil.
Table 8 Data of NOx emissions at peak load operation
Residence time and combustion temperatures had increased, when the injection timing was advanced with the vegetable oil operation, which caused higher NOx levels. With the increase of injection pressure, fuel droplets penetrate and find oxygen counterpart easily. Turbulence of the fuel spray increased the spread of the droplets thus leading to decrease in
0 200 400 600 800 1000 1200 1400
0 1 2 3 4 5 6
NOx
(p
p
m
)
BMEP ( bar)
1-CE-Diesel-27bTDC
2-CE-CJO-27bTDC
3-LHR-CJO-27bTDC
4-CE-CJO-32bTDC
NOx levels with increase of injection pressure in CE. However, decrease of NOx levels was observed in LHR engine, due to decrease of combustion temperatures, when the injection timing was advanced and with increase of injection pressure.
3.3 Combustion Characteristics
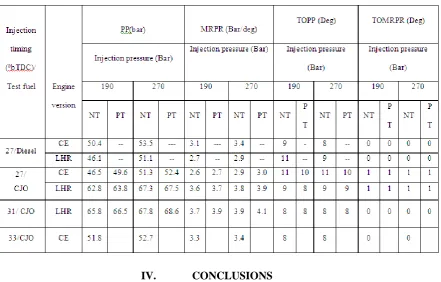
From TABLE 9, it could be seen that with vegetable oil operation, peak pressures were lower in CE while they were higher in LHR engine at the recommended injection timing and pressure, when compared with pure diesel operation on CE. This was due to increase of ignition delay, as vegetable oils require large duration of combustion. Mean while the piston started making downward motion thus increasing volume when the combustion takes place in CE. LHR engine increased the mass-burning rate of the fuel in the hot environment leading to produce higher peak pressures. The advantage of using LHR engine for vegetable oils was obvious as it could burn low Cetane and high viscous fuels. Peak pressures increased with the increase of injection pressure and with the advancing of the injection timing in both versions of the engine, with the vegetable oils operation. Higher injection pressure produces smaller fuel particles with low surface to volume ratio, giving rise to higher PP. With the advancing of the injection timing to the optimum value with the CE, more amount of the fuel accumulated in the combustion chamber due to increase of ignition delay as the fuel spray found the air at lower pressure and temperature in the combustion chamber. When the fuel- air mixture burns, it produced more combustion temperatures and pressures due to increase of the mass of the fuel. With LHR engine, peak pressures increases due to effective utilization of the charge with the advancing of the injection timing to the optimum value. The value of TOPP decreased with the advancing of the injection timing and with increase of injection pressure in both versions of the engine, at different operating conditions of vegetable oils. TOPP was more with different operating conditions of vegetable oil in CE, when compared with pure diesel operation on CE. This was due to higher ignition delay with the vegetable oil when compared with pure diesel fuel. This once again established the fact by observing lower peak pressure and higher TOPP, that CE with vegetable oil operation showed the deterioration in the performance when compared with pure diesel operation on CE. Preheating of the vegetable oils showed lower TOPP, compared with vegetable oil at normal temperature. This once again confirmed by observing the lower TOPP and higher PP, the performance of the both versions of the engine improved with the preheated vegetable oil compared with the normal vegetable oil. This trend of increase of MRPR and decrease of TOMRPR indicated better and faster energy substitution and utilization by vegetable oil, which could replace 100% diesel fuel. However, these combustion characters were within the limits hence the vegetable oil could be effectively substituted for diesel fuel.
Table 9. Data of PP, MRPR, TOPP and TOMRPR at peak load operation
IV.
CONCLUSIONS
ACKNOWLEDGMENTS
Authors thank authorities of Chaitanya Bharathi Institute of Technology, Hyderabad for providing facilities for carrying out research work. Financial assistance provided by All India Council for Technical Education (AICTE), New Delhi, is greatly acknowledged.
REFERENCES
1. Cummins, C. Lyle, Jr. Diesel's Engine, Volume 1: From Conception To 1918. Wilsonville, OR, USA: Carnot Press, 1993, ISBN 978-0-917308-03-1
2. Pramanik, K. Properties and use of Jatropha curcas oil and diesel fuel blends in compression ignition engine. Journal of Renewable Energy, 2003, 239- 48.
3. Ramadhas, A.S.S., Jayaraj, S. and Muraleedharan, C. Use of vegetable oils as I.C. engine fuels-A review. Renewable Energy, 2004, 29, 727-742.
4. Pugazhvadivu, M. and Jayachandran, KInvestigations on the performance and exhaust emissions of a diesel engine using preheated waste frying oil as fuel. Renewable energy, 2005, 30(14), 2189-2202.
5. Agarwal, D. and Agarwal, A.K. Performance and emissions characteristics of jatropha oil (preheated and blends) in a direct injection compression ignition engine. Int. J. Applied Thermal Engineering, 2007, 27, 2314-23. 6. Choudhury, S., Bose, P.K. Karanja or jatropha – a better option for an alternative fuel in C.I. engine. Proc. of the
International Conference & XX National Conference on I.C. Engines and Combustion, 2007, 321-326.
7. Surendra, R,K. and Suhash, D.V. Jatropha and karanj bio-fuel: as alternate fuel for diesel engine. ARPN Journal of Engineering and Applied Science, 2008, 3(1).
8. Canaker, M., Ozsezen, A.N. and Turkcan, A. Combustion analysis of preheated crude sunflower oil in an IDI diesel engine. Biomass Bio-energy, 2009, 33, 760-770.0
9. Venkanna, B.K. and Venkatarama Reddy,C. Performance, emission and combustion characteristics of DI diesel engine running on blends of honne oil/diesel fuel/kerosene. International Journal of Agriculture and Biology Engineering, 2009, 4(3), 1-10.
10. Misra, R.D. and Murthy, M.S. Straight vegetable oils usage in a compression ignition engine—A review. Renewable and Sustainable Energy Reviews, 2010, 14, 3005–3013.
11. Hanbey Hazar and Huseyin Aydin. Performance and emission evaluation of a CI engine fueled with preheated raw rapeseed oil (RRO)-diesel blends. Applied Energy, 2010, 87, 786-790.
12. Murali Krishna, M.V.S. Performance evaluation of low heat rejection diesel engine with alternate fuels. PhD Thesis, J. N. T. University, Hyderabad, 2004.
13. Raheman, H., Ghadege, S.V. Performance of compression ignition engine with mahua bio diesel. Fue, , 2007, 86, 2568-2573.
14. Banapurmath, N.R., Tewari, P.G., Hosmath, R.S. Performance and emission characteristics of direct injection compression ignition engine operated on honge, jatropha and sesame oil methyl ester. Journal of Renewable energy, 2008, 33, 1982-1988.
15. Murat, K., Gokhan, Ergen. and Murat, H. The effects of preheated cottonseed oil methyl ester on the performance and exhaust emissions of a diesel engine. Applied Thermal Engineering, 2008, 28, 2136-2143.
16. Jayant Singh, Mishra, T.N., Bhattacharya, T.K. and Singh, M.P. Emission characteristics of methyl ester of rice bran oil as fuel in compression ignition engine. International Journal of Chemical and Biological Engineering, 2008, 1(2). 62-66.
17. Rasim, B. (Performance and emission study of waste anchovy fish biodiesel in a diesel engine. Fuel Processing Technology, 2011, 92, 1187-1194.
18. Jaichandar, S. and Annamalai, K. The status of biodiesel as an alternative fuel for diesel engine- An Overview, Journal of Sustainable Energy & Environment, 2011, 2, 71-75.
19. Parlak, A., Yasar, H., ldogan O. The effect of thermal barrier coating on a turbocharged Diesel engine performance and exergy potential of the exhaust gas. Energy Conversion and Management, 2005, 46(3), 489– 499.
20. Ekrem, B., Tahsin, E., Muhammet, C. Effects of thermal barrier coating on gas emissions and performance of a LHR engine with different injection timings and valve adjustments. Journal of Energy Conversion and Management, 2006, 47, 1298-1310.
21. Ciniviz, M., Hasimoglu, C., Sahin, F., Salman, M. S. Impact of thermal barrier coating application on the performance and emissions of a turbocharged diesel engine. Proceedings of The Institution of Mechanical Engineers Part D-Journal Of Automobile Engineering, 2008, 222 (D12), 2447–2455.
22. Parker, D.A. and Dennison, G.M. The development of an air gap insulated piston. 1987, SAE Paper No. 870652. 23. Rama Mohan, K., Vara Prasad, C.M., Murali Krishna, M.V.S. Performance of a low heat rejection diesel engine
with air gap insulated piston, ASME Journal of Engineering for Gas Turbines and Power, 1999, 121(3), 530-540.
24. Karthikeyan, S., Arunachalam, M., Srinivasan Rao, P. and Gopala Krishanan, K.V. Performance of an alcohol, diesel oil dual-fuel engine with insulated engine parts”, Proceedings of 9th National Conference of I.C. Engines and Combustion, 1985, 19-22, Indian Institute of Petroleum, Dehradun.
26. Jabez Dhinagar, S., Nagalingam, B. and Gopala Krishnan, K.V. (1993). A comparative study of the performance of a low heat rejection engine with four different levels of insulation. Proceedings of IV International Conference on Small Engines and Fuels, Chang Mai, Thailand, 1993, 121-126,..
27. Krishna Murthy, P.V. Studies on biodiesel with low heat rejection diesel engine. PhD Thesis, J. N. T. University, Hyderabad, 2010.