Page 306 www.ijiras.com | Email: contact@ijiras.com
Geoenvironmental Assessment Of Pegmatite Mining Site Around
Komu In The Basement Complex, Southwestern Nigeria
Odebunmi Adegbola. O.
Department of Geological Services, Ogun State Ministry of Commerce and Industry,
Oke-Mosan, Abeokuta
I. INTRODUCTION
Mineral resources are important source of wealth for a nation including Nigeria but before they are harnessed, they have to pass through the stages of exploration, mining and processing (Adekoya, 2003; Ajakaiye, 1985). In recent years, there have been concerns about significant environmental problems caused by the mining of rare and major metals and metallurgical activities in African countries by domestic and foreign corporations (Oelofse, 2008).
The mobility and bioavailability of these trace elements in the environment greatly depend on some physical-chemical characteristics of the environment such as pH, textural characteristics, organic matter content, speciation or chemical form and Ec. There was a reawakening in the monitoring of
trace metal concentration in mining districts in Nigeria following the Lead (Pb) poisoning in Zamfara state which occurred in 2010. For, such incidence was the first of its kind in Nigeria’s environmental history (www.google.com). Therefore geochemical studies of the mining site using sample media like; soil, stream sediment and water is very important in determining the distribution pattern of trace elements present and the level of contamination effect on the immediate environment by the mining activities.
Abuja Leather mining activities operation have began for over 15years ago which lies within the coordinates longitude 08o 15' to 08o 18'N and latitude 002o 58' to 003o 03'E cover an area extent of 85 square kilometer and it is known for mining of tantalite, tin, niobium, gemstones etc, from mineralized pegmatite veins. This exercise is thus intended to access the
Abstract: Abuja Leather is the oldest mining site in Komu southwestern Nigeria which lies within the basement complex terrain and is known for gem mineralization hosted in mineralized pegmatite veins.
This study is aimed at determining the level of environmental degradation as well as the trace elements concentration in soil, stream sediments and surface water with a view of evaluating the environmental impact of the mining operation.
Fifty samples (5 rocks, 25 soils, 10 stream sediments and 10 surface water samples) were collected from the study area. The physico-chemical parameters were determined and analysed analyzed using ICP-MS.
The pH for the soil sample ranges from (6.1 to 7.19); Electrical conductivity ranges (21.3 to 279.4µS/cm), TDS (16.0 to 209.6mg/L), moisture content varies from (0.60 to 7.20%) and the LOI varies from (2.03 to 18.62%).
The results of analysis showed the concentrations of the trace elements in the soils and stream sediments samples are slightly higher than the background levels. Plots of the trace elements in stream sediments samples show moderate consistent decrease downstream except at point 6 to 8 where there was mine water discharge into the main river. Geo-accumulation index and contamination index for soils and stream sediment reveals uncontaminated to moderate contamination. The elements with moderate contamination are Cr, Ni and Sr.
Most of the trace elements in the water samples are below detection limit and some occurred in ppb. Water samples result pose no threat to aquatic or human community when compared to USEPA and WHO standard.
Page 307 www.ijiras.com | Email: contact@ijiras.com geochemical concentration of some trace elements in stream
sediment, soil and surface water within the immediate environment as a result of the mining activities.
II. MATERIALS AND METHODS
The study involves systematic geological and geochemical mapping on a scale of 1: 50,000. Five (5) rock samples in total which comprises of three (3) pegmatite, one granite Gneiss and granite were cross examined and subjected to whole rock analysis.
24 soil samples were carefully collected at depth 1-15cm and at interval of 100m along traverse lines in four cardinal directions with reference to the mining site. With this spread, a total of six (6) samples of appreciable weight were obtained in each direction and stored in clean polythene bags. One control sample was taken at almost 3kilometers away from the mining site.
Ten (10) samples of stream sediments and water samples respectively were collected along river Oyan. The stream sediments and the water samples were taken at the same point of collection. The sediments were collected by hand scooping and stored in clean labeled polythene bags while water samples were stored in a clean labeled bottle which was rinsed with the water sample before the final water sample was collected, sieved and acidified with few drops of concentrated HNO3 acid.
The already air- dried soil samples and stream sediment samples were sieved through a series mesh sizes to obtain <0.075mm fraction to remove roots, coarse materials, stones, other unwanted debris and get the clay sized fraction for geochemical analysis. The choice of this clay fraction is due to the fact that the fine sediment (clay/silt fractions) as a result of their net negative charges, do participate in cation exchange processes and this serve as a good metal accumulator.
All chemical analyses of the rocks, soils, stream sediments and surface water were carried out by a certified commercial laboratory in Canada (ACME Laboratory, Canada). ICP-AES (Soil and stream sediments analysis) and ICP-MS (Water analysis) analytical methods were employed.
III. RESULT AND DISCUSSION
PHYSICAL EFFECT OF MINING IN THE STUDY AREA
Open cast mining is practiced in the study area and the effects observed are;
AIR, LAND AND WATER POLLUTION
The air is laden with dust as a result of blasting and crushing of stones, it causes health hazards for some people. For example, some people are suffering from eye pain, and asthmatic attack due to the dust-laden air.
DAMAGE OF VEGETATION
Vegetation in form of natural forest and crop plantation is the first casualty to suffer total because they have to be removed for mine development and mining operations.
ECOLOGICAL DISTURBANCE
The noise generated in the course of blasting, quarrying and crushing also frighten away part of the fauna in a mining locality.
DEGRADATION OF NATURAL LANDSCAPE
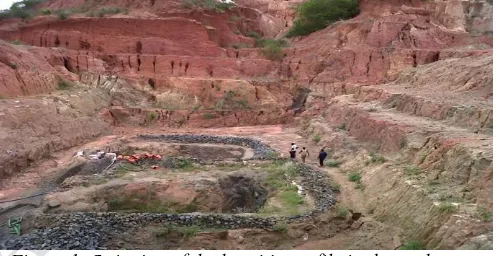
This is the most common negative effect of mining minerals from the study area as captured in figure (1) and leads to creating open space in the ground and generating heaps of rock wastes that cannot be easily disposed.
Figure 1: Stripping of the lateritic profile in the study area
FIELD CHARACTER AND PETROGRAPHY
The rocks found in the study area are the usual basement complex rocks which are Granite gneiss, Granite and Pegmatite.
The Granite gneiss is a metamorphic rock that displays subtle bands of mafic and felsic minerals. The outcrops are flat lying, sometimes poorly exposed and weathered; mesocratic and medium grained. Within this rock unit, there are various degrees of pegmatitic intrusion hosting valuable gem-stones at great depth. Joints were observed having different orientations in different direction. Quartzofeldspartic intrusions were observed with width ranging between 2cm to 8cm. Minerals in thin section include biotite, quartz, hornblende, microcline, plagioclase and accessory minerals.
The granite outcrops that are flat lying although some are fairly projected above the ground surface and were found at the western flank of the study area. Sample of the body are generally mesocratic and medium grained.
Page 308 www.ijiras.com | Email: contact@ijiras.com seen as greenish and flakes of tourmaline are present in most
outcrops.
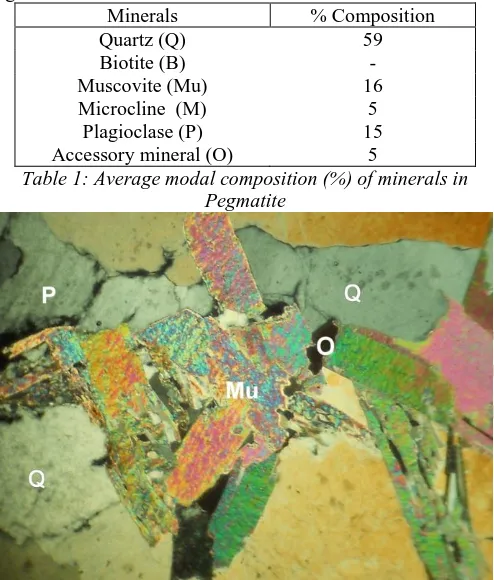
Microscopic studies of the pegmatite reveal a mineral assemblage of mainly microcline, quartz, plagioclase, and muscovite with accessory minerals.
Quartz was observed with a low positive relief; the quartz showed some intergrowth with feldspars and cleavage was absent quartz showed weak birefringence colours of the first order white category. The plagioclase feldspars, they showed the characteristic Carlsbad twinning under crossed polarized light. Muscovite has a perfect cleavage and showing 2nd and 3rd order interference colours. The modal analysis revealed quartz to be the dominant mineral, followed by microcline as presented in table 1 and the photomicrograph is displayed in figure 2
Minerals % Composition
Quartz (Q) 59
Biotite (B) -
Muscovite (Mu) 16
Microcline (M) 5
Plagioclase (P) 15
Accessory mineral (O) 5
Table 1: Average modal composition (%) of minerals in Pegmatite
Figure 2: Photomicrograph of pegmatite showing crystals of quartz (Q), Muscovite (Mu) and plagioclase (P) under crossed
nicol. Mag. X100
Figure 3: The Geological map of the study Area (Modified after Akintola et al, 2011)
THE PHYSICO-CHEMICAL PROPERTIES OF SOIL AND STREAM SEDIMENT SAMPLES
The colour of the top soil varies from location to location. Most of the soils are black while there are others with different colour variation such as grey, reddish brown, light brown and dark brown. The variation in colour of the soils maybe attributed to the decaying of leaves and inorganic matters.
The soil pH plays a significant role in the mobility of metals and availability of metals to plants. Low soil pH values often significantly increase metal mobility while High soil pH values decreases the mobility of metals. The pH values for the soil ranges from 6.1 to 7.19 and this indicates that the soils are slightly acidic to slightly alkaline. The pH values of the stream sediment were measured in-situ and the values range from 7.0 to 7.8. This suggests that they are slightly alkaline.
Parameter Range of values
EC in soil (µs/cm) 21.3 - 279.4
TDS (soil) 16.0 - 209.6
pH (soil) 6.1 - 7.19
EC (stream sediment) 150.2 – 324.4 TDS( stream sediment) 112.7 – 243.3
pH(stream sediment) 7.0 - 7.8
Table 2: The summary of physico-chemical parameters
IV. Results of Geochemical Analysis
BEDROCK GEOCHEMISTRY
The result of the major oxides in the analyzed rock samples is presented in table 3 from which it was deduced that the concentrations of Na2O exceed that of K2O except in granite gneiss where K2O has 5.77 and Na2O has 2.6. The ratio of Na2O to K2O varies from one rock to the other with sodium dominating in the pegmatite samples. The trace and rare earth element concentrations show some appreciable variations, which to some extent reflect variations in their major oxides concentrations. Most of all the trace elements have their concentration highest in the granite gneiss with exception of some. In the Pegmatite, the silica content of this rock is above 71% of the total sample analyzed. Al2O3 values are far higher than Fe2O3 in all the samples analyzed while Na2O values exceed that of K2O. The concentrations of MgO, MnO2, TiO2 and P2O5 show slight variation. In Granite, the silica content of this rock is 58.08%. Slight variation is noticed in the concentrations of Al2O3 and Fe2O3 unlike in the pegmatite samples where Al2O3 far exceeded the Fe2O3 values. The concentrations of Pb, Sr, Zr Th and Ba were relatively high in this rock type (Table 3) while Granite Gneiss has its silica content to be 58.63% almost the same as the granite. This rock type is enriched in Al2O3; slightly enriched in Fe2O3, K2O and CaO but deficient in Na2O. The ratio of K2O to Na2O in this rock is almost two which is an indication that the rock is more enriched in K-feldspar.
Pegmatite 1
Pegmatite 2
Pegmatite
3 Granite
Granite gneiss
SiO2 (%) 71.69 71.37 71.51 58.08 58.63
Al2O3 (%) 17.14 17.07 17.14 12.62 14.07
Fe2O3 (%) 0.46 0.78 0.64 10.51 5.63
Page 309 www.ijiras.com | Email: contact@ijiras.com
CaO (%) 1.1 0.8 0.83 7.61 5.21
Na2O (%) 7.88 6.02 6.19 2.14 2.6
K2O (%) 0.57 2.94 2.88 1.25 5.77
TiO2 (%) 0.01 0.04 0.03 1.38 1.01
P2O5 (%) 0.04 0.06 0.03 0.28 0.36
MnO (%) <0.01 0.03 0.02 0.52 0.09
LOI (%) 1.1 0.7 0.6 1.1 1.5
Table 3: Major oxides in rock samples
Sample Pegmatite1
Pegmatite 2
Pegmatite
3 Granite
Granite gneiss
Ba (ppm) 21 7 8 247 1195
Be (ppm) 6 6 5 23 4
Co (ppm) 0.3 <0.2 0.2 42.8 18.2
Cs (ppm) 10.3 108.1 75.9 47.1 15.6
Nb (ppm) 33.2 47.2 39.9 14.4 38.6
Rb (ppm) 53.5 284.8 248.1 213.7 230.5
Sn (ppm) 15 20 16 11 15
Sr (ppm) 18.7 9.4 9.3 248.6 642.8
Ta (ppm) 49.5 28.9 23.9 11.9 23.7
Th (ppm) 19.4 37.1 27 3.7 51.5
V (ppm) <8 <8 <8 193 80
Zr (ppm) 2.2 34 18.6 109.9 394.9
Y (ppm) 27.6 105 55.9 58 23.2
La (ppm) 5.9 7.1 12.9 13.3 82.8
Ce (ppm) 12.4 18.1 31.4 37.8 157.6
Mo (ppm) 0.1 <0.1 <0.1 <0.1 2.7
Cu (ppm) 4.2 2.1 2.3 6.6 12.1
Pb (ppm) 4.4 2.4 1.6 1.1 24.2
Zn (ppm) <1 3 3 37 40
Ni (ppm) 0.9 0.2 0.3 46.4 59.7
Table 4: Trace element concentrations in rock samples from the study area
Elements Minimum Maximum Average Standard deviation
Fe 2.84 6.25 4.46 0.92
Ca 0.16 2.76 1.28 0.68
Mg 0.10 1.31 0.65 0.36
Na 0.12 1.92 1.07 0.50
K 0.53 2.27 1.36 0.52
Al 2.06 9.51 7.18 1.58
P 0.01 0.11 0.04 0.02
Ti 0.57 2.62 1.30 0.43
Table 5: Concentrations of major elements in the top soils
Elements Minimum Maximum Average
Standard deviation
Fe 4.43 6.54 5.28 0.64
Ca 1.5 2.3 1.85 0.22
Mg 0.67 0.96 0.81 0.07
Na 1.15 1.56 1.40 0.13
K 1.49 2.04 1.68 0.18
Al 5.62 7.24 6.33 0.55
P 0.055 0.114 0.07 0.02
Ti 1.21 3.64 2.05 0.78
Table 6: Concentrations of major elements for the stream sediments
GEOCHEMICAL ANALYSIS RESULTS FOR TRACE ELEMENTS IN THE TOP SOILS
A total of 25 samples were analyzed, for their metal contents. These metals include Cu, Pb, Mo, Zn, Ag, Ni, Co, Mn, As, U, Au, Th, Sr, Cd, Sb, Bi, Zr, V, La, Cr, Ba, B, Y, Nb, Be, Fe, and W.
The results of Mo, Ag, U, Au, Sb, Bi, S, Sn and W were found to be below detection limits in most of the samples analyzed, hence were screened out. The concentration of the
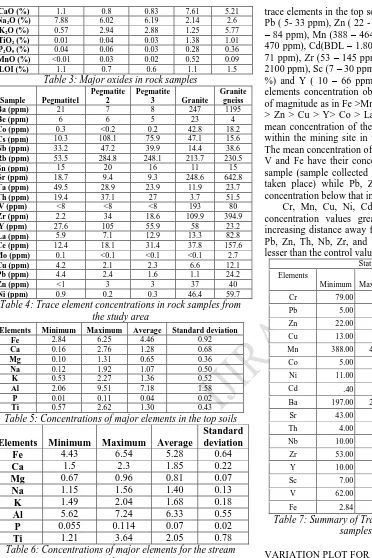
trace elements in the top soils ranges from: Cu (13 – 93 ppm), Pb ( 5- 33 ppm), Zn ( 22 - 75 ppm), Ni ( 11- 101 ppm) , Co (5 – 84 ppm), Mn (388 – 4647 ppm ), Th( 4– 31 ppm), Sr( 43 – 470 ppm), Cd(BDL – 1.80 ppm), V (62 – 176 ppm), La (22 – 71 ppm), Zr (53 – 145 ppm), Cr ( 79 – 226 ppm), Ba ( 197 – 2100 ppm), Sc (7 – 30 ppm), Nb (10 -53ppm), Fe ( 2.84 – 6.25 %) and Y ( 10 – 66 ppm). The average results of the trace elements concentration observed, showed a decreasing order of magnitude as in Fe >Mn > Ba > Sr > V > Cr > Zr > Ni > V > Zn > Cu > Y> Co > La > Nb > Th > Sc > Pb > Cd. The mean concentration of the trace elements in the soil samples within the mining site in the study area is shown in table 5. The mean concentration of Cr, Cu, Mn, Co, Ni, Cd, Ba, Sr, Sc, V and Fe have their concentration exceed that in the control sample (sample collected where there is no mining activities taken place) while Pb, Zn, Th, Nb, Zr and Y have their concentration below that in the control sample.
Cr, Mn, Cu, Ni, Cd, Sr, Sc, and Fe have the mean concentration values greater than the control value with increasing distance away from the point source (mining site). Pb, Zn, Th, Nb, Zr, and Y have mean concentration values lesser than the control values.
Statistical parameter Elements
Minimum Maximum Mean
Background value
Std. Deviation
Cr 79.00 226.00 119.33 46 39.41
Pb 5.00 33.00 15.65 19 6.64
Zn 22.00 75.00 41.33 72 13.23
Cu 13.00 93.00 37.46 29 16.84
Mn 388.00 4647.00 1458.7 1276 824.74
Co 5.00 84.00 26.54 18 15.59
Ni 11.00 101.00 48.83 24 22.04
Cd .40 1.80 .84 0.8 .32
Ba 197.00 2100.00 640.29 573 387.02
Sr 43.00 470.00 242.42 63 110.19
Th 4.00 31.00 16.92 21 6.72
Nb 10.00 53.00 30.00 125 8.52
Zr 53.00 145.00 99.96 409 23.92
Y 10.00 66.00 26.58 33 11.10
Sc 7.00 30.00 16.04 13 5.10
V 62.00 176.00 120.38 86 24.28
Fe 2.84 6.25 4.46 4.06 .92
Table 7: Summary of Trace elemental compositions of soil samples in the study area
VARIATION PLOT FOR TOP SOILS
Variation plot is the concentration-distance plot of elements obtained in the soils. Its gives the dispersion pattern of each element as it moves for a certain distance along the sampling profile. In order to evaluate the effect of the mining site on the environment, trace elements concentration ought to reduce away from the point source (the mining site). Some of the trace elements show this trend while some show haphazard concentration levels in different directions.
Page 310 www.ijiras.com | Email: contact@ijiras.com increase at 200m but falls afterward. The increase observed at
200m is not as high as the one observed at the first sampling point which still point out that there is an effect of the mine in this direction. Sr shows initial low concentration but the chemical signature follow the normal trend as it decrease from the second sampling point to the last.
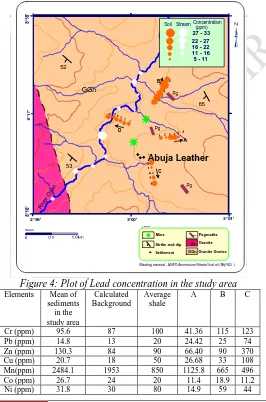
In the northern part relative to the mine, Cr, Co, Ba and Sr shows erratic variation in their concentrations while Pb, Ni, Zn, and V have their respective concentration highest at 400m away from the mining site. The effect of this mining site is not obvious in this direction as haphazard signature was observed. Plot of Lead concentration in the study area is presented in figure (4)
At the southern part, the dispersion of elements follow the normal expected trend i.e decreases away from the point source (mining site) although, there are minor variations along the sampling profile. Sr displays slight deviation from the normal dispersion trend by slightly increasing from the first sampling site till 400m and decrease afterwards.
The western part shows similar trend as observed in the south but elements like Zn, Cu, Co and Ba; have concentration highest between 300 and 400m away from the point source and later shows decrease at 500m.
Since the area is known for mineralization, the haphazard variation in concentration of elements might be as a result of suspected local enrichment.
950 900 850 900 850 800 930 Abuja Leather Old Park Agate Camp 8 °1 5 ' 3°03' Pg Pg Pg Pg Pg Gr Gr Gr Gr 50 38 60 65 65 52 53 48 GGn GGn GGn GGn B D C A
2°59' 3°00' 3°01'
8 °1 6 ' 8 °1 8 ' 2 3 4 5 6 Mine Granite Gneiss Granite Pg
Strike and dip
Pegmatite
Blasting material - ANFO Ammonium Nitrate/ fuel oil (NH NO )
Settlement Legend
Gr
GGn 5 - 11 11 - 16 16 - 22 22 - 27 27 - 33
Soil StreamConcentration (ppm)
Figure 4: Plot of Lead concentration in the study area
Elements Mean of
sediments in the study area Calculated Background Average shale
A B C
Cr (ppm) 95.6 87 100 41.36 115 123
Pb (ppm) 14.8 13 20 24.42 25 74
Zn (ppm) 130.3 84 90 66.40 90 370
Cu (ppm) 20.7 18 50 26.68 33 108
Mn(ppm) 2484.1 1953 850 1125.8 665 496
Co (ppm) 26.7 24 20 11.4 18.9 11.2
Ni (ppm) 31.8 30 80 14.9 59 44
Cd (ppm) 1.5 1.2 0.50 - - -
Ba (ppm) 679.1 625 3
Sr (ppm) 232.3 217 400
Th (ppm) 28.7 24 12
Nb(ppm) 54.5 42 --
Zr (ppm) 146.1 115 --
Y (ppm) 27.6 24 --
V (ppm) 148.6 140 130
Sc (ppm) 13.7 13 --
Fe (%) 5.3 4.58 4.6 4.51 4.55 2.37
A: Stream sediments in around Itakpe iron mining site (Okunlola et al, 2006)
B: Freshly deposited sediments of Gomati River (Singh et al, 1997)
C: Freshly deposited Neckar River sediments (Muller et al, 1993)
Table 8: Comparison of some trace element concentrations (ppm) in stream sediments with average shale, calculated background and other comparable freshly deposited sediments
STATISTICAL TREATMENT OF GEOCHEMICAL DATA
Statistical methods have been widely applied to interpret geochemical data sets and define geochemical associations hence such methods need to be used cautiously because of the particular characteristics of geochemical data which seldom represent a single population or distribution because the data are typically spatially dependent and at each sample site a range of different processes have influenced the element abundance measured. Several elements are determined during geochemical exploration and the concentrations and distributions are studied through maps, graphs and statistics to identify anomalies in the environment.
FACTOR ANALYSIS
The aim factor analysis is to represent a large number of variables in the original data by a significant smaller number of ‘factors’each of which is a linear function of the original variables. As a result, a small number of factors will usually account for approximately the same amount of information as do the much larger set of original variables.
The principal component analysis for soil revealed a five (5) factor model as presented in table 4.18 but the fifth factor was not considered because of the values generated.
FACTOR 1: This factor consists of the following metals
Zn, Cu, Mn, Co, Ni, Y, Sc, V, Fe and it accounts for 33.68% of the variance. Zn, Co, Ni, V and Fe are siderophilic (having strong affinity for metallic phase and usually depleted in the silicate portion of the earth) and are well correlated with one another.
FACTOR 2: This factor consists of the following metals
Pb, Th, Zr and accounts for 16.08% of the total variance. Pb shows weak correlation with the other elements and thus can be inferred that they are anthropogenic influenced.
FACTOR 3: Sr it account for 14.25% variance and Sr is
poorly correlated with other elements. It may have been formed by adsorption of the metal by its oxide in the topsoil.
FACTOR 4: Cr and Cd account for 11.21% of the total
Page 311 www.ijiras.com | Email: contact@ijiras.com into the mining environment. Cd is poorly correlated with
other element.
The principal component analysis for stream sediments revealed a 4 factor model as shown in table 4.19.
FACTOR 1: Cr, Cd, Th, Nb, Zr, Y, Sc, V and Fe. They
account for 49.35% of the total variance. They show strong to moderate correlation with one another and this indicates they are from the same source.
FACTOR 2: Cr, Pb, Zn, Cu, Ni, Cd and Sr. They account
for 24.57% of the total variance. They are mostly chalcophile and they have affinity for sulphide phase.
FACTOR 3: Mn and Co. They account for 10.84% of the
total variance and the two elements show weak correlation. They are of anthropogenic origin.
FACTOR 4: Sr accounts for 6.35% of the total variance
and Sr is poorly correlated with other elements but shows moderate correlation with Pb, Zn and Ba.
The principal component analysis for surface water revealed 2 factor models as presented in table 4.20.
FACTOR 1: Cr, Zn, Cu, Co, Ni, Th, V and Fe. They
account for 59.80%. These elements show strong and positive correlation with one another and these may be inferred that they of the same source.
FACTOR 2: Mn, Co, Ba, and Sr. They account for
24.25%. Mn and Ba show high correlation while Mn and Co show weak correlation. Mn and Ba may be from the same source while Co may be of anthropogenic origin.
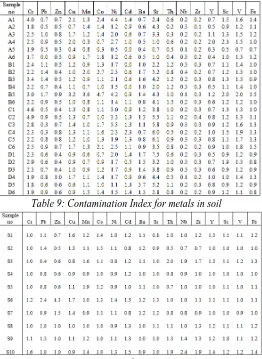
CONTAMINATION INDEX
The contamination index is obtained by comparing the observed heavy metal concentration with the control values for soil (calculated background value for stream sediment and water). This is an expression of the level of contamination of soil by metals is expressed by the formulae below;
Contamination Index = Cm / Bm
Where Cm and Bm is the concentration of the metal in the sample and background respectively.
Where the contamination factor CI values is less than 1.5, it indicates that the occurrence of metal is due to natural processes but where it is greater than 1.5, it suggests that it is due to anthropogenic sources (Zhang and Lui, 2002).
Table 9 and 10 show the values for contamination index for soil and stream sediments respectively. The values of contamination index of various trace elements in soil is summarized thus; Cr (1.7-4.9), Pb(0-1.7), Zn(0.3-1.0), Cu(0.4-2.1), Mn(0.3-3.2), Co(0.3-4.7), Ni(0.5-4.4), Cd(0-2.3), Ba(0.3-3.7), Sr(0.7-7.5), Th(0.2-1.2), Nb(0.1-0.4), Zr(0.1-0.4), Y(0.3-1.2), Sc(0.5-2.3), V(0.7-2.0), and Fe(0.7-1.5).
Values derived for Zn, Pb, Th, Nb, Zr, Y and Fe indicates that their mode of occurrence is due to natural processes i.e they are geogenic. Mn show some degree of antropogenic input at the northern part of the mining site. Cu has evidence of slight antropogenic input at some points in the east, south and north of the mining site but relatively free from such input at the south.
Cr, Ni, and Sr have their contamination index values greater above 1.5 as postulated by Zhang et al, 2002) and this suggests they are antropogenically contributed into the soil. Cr has its highest point of contamination at the second sampling
point in the southern part of the mine. Sr has its highest contamination value to be 7.5 at the first sampling point at the east of the mine.
Table 9: Contamination Index for metals in soil
Table 10: Contamination Index for metals in stream sediments
GEO-ACCUMULATION INDEX
This was introduced by Muller (1981) for determining the extent of metal accumulation in sediments. It is expressed as;
Igeo = Log 2 ((Cm)/(1.5 * Bm))
Where Cm is the concentration of metals at the study area And Bm is the concentration of the same metal at the control site
1.5 is factor for possible variation in the background concentration due to lithological variation.
Classes Ranges Indications/Soil quality 0 Igeo<0 Practically Uncontaminated 1 0<Igeo<1 Uncontaminated to moderately
contaminated 2 1<Igeo<2 Moderately contaminated 3 2<Igeo<3 Moderately to heavy
contaminated 4 3<Igeo<4 Heavily contaminated 5 4<Igeo<5 Heavily to extremely
contaminated 6 5<Igeo Extremely contaminated
Page 312 www.ijiras.com | Email: contact@ijiras.com Based on the calculated values and interpretation of
Geoaccumulation index (Igeo) with references to the seven grade classification (table 11) according to Muller (1981) shows that the soils are unpolluted for most of the elements except for Cr, Ni and Sr with moderate enrichment. Cr have values that falls to moderately contaminated class at the first and second sampling points towards the south of the mining site; it also shows moderate contamination at the first sampling point in the eastern part of the mine. Ni shows moderate contamination at the first sampling point in the eastern part of the mine while Sr shows moderate contamination in the at the second and third sampling points in the eastern part of the mining site while the north, south and west of the mining site show moderate to heavy contamination in soil.
The Geoaccumulation index (Igeo) for the quantification of trace elements accumulation in the stream sediments shown uncontaminated with virtually all of the sediment except Zn. However, Zn at a single location shows moderate contamination.
V. CONCLUSIONS
The study area is underlain by granite gneiss, granite and pegmatite (which occur as low lying intrusions into the grante gneiss). The granite gneiss predominate the study area and are mainly composed of quartz, feldspars and biotite.
The environmental degradation resulting from the mining operation as observed are: minimal water pollution; damage of vegetation, ecological disturbance and degradation of natural landscape.
The pH values for the soil indicate they are slightly acidic to slightly alkaline while the stream sediments are slightly alkaline. Their Ec and TDS values indicate their varying distribution pattern from one sample point to another.
The study reveals that the soil is moderately contaminated with Cr, Ni and Sr and may have been antropogenically introduced into the soil. The variation plots of concentration of elements in soils show fairly consistent decrease away from the mining site in the East, West and South while in the North, there was haphazard signature. The stream sediments showed elevated concentration of Zn when compared to the control background value and can be described as moderately contaminated. Geo-accumulation index and contamination index for soils and stream sediment reveals uncontaminated to moderate contamination. The trace elements concentration in the surface water are in agreement with those of the mean composition of the World rivers (MCWR) (Hem, 1985) and also are well below the maximum permissible levels (MPLs) recommended by United States Environmental protection Agency (USEPA, 1999) and the World Health Organization (WHO, 1993). Generally, however, the study reveals that the concentration of the trace metals in the media decrease away from the source point except where there are anomalous concentration which may be as a result of local enrichment.
The study has provided background information for vulnerability assessment of the sampled area as well as for future investigation and proper planning of a mining site. Effort should be made to curb the discharge of water from the
mine into the river. Caution and restriction signs should be mounted around the mine environment to serve as warning to people (strangers and cattle keepers) in order to prevent accident.
Finally, there is need for implementation and enforcement of environmental law which may just be a means of pollution control within mining districts.
ACKNOWLEDGEMENTS
I am greatly indebted to God, my dear wife Omobolaji Oluwatosin Odebunmi for her love, care, moral support and encouragement and also to my parents, Prince and Princess. A.O Odebunmi and my siblings for their financial support at all times, may God bless my family.
REFERENCES
[1] ADEKOYA J.A 2003. Environmental Effect of Solid Minerals Mining. J. Phys. Sci. Kenya. pp.625–640. [2] AJAKAIYE D.E. 1985. Environmental Problems
associated with Mineral Exploitation in Nigeria. A Paper Presented at the 21st Annual Conference of the Nigeria Mining and Geosciences Society held at Jos: pp. 140–148. [3] AKINTOLA, A.I ; IKHANE, P.R ; LANIYAN, T.A ; AKINTOLA, G.O ; KEHINDE-PHILLIPS, O.O AND OJAJUNI, P.O. 2012. Compositional trends and rare- metal (Ta-Nb) Mineralization Potential of precambrian pegmatites in Komu area, southwestern Nigeria. Journal of current research vol 4, issue 02, pp. 031-039.
[4] HEM J. D, 1985. Study and Interpretation of the chemical characteristics of natural water. Water chemistry textbook, 3rd Edition, pp 263.
[5] MULLER G, YAHYA A., AND GENTNER P., 1993. Die Schwermetallbelastung der sedimente des Nectars und seiner zuflusse : Bestandsaufuahme 1990 und vergleich mit fruheren untersuchungen. Heidelberger Geowissenschaftliche, Abhandlungen 69, 1-91.
[6] MULLER, G. 1981. Die Schwermetallibelasting der Sedimenten des Neckers undseiner Nebenflusse. Chemiker-Zeitung 6, pp157-164.
[7] OKUNLOLA A.A. AND OLAPERI S., 2006. Geo environmental assessment of surface water and stream sediments in area around the Iron ore mining site of Itakpe, Okene, Central Nigeria. Journal of the scientific society of the mineral wealth technologists, pp. 27 – 36. [8] RAZO I, CARRIZALES L, CASTRO J, BARRIGA DF,
MONROY M 2004. Arsenic and heavy metal pollution of soil, water and sediments in a semi-arid climate mining area in Mexico. Water Air Soil Pollut., 152: 129-152. [9] RUBIO, B., NOMBELA, M.A., AND VILAS, F. 2000.
Geochemistry of major and trace elements in sediments of Ria de Vigo (NW Spain) an assessment of metal pollution, marine pollution Bulletin, 40(11), 968-980. [10] SINGH M., ANSARI A.A, MULLER G., SINGH I.B.
Page 313 www.ijiras.com | Email: contact@ijiras.com [11] TENG, Y., NI, S. AND WANG J. 2008. Geochemical
baselines of trace elements in the sediment in Dexing area, South China. Environmental Geology, vol.
[12] USEPA (1999). Integrated Risk information system (IRIS). National center for environmental assessment, Office of research and Development, Washington, DC. [13] VON BRAUN C. M, VON LINDERN H. I,
KHRISTOFOROVA K. N, KACHUR H. A,
YELPATYEVSKY V. P, ELPATYEVSKAYA P. V, SPALINGER M.S 2002. Environmental lead contamination in the Rundnaya Pristan – Dalnegorsk mining and smelter district, Russian Far East. Environ. Res., Section A, 88: 164-173.
[14] WARD, N. I., REEVES, R. D., BROOKS, R. R. 1975. Lead in soil and vegetation along a New Zealand state highway with low traffic volume. Environ. Pollut. 9: 243 – 251.
[15] WORLD HEALTH ORGANIZATION (WHO) 1993. Guideline for drinking water quality. Recommendations, Geneva, Switzerland.
[16] Pollution in agricultural lands and potential health risk related to intensive mining activities: A case study in Chenzhou City, China. J. Environ. Sci., 20: 696-703. www.google.com
[17] ZHAI, M., KAMPANZU, H.A.B., MODISI, M.P., AND TOLOTO, O. 2003. Distributions of heavy metals in urban soils [Botswana] and its relationship to pollution and bedrock composition. Environmental Geology, vol.45, pp 171-180.