N
S
Available online at: www.ijcncs.org ISSN 2308-9830
Use of Decision Trees and Attributional Rules in Incremental
Learning of an Intrusion Detection Model
Abdurrahman A. Nasr1, Mohamed M. Ezz2, Mohamed Z. Abdulmageed3
1
Assistant lecturer, Al-Azhar University, Cairo, Egypt, Faculty of Engineering, Systems and Com. Dept. 2
Assistant professor, Al-Azhar University, Cairo, Egypt, Faculty of Engineering, Systems and Com. Dept. 3
Professor emeritus, Al-Azhar University, Cairo, Egypt, Faculty of Engineering, Systems and Com. Dept.
E-mail: [email protected], [email protected], [email protected]
ABSTRACT
Current intrusion detection systems are mostly based on typical data mining techniques. The growing prevalence of new network attacks represents a well-known problem which can impact the availability, confidentiality, and integrity of critical information for both individuals and enterprises. In this paper, we propose a Learnable Model for Anomaly Detection (LMAD), as an ensemble real-time intrusion detection model using incremental supervised machine learning techniques. Such techniques are utilized to detect new attacks. The proposed model is based on making use of two different machine learning techniques, namely, decision trees and attributional rules classifiers. These classifiers comprise an ensemble that provides bagging for decision making. Our experimental results showed that, the model automatically learns new rules from continuous network stream, such that it can efficiently discriminate between anomaly and normal connections, offering the advantage of being deployed on any environment. The model is intensively tested online and its evaluation showed promising results.
Keywords: Decision Trees, AQ, Incremental Classifier, Ensemble, Intrusion Detection.
1 INTRODUCTION
Incremental learning addresses the ability of repeatedly training a network by using new data without destroying old prototype patterns. The fundamental issue for incremental learning in intrusion detection systems (IDS) is how IDS can adapt itself to detect new attacks without getting corrupted or forgetting previously learned information: the so-called stability-plasticity dilemma [1]. IDS is one of the most essential component for security infrastructures in network environments, and it is widely used in detecting, identifying and tracking the intruders [2]. With the increasing and diversified types of novel network attacks, intrusion detection systems need to cope with non-stationary changing situations in environment by employing adaptive mechanisms to accommodate changes in the data. This becomes more important when huge stream of data arrives continuously and over long periods of time. In such situations, the system should adapt itself to the new
data samples which may convey a changing situation and at the same time should keep in memory relevant information that had been learned in the remote past [3]. Two main directions dominate the intrusion detection field; misuse detection and Anomaly detection [4]. The misuse detection is characterized by precision and accurateness. But it covers only the known attacks, while the anomaly based detection utilizes different data mining techniques for identifying anomaly from normal patterns. The result is promising in detecting new attacks but it generates a high rate of false alerts.
Artificial neural network[6], decision trees[7], Bayesian network[8] and many others[9]. A comprehensive review about machine learning algorithms in intrusion detection can be found in [9, 10]. These anomaly based IDS models are endowed with a generalization capacity that covers new unknown attacks patterns, nevertheless, the generalization power reaches its limit through time because of new emerging attack methods which represents a significant concept drift from already learned concepts. The permanent coverage of new attack patterns remains unreachable goal for the existing IDSs which become notably inefficient through time [3]. Hence To keep IDS learnt with novel attacks patterns, the IDS must adapt itself to every change in its target environment. The adaptability is the beginning of new generation of learning IDSs, called adaptive IDSs, which constitutes a qualitative jump in intrusion detection in terms of performance, efficiency and sustainability. The rest of this paper is organized as follows: Section 2 highlights related work about current IDSs and their limitations. Section 3 describes our learnable model for anomaly detection (LMAD). Section 4 presents an illustrative example on the proposed model. Section 5 presents the experimental results and evaluation process of the model. Section 6 summarizes the proposed model.
2 RELATED WORK
Many data mining algorithms have been applied to intrusion detection, which can be divided into typical offline algorithms and incremental online algorithms. Most researchers have concentrated on off-line intrusion detection using a well-known KDD99 benchmark dataset to verify their IDS development. The KDD99 [11] dataset is a statistically preprocessed dataset which has been available from DARPA since 1999[12]. In 1990, Hansen et al. [13] showed that the combination of several artificial neural networks can drastically improve the accuracy of the predictions. The same year, Schapire showed theoretically that if weak classifiers are combined, it is possible to obtain an arbitrary high accuracy [14]. Abraham et al. [15] proposed an ensemble composed of different types of artificial neural networks (ANN), support vector machines (SVM) with radial basis function kernel, and multivariate adaptive regression splines (MARS) combined using bagging techniques was compared to the results obtained by each algorithm executed separately. Five years later, Abraham et
al. [16] explored the combination of classification and regression trees (CART) and Bayesian networks (BN) in an ensemble using bagging techniques, as well as the performance of the two algorithms when executed alone. Syed et al. [17] proposed the incremental SVM. Zhang et al. [18] extended the traditional SVM, Robust SVM and one-class SVM to be of online forms. Baowen et al. [19] proposed an incremental algorithm for mining association rules. The algorithm considers not only adding new data into the knowledge base but also reducing old data from the knowledge base. Shafi et al. [20] proposed an Adaptive Rule based Intrusion Detection Architecture, which integrates a signature rules base with a Learning Classifier System (LCS) to produce interpretable rules. It allows learning new attack and normal behavior patterns by interacting with a security expert. Labib et al. [21] developed a real-time IDS using Self Organizing Maps (SOM) to detect normal network activity and DoS attack. They preprocessed their dataset to have 10 features for each data record. Each record contained information of 50 packets. Their IDS was evaluated by human visualization for different characteristics of normal data and DoS attack, but no detection rate was reported. Khreich et al. [22] proposed a system based on the receiver operating characteristic (ROC) to efficiently adapt ensembles of HMMs (EoHMMs) in response to new data, according to a learn-and combine approach. The proposed system is capable of changing the desired operating point during operations, and those points can be adjusted to changes in prior probabilities and costs of errors. Alexander et al. [23] proposed an ensemble approach of four decision trees and feature selection algorithms, trained on different sets of features, to detect the four attack types in KDD’99 dataset. The main idea is to exploit the strengths of each algorithm of the ensemble to obtain a robust classifier. For a summary of most research involving machine learning applied to IDSs, see [24, 25].
3 PROPOSED MODEL
Our model focuses on means of approaches that promote adaptability by automatic incremental learning ability when interacting with a dynamic changing environment, so we are oriented toward two types of incremental classifiers, namely, Decision trees (Hoeffding Tree) [26] and Algorithm Quasi-Optimal (AQ) [27][28]. These two machine learning approaches are actually suggested based on intensive research to build adaptive learning intelligent systems in a dynamic changing environment.
Figs [1, 2] give an overview of the proposed model (LMAD). It consists of two phases, that is, Offline training phase and incremental online testing phase. In the next subsections, we will explain in details the components of the (LMAD) model.
3.1 Offline Phase
At the beginning, the offline phase is fed with network training data for training incremental classifiers. In this model, we use NSL-KDD [29] dataset for training. NSL-KDD is a dataset suggested to solve some of the inherent problems of the KDD'99 dataset which are mentioned in [30]. The 20% subset of the training dataset “KDDTrain+_20Percent“ [29] were used as it contains a reasonable number of network records.
The second step in this phase represents the feature extraction component. We build this component over the research done in [31] for extracting most valuable and relevant features (MVRF). The output of this step will produce new training dataset with 19 effective features.
Figure. 1. Offline phase for the proposed model
Figure 2. Incremental online phase for the proposed model
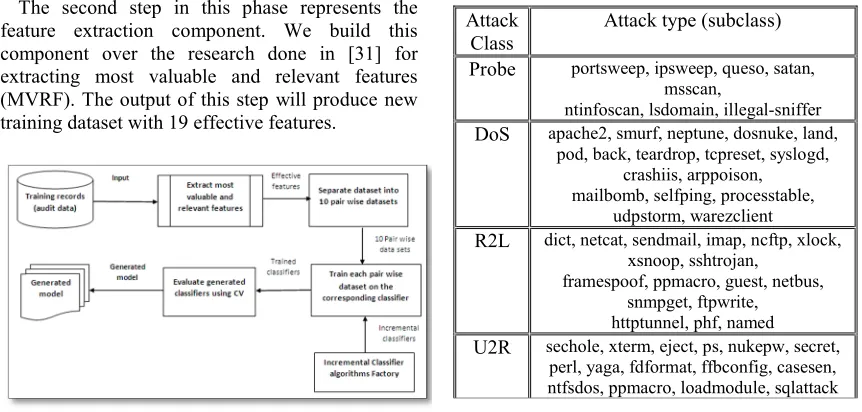
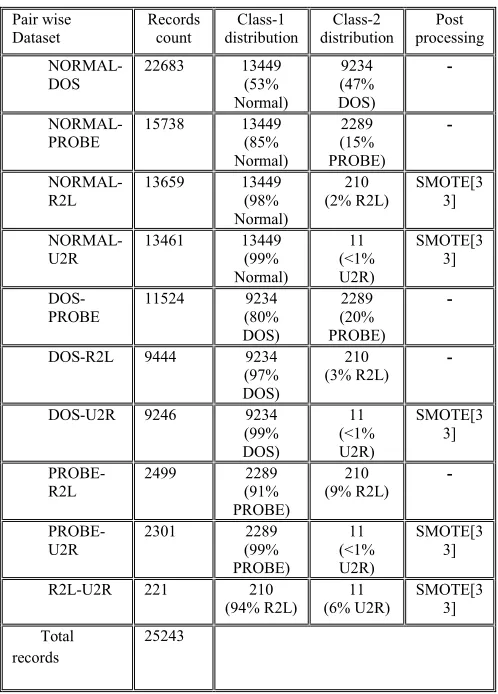
The third step is to produce pair wise datasets for 1-vs-1 model classification. This will produce 10 datasets containing 2 different classes in each dataset. Table [1] lists common attack classes in KDD’99 dataset [32], while Table [2] represents the statistics for each pair wise dataset; some pair wise datasets have been post processed to prevent bias toward dominant class and solve for imbalanced dataset. For example, all U2R records in all datasets have been increased in a reasonable fashion using synthetic minority oversampling technique (SMOTE)[33].
Table 1. Attacks presented in KDD’99 dataset
Attack Class
Attack type (subclass)
Probe portsweep, ipsweep, queso, satan, msscan,
ntinfoscan, lsdomain, illegal-sniffer DoS apache2, smurf, neptune, dosnuke, land,
pod, back, teardrop, tcpreset, syslogd, crashiis, arppoison, mailbomb, selfping, processtable,
udpstorm, warezclient
R2L dict, netcat, sendmail, imap, ncftp, xlock, xsnoop, sshtrojan,
framespoof, ppmacro, guest, netbus, snmpget, ftpwrite, httptunnel, phf, named U2R sechole, xterm, eject, ps, nukepw, secret,
Table 2. Pair wise datasets for 1-vs-1 classification Pair wise Dataset Records count Class-1 distribution Class-2 distribution Post processing NORMAL-DOS
22683 13449
(53% Normal) 9234 (47% DOS) - NORMAL-PROBE
15738 13449
(85% Normal) 2289 (15% PROBE) - NORMAL-R2L
13659 13449
(98% Normal) 210 (2% R2L) SMOTE[3 3] NORMAL-U2R
13461 13449
(99% Normal) 11 (<1% U2R) SMOTE[3 3] DOS-PROBE
11524 9234
(80% DOS) 2289 (20% PROBE)
-DOS-R2L 9444 9234
(97% DOS)
210 (3% R2L)
-DOS-U2R 9246 9234
(99% DOS) 11 (<1% U2R) SMOTE[3 3] PROBE-R2L
2499 2289
(91% PROBE) 210 (9% R2L) - PROBE-U2R
2301 2289
(99% PROBE) 11 (<1% U2R) SMOTE[3 3]
R2L-U2R 221 210
(94% R2L) 11 (6% U2R) SMOTE[3 3] Total records 25243
The fourth step is to train each pair wise dataset on incremental classification algorithm to produce 10 unique trained classifiers. In this model, we use two powerful incremental learning algorithms, namely Hoeffding trees [26], a variant of decision trees algorithm and AQ [27], a type of Attributional calculus rule induction algorithm. The output of this step will produce a total of 20 trained classifiers for the previously mentioned algorithms.
Hoeffding decision trees were introduced by Domingos and Hulten in [26]. They refer to their implementation as VFDT, an acronym for Very Fast Decision Tree learner. Decision trees are being studied because they represent current state-of-the-art for classifying high speed data streams. The algorithm fulfills the requirements necessary for coping with data streams while remaining efficient. The Decision tree induction algorithm induces a decision tree from a data stream incrementally, briefly inspecting each example in the stream only once, without need for storing examples after they have been used to update the tree internal information. Domingos and Hulten presented a proof based on Decision bound (a.k.a additive
Chernoff bound)[34] guaranteeing that a Hoeffding tree will be very close to a decision tree learned via batch learning. They showed that the algorithm can produce trees of the same quality as batch learned trees; despite being induced in an incremental fashion.
Algorithm Quasi-optimal (AQ) was introduced by Michalski in 1973 [35]. AQ is a powerful machine learning methodology aimed at learning symbolic induction rules from a set of examples and counterexamples. The algorithm learns hypotheses in the form of Attributional Rules [35]. The simplest form of Attributional rules is
Antecedent Part Consequent Part
Where antecedent and consequent are complexes; conjunctions of Attributional conditions, for example
[ src_bytes = 20...180 ] & [Service = vmnet OR ftp] &[Protocol = tcp ] [Attack=R2L]
AQ, and produced a highly versatile learning methodology with expressive representation language, able to tackle complex and diverse learning problems in machine learning [27]. AQ algorithm is best explained in [35].
The fifth step is to evaluate the 20 trained classifiers produced from step 4, using cross validation. The evaluation step at this stage gives an initial perception about the classification accuracy in term of detection rate, false positive rate and other validation metrics. The output of this component is 20 trained models along with their evaluation statistics report. Section 5 summarizes the evaluation results.
By this end, we finish the offline training phase. The 20 models generated from the previous step are retained for future use in online phase, which will be discussed in the next subsection.
3.2 Online Phase
Fig [2] represents the online phase. At the beginning, new unseen records (test data) are fed into the feature extraction components, to extract effective feature.
The next step is to classify the incoming records using the previously generated model from offline phase. The records are fed as sequential data (to simulate network stream) into the 20 classifiers to be classified. The results obtained from this step is an intermediate result, as each one of 20 classifiers produce a predicted class corresponds to one of the 4 attacks or flag the record as normal.
In the third step, we use the Bagging approach to figure out one of 4 attacks/normal classes. This step outputs soft classification (class probabilities) by voting over all classes returned from the previous step, this output would be useful in case of cost sensitive classification. For example, on a single record, the output of the Bagging component outputs the following probabilities:
3 out of 20 classifiers produced Normal class P (Normal) =0.15 7 out of 20 classifiers produced Dos
class P (DoS) =0.35 4 out of 20 classifiers produced Probe
class P (Probe) =0.2 4 out of 20 classifiers produced R2L
class P (R2L) =0.2 2 out of 20 classifiers produced U2R
class P (U2R) =0.1
By this result, the bagging components flag the record as DoS attack with probability of 35%, as it represents the majority among others.
Two steps are involved at this level, the first is the classification shown above, and the second is to incrementally update (learn) the corresponding classifiers (generated from offline model) of the predicted value with new information obtained from record features and predicted result. For instance, in the previous example, all DoS classifiers will be updated. This ensures the model to be updated with the latest environment changes, yielding it adaptable to concept drift and deployable over diverse environments.
4 ILLUSTRATIVE EXAMPLE
To ensure the practicality and validity of the proposed model, we carried out an implementation for (LMAD). All components mentioned in the model have been implemented using Java programming language, WEKA [36], which is an open source tool for machine learning algorithms and data mining tasks, and massive online analysis (MOA) [37] which is an open source framework for data stream mining and big data processing. For training (offline) phase, 20% of NSL-KDD training dataset was used for training the model, and 20% of NSL-KDD test dataset was used for testing online phase. The testing data was fed into online phase as a stream, and then prequential evaluation [38] was carried out.
In what follows, we explain in details the idea for incremental learning for both Decision trees and AQ algorithms. We illustrate the idea by small subset of network audit records (around 50 records), applied sequentially on single pair wise classifier, namely, the R2L-U2R classifier in both algorithms. By doing this, we ensure that the generated information is comprehensible, tangible and the idea can be generalized to whole model.
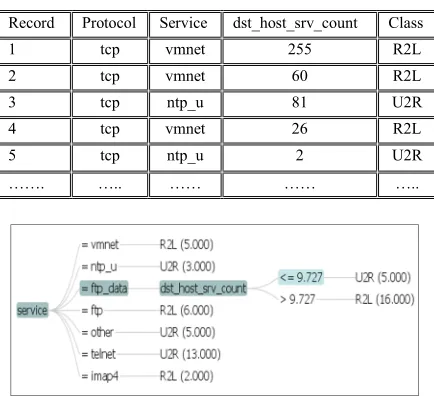
Table [3] lists first 5 records out of 50 random instances, and 3 features out of 19 features. The information illustrated in this table is shortened for convenience. The records are fed sequentially into both decision tree and AQ algorithms to dig out internal parameter adaptation of the algorithms based on incoming feature vector. After the first 4 records, Decision trees generated the following rules:
service = vmnet: predict R2L (4.000) using adaptive Naïve Bayes
service = ntp_u: predict U2R (2.000) using adaptive Naïve Bayes
Bayes, which is a combination of Naïve Bayes and majority class classification. Fig [3] visualizes the whole generated tree after 50 records have been processed.
Table. 3. First 5 network records in incremental learning
Record Protocol Service dst_host_srv_count Class
1 tcp vmnet 255 R2L
2 tcp vmnet 60 R2L
3 tcp ntp_u 81 U2R
4 tcp vmnet 26 R2L
5 tcp ntp_u 2 U2R
……. ….. …… …… …..
Figure. 3. Decision tree after processing 50 records
The same experiment was carried on AQ algorithm. The following rules were generated after the first 4 records (generated rules are trimmed for better comprehension):
Predict class U2R IF:
protocol_type in {tcp} ^ service in {ntp_u} ^ dst_host_srv_count=81.0 (1)
Predict class R2L IF:
protocol_type in {tcp} ^ service in {vmnet} ^ 26.0<=dst_host_srv_count<=255.0 (3)
The last number between brackets represents the number of corresponding class instances observed so far. After processing the 50 records, the
following rules were generated (generated rules are trimmed for better comprehension):
Predict class U2R IF:
a. protocol_type in {tcp,icmp,udp} ^ service in {vmnet,ftp,telnet}^
1.0<=dst_host_srv_count<=4.0 (15)
b. protocol_type in {tcp,icmp,udp} ^ service in {ntp_u,ftp_data,other}^
2.0<=dst_host_srv_count<=81.0 (12)
Predict class R2L IF:
a. protocol_type in {tcp,icmp,udp} ^ service in {vmnet,ftp_data,ftp} ^
26.0<=dst_host_srv_count<=255.0 (22)
b. protocol_type in {tcp} ^ service in {imap4} ^dst_host_srv_count=9.0 (1)
Comparing the output of the 2 algorithms, the generated rules from both algorithms are homogenous, non-contradictory and tangible.
Now, assume for the moment, we have a test record in the form [protocol=tcp, service=ftp_data, dst_host_srv_count=50]. If the model is to classify the testing record after it has learnt from the past 50 records, it will classify the record as R2L attack, based on the previous rules from both algorithms. By these results, we ensure the model practicality and validity to be deployed in any environment, since the learned rules conform to a valid discrimination between different classes.
5 EXPERIMENTAL RESULTS
This section summarized the results of (LMAD) model obtained by testing and evaluation techniques. There are two evaluation techniques; each one corresponds to specific phase of the model. For offline phase, we used 10-fold cross validation to grasp initial measures of the model validity. Table [4, 5] lists different evaluation metrics for Decision tree and AQ algorithms respectively. DR is the detection rate of the classifier, FP is the false positive rate, and F-Measure is the harmonic mean of the classifier, which considers both precision and recall. RMSE is the root mean square error while AUC is the area under the ROC curve [39].
Table. 4. Offline model evaluation statistics for Decision tree
Pair wise Classifier
Metric DR FPR
F-Measure
RMSE AUC
NORMAL-DOS 99% 1% 0.99 0.086 0.99
NORMAL-PROBE 97% 16% 0.96 0.15 0.99
NORMAL-R2L 96% 6% 0.96 0.192 0.93
NORMAL-U2R 97% 2% 0.97 0.158 0.98
DOS-PROBE 93% 8% 0.93 0.2 0.97
DOS-R2L 99% 8% 0.99 0.057 0.98
DOS-U2R 95% 25% 0.95 0.034 0.84
PROBE-R2L 99% 6% 0.99 0.096 0.98
PROBE-U2R 96% 1% 0.963 0.184 0.99
R2L-U2L 85% 18% 0.871 0.427 0.7
Table. 5. Offline model evaluation statistics for AQ
Pair wise Classifier
Metric DR FPR F-Measure RMS
E
AUC
NORMAL-DOS 99% 0.2
%
0.99 0.04 0.99
NORMAL-PROBE 97% 2% 0.99 0.1 0.98
NORMAL-R2L 99% 2% 0.99 0.1 0.98
NORMAL-U2R 99% 0.2
%
0.99 0.03 0.99
DOS-PROBE 97% 3% 0.99 0.08 0.98
DOS-R2L 100
%
1% 1.0 0.01 0.99
DOS-U2R 100
%
9% 1.0 0.01 0.95
PROBE-R2L 99% 1% 0.99 0.05 0.99
PROBE-U2R 98% 0.3
%
0.99 0.04 0.99
R2L-U2L 97% 6% 0.97 0.16 0.95
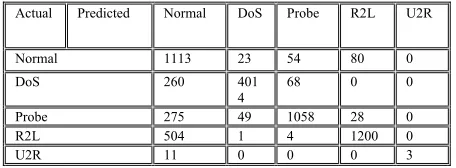
Table. 6. Confusion matrix for online phase after observing 7000 records
Actual Predicted Normal DoS Probe R2L U2R
Normal 1113 23 54 80 0
DoS 260 401
4
68 0 0
Probe 275 49 1058 28 0
R2L 504 1 4 1200 0
U2R 11 0 0 0 3
Table. 7. Confusion matrix for online phase after observing 8000 records
Actual Predicted Normal DoS Probe R2L U2R
Normal 1280 27 57 91 0
DoS 181 2720 52 0 0
Probe 282 49 1233 28 0
R2L 554 1 5 1400 0
U2R 15 0 0 21 4
Table 8- Confusion matrix for online phase after observing 12000 records
Actual Predicted Normal DoS Probe R2L U2R
Normal 1899 34 76 141 2
DoS 260 4014 68 0 0
Probe 298 52 2023 29 0
R2L 764 1 6 2115 1
U2R 24 0 0 36 7
Table 9. 2x2 Confusion matrix for table [6]
Actual Predicted Normal Anomaly
Normal 1113 175
Anomaly 1050 4662
Table 10. 2x2 Confusion matrix for table [7]
Actual Predicted Normal Anomaly
Normal 1280 175
Anomaly 1032 5513
Table 11. 2x2 Confusion matrix for table [8]
Actual Predicted Normal Anomaly
Normal 1899 253
Anomaly 1346 8502
6 CONCLUSION
In this paper, a new learnable real-time model has been proposed for anomaly detection using ensemble of incremental classifiers. The model is built using decision trees and AQ classifiers. Such model has been tested using the NSL-KDD’99 dataset, and it showed that it is capable to learn new rules from the input stream. The model confusion matrix showed that model accuracy has increased gradually from 80% to 85% after extra records have been processed.
7 REFERENCES
[2] J. H. Lee, J. H. Leet, S. G. Sohn, J. H. Ryu, and T. M. Chung, “Effective value of decision tree with KDD 99 intrusion detection datasets for intrusion detection system,” in International Conference on Advanced Communication Technology, ICACT, 2008, vol. 2, pp. 1170– 1175.
[3] H. Bensefia and N. Ghoualmi, “A New Approach for Adaptive Intrusion Detection,” 2011 Seventh Int. Conf. Comput. Intell. Secur., pp. 983–987, Dec. 2011.
[4] W. Lee, S. Stolfo, and K. Mok, “Adaptive Intrusion Detection: A Data Mining Approach,” Artif. Intell. Rev., vol. 14, no. 6, pp. 533–567, 2000.
[5] C. Modi, D. Patel, B. Borisaniya, H. Patel, A. Patel, and M. Rajarajan, “A survey of intrusion detection techniques in Cloud,” J. Netw. Comput. Appl., vol. 36, no. 1, pp. 42–57, Jan. 2013.
[6] A. Patcha and J.-M. Park, “An overview of anomaly detection techniques: Existing solutions and latest technological trends,” Comput. Networks, vol. 51, no. 12, pp. 3448– 3470, Aug. 2007.
[7] S. S. Sivatha Sindhu, S. Geetha, and A. Kannan, “Decision tree based light weight intrusion detection using a wrapper approach,” Expert Syst. Appl., vol. 39, no. 1, pp. 129–141, Jan. 2012.
[8] P. García-Teodoro, J. Díaz-Verdejo, G. Maciá-Fernández, and E. Vázquez, “Anomaly-based network intrusion detection: Techniques, systems and challenges,” Comput. Secur., vol. 28, no. 1–2, pp. 18–28, Feb. 2009.
[9] H.-J. Liao, C.-H. Richard Lin, Y.-C. Lin, and K.-Y. Tung, “Intrusion detection system: A comprehensive review,” J. Netw. Comput. Appl., vol. 36, no. 1, pp. 16–24, Jan. 2013. [10]C.-F. Tsai, Y.-F. Hsu, C.-Y. Lin, and W.-Y.
Lin, “Intrusion detection by machine learning: A review,” Expert Syst. Appl., vol. 36, no. 10, pp. 11994–12000, Dec. 2009.
[11]“KDD Cup 1999 Dataset.” [Online]. Available: http://kdd.ics.uci.edu/databases/kddcup99/kddc up99.html. [Accessed: 23-Jun-2014].
[12]C.-M. Chen, Y.-L. Chen, and H.-C. Lin, “An efficient network intrusion detection,” Comput. Commun., vol. 33, no. 4, pp. 477–484, Mar. 2010.
[13]L. K. Hansen and P. Salamon, “Neural network ensembles,” IEEE Trans. Pattern Anal. Mach. Intell., vol. 12, no. 10, pp. 993–1001, 1990. [14]R. E. Schapire, “The strength of weak
learnability,” Mach. Learn., vol. 5, no. 2, pp. 197–227, Jun. 1990.
[15]S. Mukkamala, A. H. Sung, and A. Abraham, “Intrusion detection using an ensemble of intelligent paradigms,” J. Netw. Comput. Appl., vol. 28, no. 2, pp. 167–182, Apr. 2005. [16]S. Chebrolu, A. Abraham, and J. P. Thomas,
“Hybrid feature selection for modeling intrusion detection systems,” in Neural Information Processing, 2004, pp. 1020–1025. [17]N. A. Syed, H. Liu, and K. K. Sung, “Handling
concept drifts in incremental learning with support vector machines,” in Proceedings of the fifth ACM SIGKDD international conference on Knowledge discovery and data mining - KDD ’99, 1999, pp. 317–321. [18]Z. Zhang and H. Shen, “Application of
online-training SVMs for real-time intrusion detection with different considerations,” Comput. Commun., vol. 28, no. 12, pp. 1428–1442, Jul. 2005.
[19]B. Xu, T. Yi, F. Wu, and Z. Chen, “An incremental updating algorithm for mining association rules,” J. Electron., vol. 19, no. 4, pp. 403–407, Oct. 2002.
[20]K. Shafi, H. A. Abbass, and W. Zhu, “An Adaptive Rule-based Intrusion Detection Architecture,” Secur. Technol. Conf. 5th Homel. Secur. Summit, Aust., pp. 345–355, 2006.
[21]K. Labib and R. Vemuri, “NSOM: A Real-Time Network-Based Intrusion Detection System Using Self-Organizing Maps,” Networks Secur., 2002.
[22]W. Khreich, E. Granger, A. Miri, and R. Sabourin, “Adaptive ROC-based ensembles of HMMs applied to anomaly detection,” Pattern Recognit., vol. 45, no. 1, pp. 208–230, Jan. 2012.
[23]A. Balon-perin and B. Gamback, “Ensembles of Decision Trees for Network Intrusion Detection Systems,” Int. J. Adv. Secur., vol. 6, no. 1, pp. 62–77, 2013.
[24]M. H. Bhuyan, D. K. Bhattacharyya, and J. K. Kalita, “Survey on Incremental Approaches for Network Anomaly Detection,” Int. J. Commun. Networks Inf. Secur., vol. 3, no. 3, p. 14, Nov. 2012.
[25]S. X. Wu and W. Banzhaf, “The use of computational intelligence in intrusion detection systems: A review,” Appl. Soft Comput., vol. 10, no. 1, pp. 1–35, Jan. 2010. [26]G. Hulten, L. Spencer, and P. Domingos,
“Mining time-changing data streams,” in ACM SIGKDD Intl. Conf. on Knowledge Discovery and Data Mining, 2001, pp. 97–106.
Wiley Interdiscip. Rev. Comput. Stat., vol. 2, no. 2, pp. 218–236, Mar. 2010.
[28]J. Wojtusiak and R. S. Michalski, “The LEM3 implementation of learnable evolution model and its testing on complex function optimization problems,” in Proceedings of the 8th annual conference on Genetic and evolutionary computation - GECCO ’06, 2006, p. 1281.
[29]“The NSL-KDD Data Set.” [Online]. Available: http://nsl.cs.unb.ca/NSL-KDD/. [Accessed: 24-Jun-2014].
[30]M. Tavallaee, E. Bagheri, W. Lu, and A. A. Ghorbani, “A detailed analysis of the KDD CUP 99 data set,” in IEEE Symposium on Computational Intelligence for Security and Defense Applications, CISDA 2009, 2009. [31]M. Salem and U. Buehler, “Mining Techniques
in Network Security to Enhance Intrusion Detection Systems,” CoRR, p. 16, Dec. 2012. [32]C. Thomas, V. Sharma, and N. Balakrishnan,
“Usefulness of DARPA Dataset for Intrusion Detection System Evaluation,” Data Mining, Intrusion Detect. Inf. Assur. Data Networks Secur., p. 69730G–69730G–8, 2008.
[33]N. V. Chawla, K. W. Bowyer, L. O. Hall, and W. P. Kegelmeyer, “SMOTE: Synthetic Minority Over-sampling Technique,” J. Artif. Intell. Res., vol. 16, pp. 321–357, Jun. 2011. [34]W. Hoeffding, “Probability Inequalities for
Sums of Bounded Random Variables,” J. Am. Stat. Assoc., vol. 58, no. 301, pp. 13–30, 1963. [35]J. Wojtusiak and R. S. Michalski, “The LEM3
System for Non-Darwinian Evolutionary Computation and Its Application to Complex Function Optimization,” no. C, pp. 2005–2010, 2010.
[36]“Weka 3 - Data Mining with Open Source Machine Learning Software in Java.” [Online]. Available:
http://www.cs.waikato.ac.nz/ml/weka/. [Accessed: 24-Jun-2014].
[37]“MOA Massive Online Analysis, Data Stream Analytics in Real Time.” [Online]. Available: http://moa.cms.waikato.ac.nz/. [Accessed: 24-Jun-2014].
[38]A. P. Dawid, “Present Position and Potential Developments: Some Personal Views: Statistical Theory: The Prequential Approach,” J. R. Stat. Soc. Ser. A, vol. 147, no. 2, p. 278, 1984.
[39]A. P. Bradley, “The use of the area under the ROC curve in the evaluation of machine learning algorithms,” Pattern Recognit., vol. 30, no. 7, pp. 1145–1159, Jul. 1997.