Crop Production-Ensemble Machine Learning Model for Prediction
Narayanan Balakrishnan1 and Dr.Govindarajan Muthukumarasamy2
1
Assistant Professor, Computer Science and Engineering Wing, D.D.E, Annamalai University, Chidambaram, Tamil Nadu 608 002, India
2 Assistant Professor, Department of Computer Science and Engineering, FEAT, Annamalai University, Chidambaram,
Tamil Nadu 608 002, India
1[email protected], 2[email protected]
ABSTRACT
Data Mining is the most believable approach of the present digital world for analyzing mass of data sets to obtain unnoticed relationship. The method used for the analysis of statistical data over a period of time is the time series analysis. This technique is scientific and reliable in forecasting events to follow over a period. Probability of production could always be predicted to the near perfection by time series analysis. In this work, food production is the thrust for prediction. The prominent classification methods in this study are the Support Vector Machine (SVM) and Naive Bayes. In this paper, AdaSVM and AdaNaive are the proposed ensemble model used to project the crop production over a period of time. This ensemble model is compared to SVM and Naive Bayes methods. The two parameters used separately for prediction of output are the accuracy and the classification error. The finding yields that AdaSVM and AdaNaive are agreeable than SVM and Naive Bayes for the data set analyzed.
Keywords: Data Mining, Time Series, Food Production, Crop Yield Prediction, Support Vector Machine, Naive Bayes, AdaSVM, AdaNaive, Accuracy, Classification Error.
1. INTRODUCTION
Before the advent of computer age, extraction of pattern from data sets was done only by manual methods. But now with the fantastic development of computer technology, collection of data set, classification and storage as wonderfully increased. This has made huge change in Pattern recognition. In order to identify particular pattern from the large data sets, an application is developed by using specific computerized algorithm in the domain of Data mining. Machine learning has been developed in Data Mining as a model in learning concept by using the computer. Given large data sets, prediction of new sets of data are developed using learning concept by this model by training and testing. With the aim of predicting an outcome, developing a model with the object of generating classification is popularly called as modeling. The classification [1,2] in data mining process is predicting the value of a target variable by generating a model based on some attributes
categorical variable. By this process, classification of a given data is based on class labels and training.
The time series data is a statistical data measured at a particular time interval over a period. The analysis leading to conclusion on this data for future prediction is called as time series analysis. A significant area for time series analysis is trend in crop production [3]. In this paper, crop production trend is suggested using data mining predictive techniques such as Support Vector machines and Naive Bayes which can also be referred as classifier techniques in the analysis of time series data sets is used. For the purpose of reducing the error rate and to increase the prediction accuracy, boosting is also carried out. Joining inappropriate and weak prediction rules for creating machine oriented learning is called as Boosting. It is used to reduce bias and variance in machine learning to convert weak learners to strong ones by this ensemble meta algorithm.
Nearly 60 percent of the Indian Population depends on agriculture for employment and income. Agriculture contributes sizeable amount of National income. Agricultural products are needed both as raw material for industries and more particularly for consumption. While in Northern parts of India, wheat and wheat products are consumed more as food, in the southern part of India, rice is the chief diet. Ever since India's five year plans, thrust is being given for green revolution. In India, green revolution is largely wheat revolution. Equally green revolution has changed the complexion of rural India.
suggesting based on a mass of historical crop production and climate data.
The work is arranged as follows. Section 2 represents outline of the work. Section 3 describes the previous related work. The Geographical Study of the area is described in section 4. Section 5 gives Materials and Methods used for the study. Proposed methodology is outlined in section 6. In section 7, Performance evaluation measures used for the analysis is described. In section 8, Experimental results and discussion are explained. Conclusion and future work are indicated in section 9.
2. OUTLINE OF THE WORK
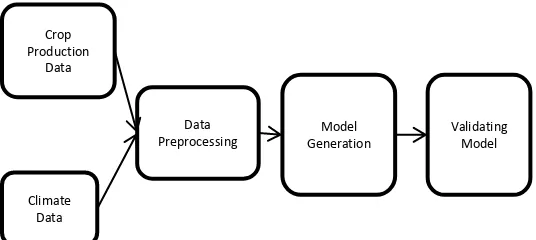
The outline of this work is illustrated by using a figure in this section. Fig 1 describes the overview of the proposed work. In Fig 1, the historical crop production and the environmental climate data is taken into account for this study. At the beginning stage, this large data set is carried out into preprocessing and is called as Data Preprocessing. In the next stage, the models are generated by using machine learning algorithm. In the final stage, validating the model is done by comparing the result of existing and the proposed technique.
Fig. 1. Overview of the proposed work
3. RELATED WORK
Several researchers in computer science have compared several forecasting methods in the time series analysis. A few of them are outlined here under.
Y. Chen and Y. Li [4] suggested entropy based combining prediction model for the unit crop yield prediction. The grey forecasting model and radial basis function neural network forecasting models are combined to increase the accuracy of prediction. This conjunction forecasting model is less risky in practice and more intuitive and feasible.
G. Chen et al [5] proposed ARIMA (Autoregressive Integrated Moving Average) for the prediction of corn output in a time series prediction model. The time series data sets obtained from Dehui city, Jilin Province from 1990 to 2000 is given to the proposed model and the output of corn prediction is validated from the year 2001 to 2003. The results obtained from the model are satisfactory because the relative error was controlled within 5%.
A. Dehzangi et al [6] developed an ensemble method using different classifiers namely Adaboost.M1, Logitboost, Naive Bayes, Multi-Layer Perceptron (MLP) and Support vector machine (SVM) for the prediction of protein structural class. The auto correlation based feature extraction is used in the work in order to get better results.
R. Kumar et al [7] presented a novel machine learning model which is used to solve the crop selection problem. In their work, a method named Crop Selection Method (CSM) is proposed to identify the crop selection of a region. The conclusion of the work is that the net crop yield increases by proper selection of crops using CSM. M. M. Rahman et al [8] in their research work have made machine learning model for predicting rice production in Bangladesh where the soil condition is not homogeneous. The models were at first trained on the correlation between previous environmental climate and crop yield rate. Finally the models are compared to justify the accuracy.
Deepti Gupta, Udayan Ghose [9] developed rainfall forecasting models based on Classification and Regression Tree algorithm, Naive Bayes approach, K nearest Neighbour and 5-10-1 Pattern Recognition Neural Network. The result accuracy obtained to the corresponding techniques are 80.3%, 78.9%, 80.7% and 82.1% respectively.
V. B. Nikam and B. B. Meshram [10] identified the challenges in weather prediction. The meteorological data with useful information may be called as weather data. The data obtained from Indian Meteorological Department (IMD) is taken into account for the study. The Bayesian data mining techniques is used for analyzing and prediction of the rainfall. The results indicate that the accuracy of Prediction is good with moderate computing resources by using the Bayesian approach.
4. GEOGRAPHICAL STUDY OF THE
AREA
The study area is of Thanjavur district, Tamil Nadu, India. This is a delta district where paddy, cotton, sugarcane and millets are the major crops grown. Crop
Production Data
Climate Data
Data Preprocessing
Model Generation
Thanjavur district is the granary of south India. It has fertile alluvial soil. A little amount of mechanization and tractor plough have gained momentum in recent years. Cauvery river water through canals and channels are the major source of irrigation. Besides, underground water is also used for irrigation in some parts of the district. The rise in the underground water level depends mainly on the quantum of rainfall. The location of Thanjavur district lies between 9º 50‟ and 11º 25‟ North latitude and 78º 45‟ and 79 º 25‟ East longitudes. The total geographical area of the district is 3,602.86 Sq.Km.
5. MATERIALS AND METHODS USED
5.1 Dataset
The climate data obtained from indianwaterportal.org and the crop production data obtained from faostat3.fao.org is taken into account for the study. The climate data contains various variables which are responsible for the rainfall for a specific region and the quantum of crop production for that region is taken into account for this work. The historical climate data of the CSV type with a record for every line of text alike to the data for a given month of an year. The crop production data of the CSV type with a record for each line of text belongs to the data for a specific month of an year. In the preprocessing stage, though there are many measured parameters available in the raw climate dataset, the less relevant features responsible for the study are ignored and the important features are only taken into account. Thus the two different types of historical records are preprocessed and combined together so that it can be used for this study. The time series historical data over 100 years is taken into study for this experiment. The record attributes are placed as Year/Month, Average Temperature, Cloud Cover, Diurnal Temperature, Maximum Temperature, Minimum Temperature, Potential Evapotranspiration, Reference Crop Evapotranspiration, Vapour Pressure, Wet day Frequency, Precipitation, Rice paddy production quantity, Cotton production quantity, Sugarcane production quantity, Groundnut production quantity and Blackgram production quantity for every month of a specified year. The "Average Temperature" represents the temperature in the study area which is averagely maintained in a particular month of an year . The "Maximum Temperature" represents the highest temperature noted in the study area for a specific month of an year. The "Minimum Temperature" represents the lowest temperature noted in the study area for a specific month of an year. The "Diurnal Temperature" represents the variation between high temperature and low temperature which occurs during the same month in the year and this is one of the most basic forms of climate
pattern. The "Cloud Cover" also called as cloudiness indicates to the fraction of the sky hidden by clouds when noted from a specific place. The "Potential Evapotranspiration" is the total of evaporation and plant transpiration from the lands of earth and surface of the ocean towards the atmosphere for month in a year. An Important part of the water cycle is Evapotranspiration. For example, a tree which contributes to evapotranspiration may be called as Evapotranspirator. A representation for the environmental demand of evapotranspiration can otherwise be called “Reference Crop Evapotranspiration". This represents both height of the short green crop and sufficient water level in the soil. In other words it is a reflection of the energy available to evaporate water and the wind available to transport the water vapour from the ground to the lower atmosphere. According to meteorological science, "Vapour Pressure" means partial pressure of water vapour in the atmosphere. The Proportion of wet days among the entire days in a particular month in a year is referred to as "Wet day Frequency”. A major component of water cycle is the "Precipitation", which is the condensation of atmospheric water vapour which falls under gravity for a particular month in a year. The major cause for bringing fresh water in the planet is Precipitation. The "month and the year" in which the weather data is taken into account is not used for the present work.
For the purpose of training and testing, separation of the dataset has been made where 60% of the dataset is used for training and 40% of the dataset is used for testing. By using the classification algorithm, the training dataset is used and models generated. The created model is used on the testing dataset in order to test the accuracy.
5.2 Machine Learning Methods
Support Vector Machine:
SVM and its fusion techniques for time series analysis [11, 12]. The important advantages of SVM‟s are its accurate classification technique in solving binary problems. SVM's are also memory intensive.
Naive Bayes:
Based on Bayesian theorem the Naive Bayes classification technique is developed. When the value of inputs is very high, this technique is most suitable. Simple Bayes or Idiot Bayes are the other names of Bayes classifiers. The probability of b instance in class in ( | ) is represented by the Bayes theorem as
( | ) ( | ) ( ) ( ) . For the chosen class ,
( | ) denotes the probability of generating b instance.
( ) denotes the probability of the happening of and ( ) is probability of the happening of d. When the attribute is single, this theorem of classification is done easily. The Naive Bayes classification is done by elaborating this hypothesis for various attribute by the use of the formula ( | )
( | ) ( | ) ( | ) where probability
of class is denoted by ( | ) which generates the
value for attribute 1, the value for 2nd attribute is generated by the probability of class indicated by
( | ). Hence by the assumption that the attributes
should have independent distributions, Naive Bayesian makes his analysis using the formula which is used to get meaningful results in forecasting [13]. The chief advantage of Naive Bayesian analysis is that is fast to train and classify. Moreover Naive Bayesian is not sensitive to irrelevant features. Its basis is real and discrete data and also manages streaming data also.
Ensemble Model: AdaBoost:
Combining with many other learning algorithms, the meta algorithm is called as AdaBoost algorithm. This would improve the performance of classification. AdaBoost uses the nested operator and it has a sub process. The sub-processor is used to generate a better model. The ensemble model creates more than one classifier and generates a better model. The accuracy of classification is expanded by creating more than one classifier by the ensemble model. The ensemble model leads to decision making by combining the results of their classification techniques. By this boosting method the accuracy of the given algorithm is improved. During the year 1995, Yoav Freund and Robert E. Schapire [14] developed the AdaBoost algorithm. In the training period of AdaBoost algorithm, the input set given is (A_1,B_1 ),(A_2,B_2 ),….,(A_m,B_m ) where Ai denotes space set A and Bi denotes space set B. It is assumed that B=(-1,+1). The base or weak algorithm are called in AdaBoost for the repeated sets Z=1,….Z. In the training set, AdaBoost pertains to weight. At the
beginning point, the weights are evenly distributed, while for the other training the weights are increased to indicate that they are not properly classified. By this method, weak learner is trained with hard examples. The merit is that this process would improve the accuracy of classification.
6. PROPOSED METHODOLOGY
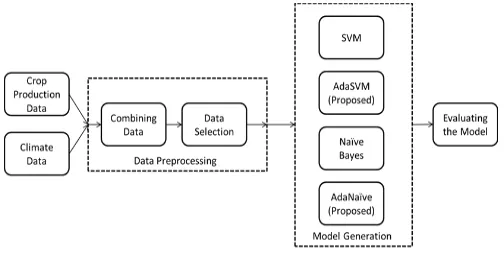
In this paper, forecasting of crop production is done by using the time series data set precisely than the existing models. By using AdaBoost technique, ensemble models such as AdaSVM and AdaNaive are developed. To bring weak learners who are slow in learning, AdaBoost technique helps their understanding. SVM when joined with AdaBoost (AdaSVM) will make superior classification by giving weak learners with appropriate training. A like method is used for Naive Bayes classifier in which AdaBoost based Naive Bayes (AdaNaive) is used to generate superior classified data. Fig 2 depicts the system implementation where the mass of historical crop production data and climate data is gathered and is made to data preprocessing work. In the data preprocessing, the data's are combine and selected for the study. The models are generated by classifying the mass of input data by using SVM and Naive Bayes modeling techniques. It may be seen that it is further classified in order to improve the performance with the
help of AdaBoost+SVM (AdaSVM) and
AdaBoost+Naive Bayes (AdaNaive). The models are evaluated by comparison.
Fig. 2. System Implementation
7. PERFORMANCE EVALUATION
MEASURES
cases are denoted by TP, true negative cases are denoted by TN, FP and FN are denoted for false positive cases and false negative cases respectively.
Classification Error: The classification Error (E) of any technique „t‟ are the cases not correctly classified (FP+FN). The formula for calculating classification Error is E_t=(F/N)*100 where t represents the technique, F denotes number of items classified incorrectly and N reveals total number of samples.
8. EXPERIMENTAL RESULTS AND
DISCUSSION
SVM, AdaSVM, Naive Bayes, AdaNaive are the classification methods used for time series forecast in this paper. Two groups are separated from the data set for training and for testing the algorithms of classification. In order to implement the classification algorithms, the tool used is Rapidminer data analysis. “Read CSV” operator of rapidminer tool is first loaded for Secondary data retained in CSV file . For classification process only a subset of data is selected from the loaded data. To select a subset from original data, “Select Attributes” are utilized by the operator. The chosen subset is then subjected to “X-Validation” operator. It develops the classification model which is validated by the test data. AdaBoost based SVM (AdaSVM), SVM, AdaBoost based Naive Bayes (AdaNaive) and Naive Bayes are implemented for classification by using “X-Validation” operator. The performance of the classification algorithm is evaluated by using the performance operator. Performance evaluation achieved for both the classification algorithms (existing and proposed) are given in Table 1 and Table 2.
Table 1: Accuracy of existing and proposed techniques
Crops Accuracy
SVM AdaSVM Naive
Bayes
AdaNaive
Rice
paddy 90.48 93.72 86.32 96.52
Cotton 87.60 90.56 84.87 93.45
Sugarcane 88.53 91.64 85.60 96.10
Groundnut 89.32 92.75 85.35 95.45
Black
gram 86.70 89.42 82.4 92.6
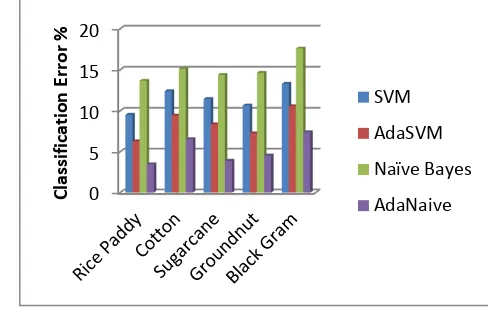
Table 2: Classification error of existing and proposed techniques
Crops Classification Error
SVM AdaSVM Naive
Bayes
AdaNaive
Rice
Paddy 9.52 6.28 13.68 3.48
Cotton 12.40 9.44 15.13 6.55
Sugarcane 11.47 8.36 14.40 3.90
Groundnut 10.68 7.25 14.65 4.55
Black
gram 13.30 10.58 17.6 7.40
The accuracy and Classification Error of prediction for the designated machine learning algorithms is revealed in Fig 3 and Fig 4. It may be seen from Fig 3 and Fig 4 that when compared to SVM and Naive Bayes algorithm, AdaBoost combined with SVM and Naive Bayes algorithm render better performance values.
Fig. 3. Accuracy for crop production prediction of the specified techniques (in %)
Fig. 4. Classification error for crop production prediction of the specified techniques (in %)
80 85 90 95 100
Ric
e P
ad
d
y
Cott
o
n
Su
garc
an
e
G
ro
u
n
d
n
u
t
Blac
k
G
ra
m
A
cc
u
rac
y %
SVM
AdaSVM
Naïve Bayes
AdaNaive
0 5 10 15 20
Cl
assi
fi
cation
E
rr
o
r
%
SVM
AdaSVM
Naïve Bayes
9. CONCLUSION AND FUTURE WORK
The time series analysis of crop yield prediction is subjected to analysis by the existing techniques Support Vector Machine and Naive Bayes with the proposed techniques viz., AdaSVM and AdaNaive .The results show that the accuracy and classification error of prediction by SVM for rice paddy is 90.48% and 9.52% whereas for cotton is 87.6% and 12.4% while for Sugarcane is 88.53% and 11.47% but for groundnut is 89.32% and 10.68% and for black gram is 86.7% and 13.3% respectively. The proposed AdaSVM produces 93.72%, 90.56%, 91.64%, 92.75% and 89.42% of accuracy and 6.28%, 9.44%, 8.36%, 7.25% and 10.58% of classification error for the same set of input data. The Naive Bayes generates 86.32%, 84.87%, 85.6%, 85.35% and 82.4% of accuracy and 13.68%, 15.13%, 14.4%, 14.65% and 17.6% of classification error for the same set of input data while the proposed AdaNaive gives 96.52%, 93.45%, 96.1%, 95.45% and 92.6% of accuracy and 3.48%, 6.55%, 3.9%, 4.55% and 7.4% of classification error. It may be concluded from the results that there is good amount of perfection in accuracy of prediction and also good amount of fall in the percentage of classification error in both the proposed techniques. Future research can enlighten the study whether by changing the technique produces better results or by increasing the input data set for the same technique results change in the findings. Importance of crop prediction is highly needed for agriculture and economy. Continuous research for improving new methods of prediction would be fruitful. This paper is a beginning for further research in forecasting.
REFERENCES
[1] Cheng Zhou, Boris Cule, Bart Goethals “Pattern Based Sequence Classification”, IEEE Transactions on Knowledge and Data Engineering, Vol. 28, No.5, 2016, pp.1285-1298.
[2] B. Tang, H. He, P. M. Baggenstoss and S. Kay “A Bayesian Classification Approach Using Class-Specific Features for Text Categorization”, IEEE Transactions on Knowledge and Data Engineering, Vol.28, No.6, 2016, pp.1602-1606.
[3] P.Samuel Quinan, Miriah Meyer “Visually Comparing Weather Features in Forecasts”, IEEE Transactions on Visualization and Computer Graphics, Vol. 22, No.1, 2016, pp. 389-398.
[4] Y. Chen and Y. Li "Entropy-Based Combining Prediction of Grey Time Series and Its Application" , IEEE International Conference on Intelligent Computation Technology and Automation (ICICTA), 2009, pp. 37-40.
[5] G. Chen, X. Xu, G. Wang and H. Chen "The corn output in a time series prediction model", IEEE
International Conference on World Automation Congress (WAC), 2010, pp. 283-286.
[6] A. Dehzangi, K. Paliwal, A. Sharma, O. Dehzangi and A. Sattar "A Combination of Feature Extraction Methods with an Ensemble of Different Classifiers for Protein Structural Class Prediction Problem", IEEE/ACM Transactions on Computational Biology and Bioinformatics, vol. 10, No.3, 2013, pp. 564-575. [7] R. Kumar, M. P. Singh, P. Kumar and J. P. Singh
"Crop Selection Method to maximize crop yield rate using machine learning technique" IEEE International Conference on Smart Technologies and Management for Computing, Communication, Controls, Energy and Materials (ICSTM), 2015, pp. 138-145.
[8] M. M. Rahman, N. Haq and R. M. Rahman "Machine Learning Facilitated Rice Prediction in Bangladesh", IEEE Global Online Conference on Information and Computer Technology (GOCICT), 2014, pp. 1-4. [9] Deepti Gupta, Udayan Ghose, " A Comparative Study
of Classification Algorithms for Forecasting Rainfall ", IEEE 4th International conference on Reliability, Infocom Technologies and Optimization (ICRITO) (Trends and Future Directions), 2015, pp. 1-6.
[10]V. B. Nikam and B. B. Meshram, "Modeling Rainfall Prediction Using Data Mining Method: A Bayesian Approach", Fifth International Conference on Computational Intelligence, Modelling and Simulation, Seoul, 2013, pp. 132-136.
[11]Kamil Żbikowski, “ Using Volume Weighted Support Vector Machines with walk forward testing and feature selection for the purpose of creating stock trading strategy”, Expert Systems with Applications, Vol. 42, No.4, 2015, pp. 1797-1805.
[12]Shuhaida Ismail, Ani Shabri, Ruhaidah Samsudin, “A hybrid model of self-organizing maps (SOM) and least square support vector machine (LSSVM) for time-series forecasting”, Expert Systems with Applications, Vol. 38, No.8, 2011, pp.10574-10578.
[13]Kurniady, A., Kosala, R., "Knowledge-based integrated financial forecasting system”, International Conference on Computer Research and Development (ICCRD), Vol.1, 2011, pp.120-124,.