E-ISSN 2308-9830 (Online) / ISSN 2410-0595 (Print)
Studying Performance in Supply Chain Management Using Data
Mining Software
Hind LAHMIDANI1 and Omar EL BEQQALI2
1, 2
Department of Science and Technologies of Information and Communication, University Sidi Mohammed Ben Abdellah. Sciences university Dhar Mahraz, Fez, Morocco
E-mail: [email protected], [email protected]
ABSTRACT
This paper present a new supply chain management information system based on measuring performance using dataming software. One of The most important part of this study lays in comparing the most common softwares, referring to many criterias. This study will help managers to take decisions and enhance supply chain in public administrations using the combination of information systems and dataming studies. The information system is based on a new approach using customer complaints. It helps to generate dashboards, reports and charts in order to compare each supplier results and verify the quality of each delivery.
Keywords:
Supply Chain Management, Dataming Complaints, Software, Suppliers, Customers,
Performance.1 INTRODUCTION
Supply Chain Management (SCM) has
revolutionized the control of intra- and inter-organizational flows. Considered as a new management philosophy that perceives relations between companies as a whole, and not as a fragment of unrelated entities, it allows the introduction of a new discipline, which territoriality is no longer limited to Simple logistics issues, but is more in other fields management such as marketing, strategy and management operations [1]. Private companies are not the only ones that are adopting supply chain management, there are public administration that integrate this methodology in their daily work to optimize the working conditions of employees and satisfy citizens.
The Mediterranean Partner Countries (MPCs), particularly those in the South Mediterranean, display numerous logistics-transport weaknesses. The proximity to the European market of countries
such as Morocco and Tunisia, well-integrated into Euro-Mediterranean trade, lends them a competitive advantage in responsiveness for time-sensitive sectors with respect to areas offering lower costs (low-cost countries) but that are farther away. This relatively competitive advantage is unfortunately hampered by logistics under-performance on all levels [2].
It would be advisable that governments adopt a supply chain management strategy overseen by a global information system that helps decision making. There are several software in this sense that allow supervision company's performance based on supply chain key indicators.
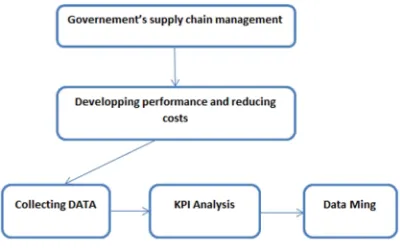
Fig. 1. Supply chain management evaluation method
The implementation of a supply chain management in public administration will help the government to better manage their data flow, improve the quality of delivered products, and reduce procurement budget, by giving the internal user the opportunity to give feed-back using an information platform.The data collected will be used to calculate Key Performance Indicators (KPI) and data ming will help government making decisions.
2 PROBLEMATIC
Most companies forget that quality is defined by customers reviews, which express their evaluation in respect of a particular product or service. Most of the time, this contact based approach is limited to a few surveys or claim boxes that are often neglected and undeveloped despite containing the key to their products continuous improvement.
The positive impact of SCM on operational performance can manifest itself in all dimensions. Cooperation, process integration, long-term relationship, processes improvement and reduction inventories and lead-time. The information sharing reduces uncertainty in the whole chain, resulting in better planning and control processes. Cooperation and processes integration between members of the same chain result in cost and time reduction further to quality and flexibility improvements, as each organization can focus on its core competencies and an effective governance mechanism is chosen. Empirically, it has been shown that cooperation and
long-term relationship have positive effect on quality, delivery and time reduction. External integration also drives shortening deadlines since design, development and processed simultaneously. They are SCM as a multidimensional construct impacts the firm performance as a whole [4].
Fig. 2. SCM benefits
In order to improve communication between SCM actors, it would be interesting to incorporate the procedure of customer complaints into the process of the supply chain in order to make the client a leading participant in an active way to ameliorate the company's products and make financial optimization. In order To help policy makers better choose their suppliers and define their specifications needs, it is important to use KPIs and data Ming. These tools will help analyzing data and performing internal and external organization.
3 BENCHMARK STUDY
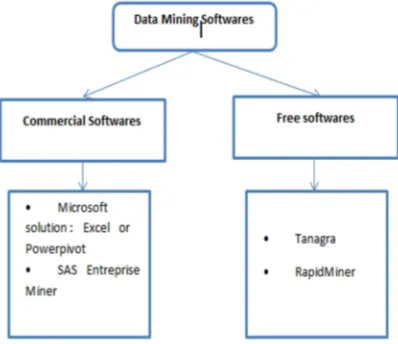
Fig. 3. Example of DataMing Softwares
Softwares are classified in two categories: The commercial and free softwares.We chose The Microsoft solution, the SAS entreprise Miner, Tanagra and RapidMiner as the most used datamining softwares in order to make a benchmark study and define the ideal software wich will help us to make better decisions using the supply chain management information system database.
PowerPivot for Excel: Makes easy the access to datamining and business intelligence analysis From Microsoft Excel and Sharepoint.The online analytic processing (OLAP)solutions are made by the Powerpivot fo excel, it helps to analyse multimensional data from multiple perspectives. Sharing these solutions is made by the Powerpivot for Sharepoint and making showing the analysed data and reports from any database platform[5]. SAS Entreprise Miner: SAS Enterprise Miner is a part of SAS Software, a very powerful information delivery system for accessing, managing, analyzing, and presenting data.
SAS Enterprise Miner has been developed to support the entire data mining process from data manipulation to classifications and predictions [6]. Tanagra: is a free DATA MINING software for academic and research purposes. It proposes several data mining methods from exploratory data analysis, statistical learning, machine learning and databases area. TANAGRA is an "open source project" as every researcher can access to the source code, and add his own algorithms, as far as he agrees and conforms to the software distribution license[7].
RapidMiner: RapidMiner is an open source data mining tool that provides data mining and machine learning procedures including data loading and transformation, data preprocessing and
visualization, modelling, evaluation, and deployment [8].
To perform a comparative study of different methods, a choice of indicators is needed:
Cost : is the tool free for research studies
Research: is the software helps to make research studies
Platform Variety: it runs on typical business user platforms?
Data Size: How well does the software scale to large data sets?
Efficiency: Does the software produce results in a reasonable amount of time relative to the data size, the limitations of the algorithm, and other variables?
Software Architecture :Does the software have a simple architecture for users[9].
Following the brief description of these different Dataming tools, we can sort on the Consolidated TABLE I here under, different systems studied by the above indicators to measure the performance and the strengths of each tool.
The compliance degrees with performance indicators are:
EXCELLENT: The criteria is very well respected
GOOD : The criteria is respected
NOT GOOD: The criteria is not respected as it should be.
Table 1: Comparative study of DataMining software
PowerPiv ot for Excel
SAS Entrepri se Miner
Tanagra RapidMiner
Cost not good not
good
excellent excellent
Research good good excellent good
Platform Variety
not good good good good
Software Architectur e
good good excellent not good
Data Size good good good good
Efficiency good good good good
4 PROPOSED SOLUTION
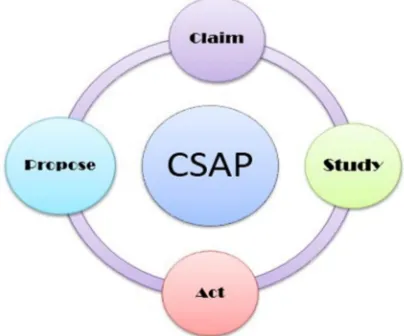
This section provides a process to develop appropriate objectives attributes and detailed evaluation contents for evaluating SCM systems. We define our information system by a new proposed approach that we name CSAP (CLAIM, STUDY, ACT, PROPOSE) It is based on the following steps:
Claim: Defines the first step of the cycle of CSAP approach. The main objectives of this phase are: The collection of customer complaints, the definition of product demand, the definition of the problem, harvesting client proposals, receiving a problem description and a declaration of a new need.
Study: After receiving the customer complaints, the company needs to study the data sent by the clients to analyze it and deeply study the problem. This step, which is represented by the word "Study", is the heaviest of those described in the CSAP cycle. This step is based on processing the data collected in order to have an idea about the quality of the product presented on the market. It should be based on statistical studies and dashboards to facilitate decision making and supply chain optimization. Indeed, the best way to analyze all customer complaints is to establish statistics to understand the claims evolution. These statistics studies will be done using the TANAGRA free software with the help of SQL server
Act: In this step, the company must take into account the different statistics and results to propose changes to its supply chain. If, for example, we found that 80% of customers believe that the quality of the product of a specific brand is low, then the company must work out a solution with the supplier.
Propose: It is the final stage of CSAP cycle which allows the company to put the product in the market after modification. The objective of this step is to push the client to test the new product, increase loyal customers numbers, reward customers who submitted their feedbacks, and convince them to help the
company improving the quality of its products by showing up the importance of their inputs. Choosing a cycle for Supply chain management process will better simulate all stakeholders of the company, especially if we integrate this cycle on the development process of information systems within companies. This is why we chose to represent the CSAP cycle as follows Figure 5:
Fig. 4. Representation of CSAP cycle
7 RESULTS
Our information system is made with Microsoft products licensed to the Moroccan Ministry of Energy and Mines, namely visual studio 2010 as integrated development environment which is used to develop computer programs or web application and SQL server 2008 R2 as relational database management system.
Our information system saves a lot of important Data that will be analyzed with the Tanagra system. Some of these data there is:
The client claims
The product claimed
The company claimed
Tanagra is a free DATA MINING software for teaching and research. It implements a series of data mining methods from the field of exploratory statistics, data analysis, machine learning and data bases.
Tanagra is an open project in the sense that it is possible for any researcher to access the code and add their own provided algorithms with the software distribution license.
easy access, respecting the field of software standards, particularly in terms of interface and operation mode, and allowing to conduct studies on real and / or synthetic data [10].
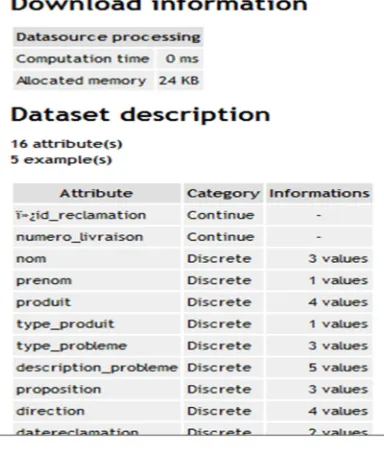
To analyze data we export a TXT file in order to join it to Tanagra. This operation gives an idea about download information and allocated memory capacity. It gives also a dataset description resuming all the attributes, their categories and other information like the number of each distinct attribute values.
Fig. 5. Reported data in Tanagra
With Tanagra we can get a lot of statistics using many algorithms and functions as shown in the next figure.
Fig. 6. Some functions in Tanagra
8 PERSPECTIVES
One of the mean prospects of this great project is to generalize the management of the supply chain for all areas and trades, and not to limit the study just to treat supplies and products. It would also be interesting to generalize it to the human resources management division, in order to manage the flow and treatment of several applications required by the officials and to optimize annual holiday periods
by studying the key performance indicators. The main objective of Data Ming is also important it gives the opportunity to study data and analyze it using different algorithms.
9 REFERENCES
[1] M.Balambo, A. Houssaini ,” Typologies d’int´egration des Supply Chains : perspectives pour le contexte Marocain”, LES DEFIS DU
MANAGEMENT INTERNATIONAL A
L’AUBE DU XXI`eme SIECLE, 2011, France. pp.21.
[2] M. El Khayat,” Logistics in the Mediterranean: Current Situation and Prospects” Economy and Territory | Territory and Transport . Med.2011. pp.267.
[3] H. El Sayed,” Supply Chain Key Performance Indicators Analysis” International Journal of Application or Innovation in Engineering & Management. Volume 2, Issue 1,p 201. January 2013
[4] P. Miguel, L. Brito,” Supply Chain Management measurement and its
[5] influence on Operational Performance”, Journal of Operations and Supply Chain Management, Volume 4• Number 2 • July - December 2011
[6] B.Ralstion , “Powerpivot for business intelligence using Excel and sherepoint”,2011 [7] T. Lasota1 , M. Makos , B. Trawiński,”
Comparative Analysis of Neural Network Models for Premises Valuation Using SAS Enterprise Miner”, Wrocław University of Technology, Institute of Informatics, Wybrzeże
Wyspiańskiego 27, 50-370 Wrocław,
Poland.2009
[8] Y. Ramamohan, K. Vasantharao, C. Kalyana Chakravarti, A.S.K.Ratnam,” A Study of Data Mining Tools in Knowledge Discovery Process”, International Journal of Soft Computing and Engineering (IJSCE) ISSN: 2231-2307, Volume-2, Issue-3, July 2012 [9] Kalpesh Adhatrao, Aditya Gaykar, Amiraj
Dhawan, Rohit Jha and Vipul Honrao,”
PREDICTING STUDENTS’
PERFORMANCE USING ID3 AND C4.5
CLASSIFICATION ALGORITHMS”,
International Journal of Data Mining & Knowledge Management Process (IJDKP) Vol.3, No.5, September 2013
Technology and Innovation (ISSN: 2315-5124) Vol. 1(6) pp. 131-137, September, 2012
[11]VISHAL JAIN1 , GAGANDEEP SINGH
NARULA, MAYANK SINGH,”
IMPLEMENTATION OF DATA MINING IN
ONLINE SHOPPING SYSTEM USING