Development of Bus and Train User Behavior Model
as Intermoda Transportation (Case Study in Cirebon
Region)
Hermawan, Herry
1Pratikso
2HERMAWAN, HERRY
Doctoral Student Department of Department of Civil Engineering Islamic University of Sultan Agung Semarang, Indonesia
PRATIKSO
Professor, Ph.D., M.ST., Ir. in Civil Engineering Department of Islamic University of Sultan Agung Semarang
Abstract-- According to the West Java Provincial
Transportation Agency (2016), the challenge that must be faced by Cirebon is the matter of public transportation to prevent congestion. On average, once every 7 minutes the city of Cirebon is crossed by a train that has made the city jam at some point. Bus Rapid Transit (BRT) which is similar to the Transjakarta Bus concept has also been prepared because there have been studies on which routes will be passed. This study examines the behavior model of intermodal road and railroad transportation users considering the highest frequency of population mobility in the Cirebon region is through land transportation, rather than through water or air.
The sample representing the population of this study was taken as many as 300 respondents with characteristics of sex, age, education, employment, and income. The research location is at the Harjamukti bus terminal, Prujakan train station, and the Cirebon Prosecutor's train station. The technique of collecting data using questionnaires and interviews. Data analysis techniques using structural equation modeling with PLS.
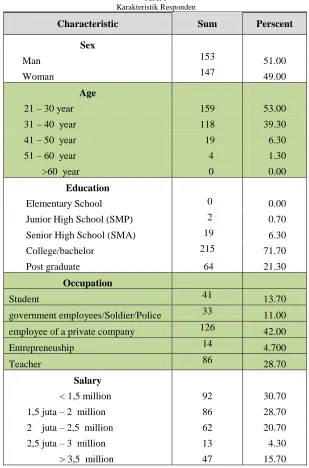
Individual characteristics of respondents were dominated by male gender, age 21-30 years, D3 / S1 education, private employee employment, and income of less than 1.5 million rupiah per month. R2 value of the influence of alternative boundaries and individual limits on travel behavior is obtained at 0.548. This means that 54.8% of the travel behavior of intermodal transportation users can be influenced by alternative constraints and individual limits, while the remaining 45.2% of travel behavior can be influenced by other variables. The value of R2 from the influence of perceptions of attitudes is obtained at 0.560. This means that 56% of the attitude of intermodal transportation users can be influenced by perceptions of intermodal, while the remaining 44% attitudes can be influenced by other variables.
Index Term-- Behavior, Intermoda, Transportation
INTRODUCTION
The concept of route selection in passenger transportation is inseparable from passenger preferences which in some cases will vary. The problem that exists in our current transportation system is the tendency of people to use only one type of transportation mode. The approach to selecting routes based on behavior and preferences is an important thing to study. The concept of transportation behavior has been demonstrated in the Manheim model, but
empirical research on the model still needs to be developed given the changing concept of transportation is also growing (Wang & Gitae, 2015).
The purpose of this study was to (1) analyze the individual characteristics of intermodal bus and train users, (2) analyze the behavior of public transport users between road and railroad modes.
LITERATUR REVIEW
Tjiptono (2012) emphasizes that there are two main activities of consumer behavior, namely: (1) Mental activities, such as assessing the suitability of product brands, assessing product quality based on information obtained from advertisements, and evaluating actual experience of product / service consumption. (2) Physical activity, including visiting stores, reading consumer guides or catalogs, interacting with salespeople, and ordering products.
An understanding of the customer's mental and physical activities leads to identifying which parties are involved in the process, who plays each role (user, payer, and buyer), why certain processes can occur, consumer characteristics such as what determines their behavior, and what environmental factors influence the customer behavior process.
RESEARCH METHOD
Behavior's journey is usually faced with some of the most prominent alternative is the mode of transport products or services will be used to make the trip. In a survey of travel behavior, according Gleave (1991) in Siswanto (2014) distinguish elements that are external elements (such as perception, attitude, preference). Processes underlying travel behavior is shown in Figure 2.1.
The results of the above steps in one form of alternative options, in this case is the product transportation
services that will be used in traveling.
Picture 1. Behavioral of Individual Travelling (Source : Siswanto, 2014)
Population and Sample
The population in this study were the users of the highway intermodal transport services and Semarang Metropolitan railway lines which can not be predicted (infinite) . The selection of the sample in this study with the accidental sampling design . The selection of sample members conducted on people who happen to be found . The advantage of using this technique is inexpensive , fast and easy . The disadvantage is less representative . (Usman and SA Purnomo, 1995; Siswanto, 2014).
The amount of sample taken using accidental sampling because a large population is not expected (infinite) using the formula Zikmund (Kuncoro, 2003) as follows:
n = ... (3.1)
n = number of samples
Z = standardized value corresponding degree of confidence
S = standard deviation of the sample or the population standard deviation estimate E = the tolerable level of error, plus or minus error factor
Phase Analysis and Modeling
User Behavior Analysis with PLS intermodal
Analyzing indicators with parameters that are not measurable (qualitative) into measurable parameters (quantitative) with
Characteristic experience
Information of alternative
travelling Atribute of alternative
translate alternatif
Perception
Attitude
Preference
Purpose and Objective
Situasional Limited of individual
Alternative Limit that available Travel Behavior
C
6. Individuals limitation, includes (a) a private vehicle ownership, (b) Number of trips a day, (c) transportation expenditure allocations
b. The dependent variable (y) is a variable that is influenced by other variables. In this stage as the dependent variable is the behavior described in the variable:
Behaviors include (a) the desire to use intermodal, (b) Rejection (c) The desire to move from the old to the intermodal transport.
Picture 2. Concept of PLS Diagram Construct
RESULT AND DISCUSSION
In the analysis of the results of this study a model of user behavior was tested on the variables related according to Manheim and Siswanto (2014) for existing types of intermodal transportation. Data analysis was performed using the Partial Least Square (PLS) method. PLS analysis is only a test that some users of transportation mode behavior can be proven to have an influence on the behavior of users of transportation services. The output of PLS analysis is only proof that the Manheim and Siswanto (2014) model can be applied in the behavior of intermodal users. Data description of respondent characteristics is presented in table 1 below.
Sex
Age Education
Salary
Travel atribut (AP)
Informasi Perjalanan Alternatif (IP)
intermoda perception
(P)
Intermoda Attitude (S)
Travel Behavior
(PP) Batasan alternatif
(BAF) Batasan
Individu (BI)
JK
U
Pddkn Pdpt
B1 B2 B3
A1
A2
A3 C1
C2 C3 C4
D1 D2 D3
F1 F2 F3 E1 E2 E3
Tabel I Karakteristik Responden
Source : survey, 2018
The use of the PLS analysis model is simpler in testing the fit model than covariant-based SEM analysis. SEM
reflexive measure is said to be high if it correlates more than 0.70 with the measured construct.
Characteristic Sum Perscent
Sex
Man 153 51.00
Woman 147 49.00
Age
21 – 30 year 159 53.00
31 – 40 year 118 39.30
41 – 50 year 19 6.30
51 – 60 year 4 1.30
>60 year 0 0.00
Education
Elementary School 0 0.00
Junior High School (SMP) 2 0.70
Senior High School (SMA) 19 6.30
College/bachelor 215 71.70
Post graduate 64 21.30
Occupation
Student 41 13.70
government employees/Soldier/Police 33 11.00
employee of a private company 126 42.00
Entrepreneuship 14 4.700
Teacher 86 28.70
Salary
< 1,5 million 92 30.70
1,5 juta – 2 million 86 28.70
2 juta – 2,5 million 62 20.70
2,5 juta – 3 million 13 4.30
Pictures 3. Result of PLS analysis
The next analysis is testing the SEM model with PLS on outer loadings and inner loadings.
Testing of Convergent Validity
Outer loadings testing is the same as the quality data testing which is intended to avoid the bias obtained from research data in explaining variable constructs to be measured or testing the validity and reliability of constructs. As we know, PLS analysis is a deep factor-based analysis that can also be referenced as a form of analysis to test the validity of a construct.
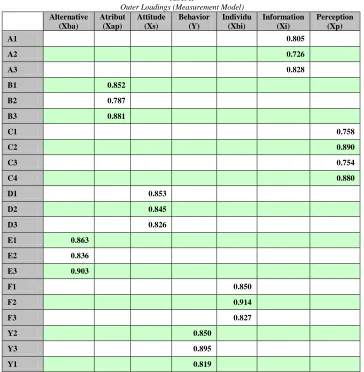
Tabel II
Outer Loadings (Measurement Model) Alternative
(Xba)
Atribut (Xap)
Attitude (Xs)
Behavior (Y)
Individu (Xbi)
Information (Xi)
Perception (Xp)
A1 0.805
A2 0.726
A3 0.828
B1 0.852
B2 0.787
B3 0.881
C1 0.758
C2 0.890
C3 0.754
C4 0.880
D1 0.853
D2 0.845
D3 0.826
E1 0.863
E2 0.836
E3 0.903
F1 0.850
F2 0.914
F3 0.827
Y2 0.850
Y3 0.895
Y1 0.819
The results of processing using SmartPLS can be seen in the table above obtained by the value of outer loading or correlation between constructs and variables which in general have supported the concept of measuring each variable because it has a loading factor above 0.50. Thus each measuring indicator is valid.
Testing the validity of discrimination
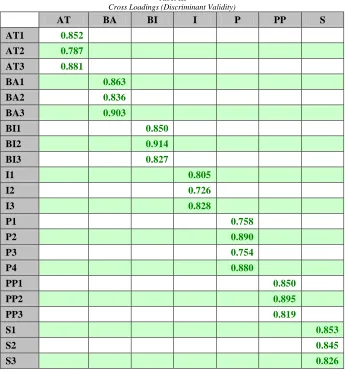
Tabel III
Cross Loadings (Discriminant Validity)
AT BA BI I P PP S
AT1 0.852
AT2 0.787
AT3 0.881
BA1 0.863
BA2 0.836
BA3 0.903
BI1 0.850
BI2 0.914
BI3 0.827
I1 0.805
I2 0.726
I3 0.828
P1 0.758
P2 0.890
P3 0.754
P4 0.880
PP1 0.850
PP2 0.895
PP3 0.819
S1 0.853
S2 0.845
S3 0.826
The results of processing obtained cross loading values or correlations between constructs and corresponding variables in general have supported the concept of measurement of each variable because it has the largest loading factor compared to the value of loading factors on other variables.
Realiability and Variance Extract
Validity and reliability criteria can also be seen from the reliability value of a construct and the value of Average Variance Extracted (AVE) of each construct. Constructions are said to have high reliability if the value of 0.70 and AVE is above 0.50. Table 4 presents the Composite Reliability and AVE values for all variables.
Table IV
Nilai Composite Reliability dan Average Variance Extracted Variabel Cronbach's
Alpha
Composite Reliability
Average Variance Extracted (AVE)
AT 0.793 0.878 0.707
BA 0.837 0.901 0.753
BI 0.830 0.899 0.747
I 0.706 0.830 0.620
P 0.838 0.893 0.677
PP 0.816 0.891 0.731
S 0.800 0.879 0.708
Based on the table above it can be concluded that all constructs meet the criteria of reliability. This is indicated by the value of Composite reliability of each variable above 0.70.
Inner Model Analysis
Analysis of the inner model or structural model is done to see the relationships between constructs. Inner model testing is also a test of the relationship between latent variables hypothesized. The significance of the estimated parameters provides very useful information about the
relationship between the research variables. The limit for rejecting and accepting the proposed hypothesis is +1.96, where if the value of t count <t table (1.96) then the alternative hypothesis (Ha) will be rejected or in other words accept the null hypothesis (H0). The following table provides estimated output for testing structural models as in table 5.
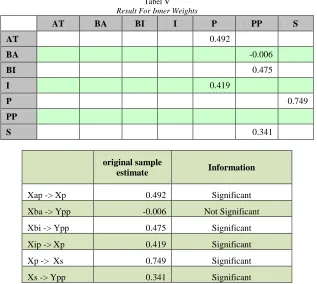
Tabel V Result For Inner Weights
AT BA BI I P PP S
AT 0.492
BA -0.006
BI 0.475
I 0.419
P 0.749
PP
S 0.341
original sample
estimate Information
Xap -> Xp 0.492 Significant
Xba -> Ypp -0.006 Not Significant
Xbi -> Ypp 0.475 Significant
Xip -> Xp 0.419 Significant
Xp -> Xs 0.749 Significant
Xs -> Ypp 0.341 Significant
Structural equation models based on these results can be written as follows: Xp = 0.492 Xap
Ypp = - 0.006Xba
Ypp = 0.475 Xbi
Xp = 0.419 Xip
Ypp = 0.341 Xs – 0.006Xba + 0.475Xbi
Information :
Xip = travel information Xap = travel atribute Xp = Perception
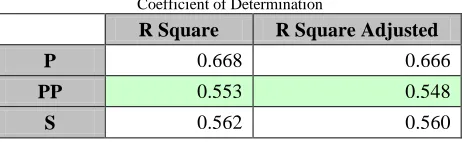
Tabel VI
Coefficient of Determination
R Square R Square Adjusted
P 0.668 0.666
PP 0.553 0.548
S 0.562 0.560
The value of R2 from the influence of travel information and travel attributes on perception is obtained at 0.666. This means that 66.6% of respondents' perceptions can be influenced by travel information and travel attributes, while the remaining 33.4% perceptions of users of intermodal transportation can be influenced by other variables.
R2 value of the influence of alternative boundaries and individual limits on travel behavior is obtained at 0.548. This means that 54.8% of the travel behavior of intermodal transportation users can be influenced by alternative constraints and individual limits, while the remaining 45.2% of travel behavior can be influenced by other variables.
The value of R2 from the influence of perceptions of attitudes is obtained at 0.560. This means that 56% of the attitude of intermodal transportation users can be influenced by perceptions of intermodal, while the remaining 44% attitudes can be influenced by other variables. The combined coefficient of determination (Q2) of the overall model is calculated by the following formula:
Q2 = 1 – ((1 – R12)(1 –R22)(1 – R32)
= 1 – ((1 – 0.666)(1 – 0.548)(1 – 0.560)
= 1 – 0.066
= 0.934
This means that the model can explain 93.40% of the behavior of intermodal transportation users.
CONCLUSION
R2 value of the influence of alternative boundaries and individual limits on travel behavior is obtained at 0.548. This means that 54.8% of the travel behavior of intermodal transportation users can be influenced by alternative constraints and individual limits, while the remaining 45.2% of travel behavior can be influenced by other variables.
The value of R2 from the influence of perceptions of attitudes is obtained at 0.560. This means that 56% of the attitude of intermodal transportation users can be influenced by perceptions of intermodal, while the remaining 44% attitudes can be influenced by other variables.
REFERENCES
[1] Ghozali, Imam. 2012. Structural Equation Modelling Alternative Methods with Partial Least Square (PLS) 2nd Edition. Semarang : Diponegoro University Publishers.
[2] Kordnejad, Behzad, 2016. Stakeholder Analysis in Intermodal Urban Freight Transport. Transportation Research Procedia 12 (2016) 750-764.
[3] Kuncoro, Mudrajad , 2003, Research Methods for Bussines and Economic, Jakarta : Erlangga .
[4] Manheim, Marvin L, 1979. Fundamentals of Transportation System Analysis Vol.1, Massachusetts Institute of Technology Press.
[5] Siswanto, Joko., Jinca M. Yamin. 2014, Model Behavior
Development of User
Transportation With Partial Least Square (PLS) In Semarang Indonesia, International Journal of Civil & Environmental Engineering IJCEE-IJENS Vol: 14 No:03. pp. 36-42.
[6] Tamin, O.Z. 2000, Planning and Modelling in Transportation, 2nd ed. Bandung : ITB.
[7] Tjiptono, F. 2012. Total Quality Service. Yogyakarta : Andi offset. [8] Usman, Husaini dan Purnomo Setiady Akbar,1995, Metodology of
Social Research, Jakarta : Bumi Aksara Inc.
[9] Wang., Ying Wang & Gi-Tae Yeo. 2016. A Study on International Multimodal Transport Networks from Korea to Central Asia: Focus on Secondhand Vehicles. The Asian Journal of Shipping and Logistica. Volume 32 no.1 2016.