Heat Transfer and Flow Structure of Multiple Jet
Impingement Mechanisms on a Flat Plate for
Turbulent Flow
Mahir Faris Abdullah1*, Humam Kareem2, Rozli Zulkifli1*, Zambri Harun1, Shahrir Abdullah1, Wan Aizon W. Ghopa1
1Department of Mechanical and Materials Engineering, Universiti Kebangsaan Malaysia, 43600 Bangi, Selangor 2Mechanical Engineering Dep. /University of Technology, Baghdad-Iraq
*
Correspondence: [email protected], [email protected]
Abstract-- Many heating or cooling-based engineering and industrial application use impinging jets, due to their higher convective heat transfer coefficient values. Here, the researchers stated that there was less available information regarding an increase in the heat transfer rates, when twin impingement jets were placed horizontally, at a distance from the stagnation point. Some studies made use of a twin impingement jet process for numerically and experimentally increasing the heat transfer values. In this study, the researchers carried out a numerical simulation that was based on an RNG k-ε turbulence model, in order to determine the cooling process for the heated surface of an aluminium plate. For this purpose, they used a Twin Jet Impingement Mechanism (TJIM), which consisted of 9 models. Furthermore, they also studied the effects of the nozzle-nozzle distances, nozzle-plate distances and Re number of the convection heat transfer for calculating the heat transfer coefficient, Nu number and a thermal enhancement factor. Some of the main conclusions observed in the simulation study were further used for validating all the experimental results and determining all major parameters that could affect the heat transfer rate, Nu number and distribution of the static pressure. The arrangements of all jets showed that Model 1 was ideal for calculating the Nu number when S/D= H/D=0.5. Meanwhile, Model 9 displayed the worst results, where S/D= 1.5 and H/D= 5.5. The results also showed that an irregular distribution of a local Nu number (Nu) on the impinged surface occurred due to a decrease or increase of the flow turbulence. Various twin jet arrangements showed that Model 9 displayed the worst results, where S/D= 1.5 and H/D= 5.5. All numerical results were validated after comparing the simulation and experimental results for the TJIM. This further described the temperature distribution on a flat metal surface for different models. Here, the researchers have calculated the enhancement factor using different nozzle arrangements in 9 models. This value ranged from 6.4% and 24.3%, in the case of simulation studies, whereas in the actual experiments, it ranged from 5.3% to 37.9%. The simulation model showed a 12-41% increase in the average heat transfer rate for the complete aluminium plate. Based on the validation model, the experimental and numerical tests
distance between nozzle and plates. Characteristics of heat transfer could be enhanced if the researchers selected an appropriate impingement mechanism and selected the optimal levels of other factors.
Index Term--
Heat transfer enhancement; impingement jet; Nusselt number, Fluent; CFD
1. INTRODUCTION
The heat transfer enhancement was seen to be an effective technique that could improve the industrial and engineering applications. In the past few years, many applications have used the impingement jets, which were a heat transfer process, for enhancing the heat transfer rate [1]–[3]. Here, the researchers used a numerical simulation for investigating the twin impingement jet flow and the impingement heat transfer. Simulation and experimental results were further analysed and discussed, and the heat transfer effects occurring because of the impingement of twin jets on the hot aluminium plate surface were noted. This study also assessed the twin impingement jet flow and investigated the effects of the various parameters like the nozzle-plate distance and the Nozzle-Nozzle distance [4]– [6]. The flow characteristic of the twin jets incorporated the air jet velocity into the external hole if the Reynolds number was 17,000. All heat transfer-related issues were correlated using the factors that affected the heat transfer, and the researchers investigated the heat transfer enhancement related to the twin jet impingement.
characteristics in the twin jets on the heated plate surface that was cooled using the twin impingement jets at various positions. This provided information regarding the best model based on the heat transfer rates using different jet arrangements on the measured surface. This could improve the performance of all industrial applications and the rate of heat transfer in various passive heat transfer methods that involved a twin jet impingement. This was a numerical study which used the ANSYS FLUENT software (ver. 14; Ansys Inc., Canonsburg, PA, USA). The SOLIDWORKS software would be used for creating the grid system geometry and for simulating all cases for a geometry model using 2 jets. Furthermore, the researchers have also described and presented the applicable formulae. They also discussed the theory and methods used for the CFD software simulation [17]. The second phase includes a 3D model design based on Solidworks. The Computational Fluid Dynamics software was used for simulating the 3rd
phase. Finally, the researchers have analysed and compared all the results.
2. EXPERIMENTAL PROCEDURES
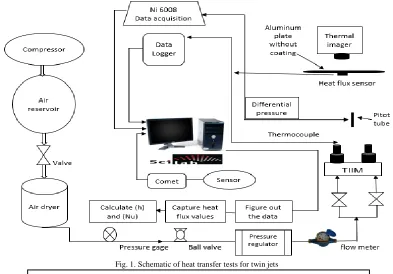
Figure 1, presents the schematic heat transfer tests for twin jets which explains the methods and instruments of the twin impingement jet mechanism. Figure 2 provides a flow chart of the numerical simulation setup used in this research work. Compressed air of 4 psi (0.275 bar) was supplied through the main compressor. The compressed air is stored in an air reservoir, where a ball valve controls the release. The moisture from the compressed air was then removed with the help of a refrigerated air dryer as mentioned earlier. A pressure gauge and regulator were used to manage the air pressure, which also helped to avoid any unwanted fluctuation due to cyclic on/off of the main compressor. The rated airflow was measured via a digital air flow meter (Model VA 420 procured from CS instruments). The air was made to pass through two identical pipelines before entering the twin jets impingement mechanism. A ball valve ensured control of each of the lines and the twin jets' identical flow properties.
heat flux-temperature foil detector were attached on the front of the aluminium foil with a heat sink compound of high conductivity and a Kapton tape to minimise the impact of the gaps of air between the aluminium surface and the sensor by Zulkifli (2009). The positions of the thermocouples and the heat flux sensor attached on the aluminium plate surface are illustrated in Figure 1 displays the setup of the nozzles for each model (9 cases). For the target of the jet impingement, a square aluminium plate of thickness L and surface dimensions given above was used.
Second, a digital air flow meter was installed in the TJIM to determine the steady jet flow’s flow rate and velocity, by keeping a constant temperature of 100 °C. In this experimental setup, Dantec Dynamic’s flow meter anemometer was used. Installation of the flow meter was undertaken between the twin impingement jet pipes, which pass through the refrigerated air dryer and twin jets. Next, an experimental run was conducted for the twin impingement jets by using the velocity obtained from the flow meter, and the Pitot tube was used to confirm this velocity. Then, the highest Reynolds number was attained, which permitted successive capturing of the heat transfer per unit time (q) with the help of the data logger and calculating the convective heat transfer coefficient (h), accounting for the units (W/(m²K)).
Third, with the help of differential pressure, the pressure difference was obtained in the form of an analogue, which was used as input for data acquisition Ni 6008. This was followed by transforming the signal and using the developed Scilab code as the value for the results. The differential pressure was set between the Pitot tube and Ni 6008 data acquisition.
jets, towards the aluminium foil), it achieves a steady heat transfer. Therefore, to reduce the likelihood of experimental error when using a heat flux-temperature sensor (for the measurement), a total of 4,050 samples were taken, in which the average value was considered. The researchers conducted a FESEM analysis for
assessing the structural and surface homogeneity. Also, for jet impingement heat transfer issues, fluid mechanics and heat transfer need to be considered. Before conducting the experiments, various constant parameters were maintained related to the TJIM as shown in Table 1 [9].
Fig. 1. Schematic of heat transfer tests for twin jets
Identification of principles, equations and requirements
Design a 3 Dimension model of twin jet (create geometry)
Run simulation using CFD software
Mesh generation
Set up
Solution
Results
Here, the researchers considered air as the working fluid, and the following assumptions were made regarding the flow characteristics:
Steady flow, 3D
Newtonian fluid
Incompressible fluid
Turbulent flow
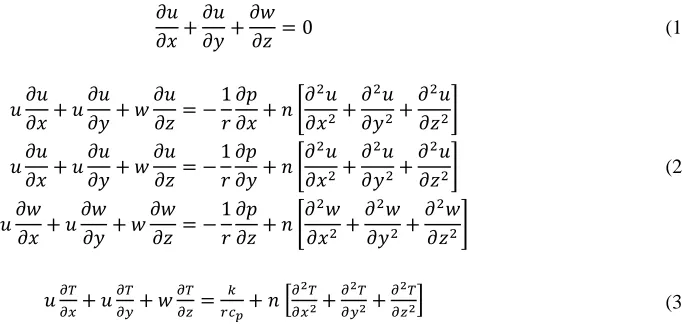
2.2 GOVERNING EQUATIONS:
The governing equations which had to be solved included the continuity, momentum, energy [18], [19] which are:
𝜕𝑢
𝜕𝑥+
𝜕𝑢
𝜕𝑦+
𝜕𝑤
𝜕𝑧 = 0 (1)
𝑢𝜕𝑢 𝜕𝑥+ 𝑢 𝜕𝑢 𝜕𝑦+ 𝑤 𝜕𝑢 𝜕𝑧= − 1 𝑟 𝜕𝑝 𝜕𝑥+ 𝑛 [
𝜕2𝑢
𝜕𝑥2+
𝜕2𝑢
𝜕𝑦2+
𝜕2𝑢
𝜕𝑧2]
𝑢𝜕𝑢 𝜕𝑥+ 𝑢 𝜕𝑢 𝜕𝑦+ 𝑤 𝜕𝑢 𝜕𝑧= − 1 𝑟 𝜕𝑝 𝜕𝑦+ 𝑛 [
𝜕2𝑢
𝜕𝑥2+
𝜕2𝑢
𝜕𝑦2+
𝜕2𝑢
𝜕𝑧2]
𝑢𝜕𝑤 𝜕𝑥+ 𝑢 𝜕𝑤 𝜕𝑦+ 𝑤 𝜕𝑤 𝜕𝑧 = − 1 𝑟 𝜕𝑝 𝜕𝑧+ 𝑛 [
𝜕2𝑤
𝜕𝑥2 +
𝜕2𝑤
𝜕𝑦2 +
𝜕2𝑤
𝜕𝑧2]
(2) 𝑢𝜕𝑇 𝜕𝑥+ 𝑢 𝜕𝑇 𝜕𝑦+ 𝑤 𝜕𝑇 𝜕𝑧= 𝑘 𝑟𝑐𝑝+ 𝑛[ 𝜕2𝑇
𝜕𝑥2+ 𝜕2𝑇
𝜕𝑦2+ 𝜕2𝑇
𝜕𝑧2] (3)
2.3 DESCRIPTION OF A NUMERICAL MODEL AND THE MATHEMATICAL FORMULATIONS:
2.3.1 Geometrical and Flow Description:
Fig. 3. Schematic diagram of the geometrical shapes of twin jets on the heated plate
2.4 Turbulence Models:
The most popular model used by several researchers included the K-epsilon (k-ε) model. This model could provide very accurate results, was affordable, easy to implement, provided reasonable predictions for the various flows, and was used for simulating the mean flow characteristics for the turbulent flow conditions [20]. This model was used for investigating the turbulent flow-related issues using different experiments and exercises.
This K-epsilon (k-ε) model is unique as it includes 2 transport equations that describe the turbulence, turbulent kinetic energy (k) and the turbulent dissipation rate (ε). After they are solved, the eddy viscosity (μt) can be
calculated as the function of k and ε. This model also includes the Boussinesq hypothesis, and due to its lower computational cost, it can be used for modelling the Reynolds stress term.
2.5 Fluent Software Package:
All flow equations can be solved using 2 modules:
1. Module 1 was a pre-processor module and included a program structure which used the ANSYS FLUENT for generating the geometry and the grid, for:
a. Modelling the geometry
b. Mesh generation
c. Boundary conditions
2. Module 2 was a ‘Solution’ module that was used for solving the Navier-Stokes equation (including momentum, continuity and energy equations) and the turbulent flow model.
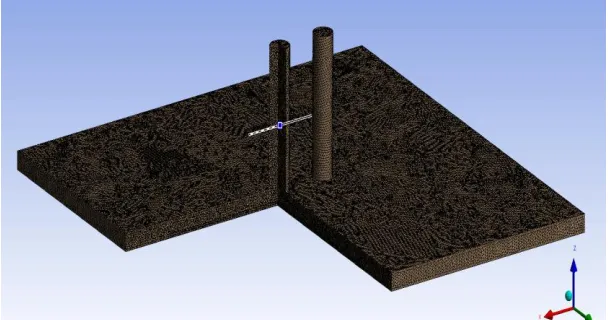
2.6 Mesh Generation:
Fig. 4. Tetrahedral mesh distribution
2.7 BOUNDARY CONDITIONS:
All boundary conditions were described for the surfaces of a computational domain. At the solid walls, the adiabatic boundary conditions have been applied while no-slip boundary conditions were used for a hot plate surface. The twin nozzles pass the coolant air. In all the cases, the following mainstream conditions were used:
1. Plate temperature = 100 °C. 2. Reynolds number (Re) = 17,000. 3. Dimension of plate = 0.3 × 0.3 × 0.04 m. 4. Nozzle diameters = 0.02 m.
5. Air temperature = 25 °C.
All boundary condition were considered symmetrical if: • No flow passed across the boundary
• No scalar flux was noted across the boundary. At a symmetrical plane and axis, no flux, either diffusive or convective, was noted at the boundary. Hence, the normal velocity component and the normal gradient at the remaining dependent variable were seen to be 0.
3. Results and discussion:
3.1 Mesh Resolution and Mesh Smoothness:
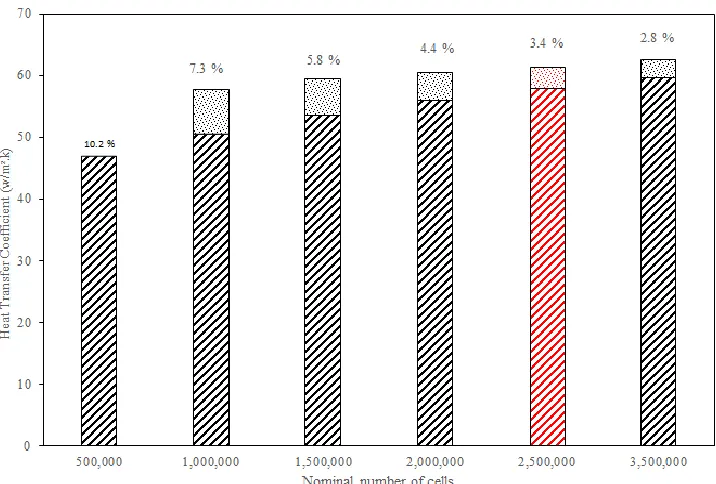
The researchers carried out a grid-dependence analysis by developing a grid having multiple cells, and then compared
the solutions of the models. When a grid refinement test was conducted for determining the mean static temperature on the hot surface, it was noted that the grid size of ≈2.5 million cells showed an adequate accuracy and resolution; hence, it was used as the standard for other models. The cell number must be higher in the areas where the flow properties changed significantly like the walls and were smaller in the non-critical zones. Figure 5 describes the cell number that was used for a grid independence meshing test and also presents the turbulence model that was used for the twin impingement jets in this model.
3.2 Total Cell Count:
Fig. 5. Nominal numbers of cells for grid independence meshing
Fig. 6. Turbulence models
In selecting an appropriate turbulence model, many factors may influence the final decision; this research has tested two turbulence models (k-ɛ and k-ω), to check the suitable model, k-ɛ has reasonable error around 2.5%, compared with 10.7% error percentage in k- ɛ, so the k-ɛ model has been chosen in the simulation process according to the accuracy in the values for k-ɛ, as shown in figure 6.
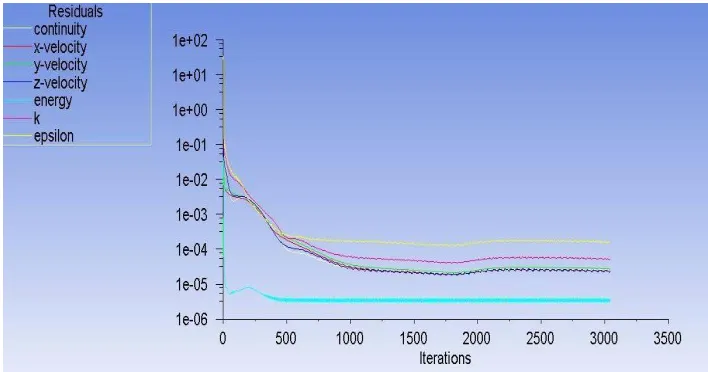
3.3 NUMBER OF ITERATIONS
Figure 7 shows the typical convergence history for the maximum number of iterations done before the solver terminated. In this case, 3000 iterations were performed.
Fig. 7. Number of Iteration for grid independence meshing
3.4 Model Validation:
In this study, the researchers used the RNG k-ε turbulence model for simulating the TIJM cases on an aluminium plate surface. This model was further validated with the help of the local Nu experimental results used for similar operational conditions and geometry. The comparison showed that the experimental results were in agreement with the computed distribution of this local Nu number, as shown in the figures described below (Local Nu number in the axial direction for 9 Models).
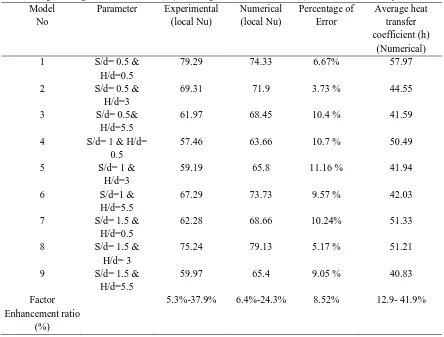
Table 2 presents the values for the distribution of local Nu on an aluminium surface for the models at
Table II
Error Percentage of average local Nusselt number (Nu) and average heat transfer coefficient (h) between numerical and experimental tests
Model No
Parameter Experimental
(local Nu) Numerical (local Nu) Percentage of Error Average heat transfer coefficient (h) (Numerical)
1 S/d= 0.5 &
H/d=0.5
79.29 74.33 6.67% 57.97
2 S/d= 0.5 &
H/d=3
69.31 71.9 3.73 % 44.55
3 S/d= 0.5&
H/d=5.5
61.97 68.45 10.4 % 41.59
4 S/d= 1 & H/d=
0.5
57.46 63.66 10.7 % 50.49
5 S/d= 1 &
H/d=3
59.19 65.8 11.16 % 41.94
6 S/d=1 &
H/d=5.5
67.29 73.73 9.57 % 42.03
7 S/d= 1.5 &
H/d=0.5
62.28 68.66 10.24% 51.33
8 S/d= 1.5 &
H/d= 3
75.24 79.13 5.17 % 51.21
9 S/d= 1.5 &
H/d=5.5
59.97 65.4 9.05 % 40.83
Factor Enhancement ratio
(%)
5.3%-37.9% 6.4%-24.3% 8.52% 12.9- 41.9%
3.5 CONVECTIVE HEAT TRANSFER:
The researchers carried out numerical simulations using an RNG k-ε model for investigating the cooling process on a flat plate that was heated with an electrical heater in all 9 TJIM models. These models showed a varying jet-jet spacing (S/d) = (0.5, 1 and 1.5), jet-plate distance (H/d) = (0.5, 3 and 5.5) and a fixed Reynolds number of 17,000. They also studied the effect of the jet’s position on the mean Nu and heat transfer coefficient (h), based on the jet-jet and the jet-jet-plate distance.
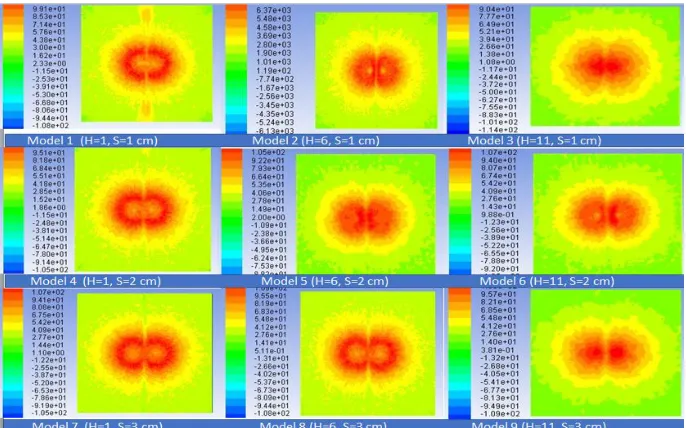
Figure 8 presents the distribution of Nu on the aluminium surface for the various TJIM models, at a Reynolds number of 17,000. Temperature distribution on the flat surface was noted for various models with the
Fig. 8. Contour of surface heat transfer coefficient at different models. (a) S/d = 0.5 and H/d = 0.5 (b) S/d = 0.5 and H/d = 3 (c) S/d = 0.5 and H/d = 5.5. (d) S/d = 1 and H/d = 0.5 (e) S/d = 1 and H/d = 3 (f) S/d = 1 and H/d = 5.5 (g) S/d = 1.5 and H/d = 0.5 (h) S/d = 1.5 and H/d = 3 (i) S/d = 1.5 and H/d =
5.5
a. Model (1) Nozzle-Nozzle Spacing (S/d) = 0.5, and Nozzle-Plate Distance (H/d) = 0.5:
In Model 1, with a nozzle-nozzle distance (S/d) of 0.5, and a nozzle-plate distance (H/d) of 0.5, the contours of the predicted static temperature for a k-ε model in Model 1, which displayed the contours of the total temperature, were described in Figures 9-10. Figure 9 presents the thermal distribution of a hot plate, wherein the Nu was high in the centre of the plate surface and decreased gradually away from the plate centre. A high-temperature region was noted on the surface of the plate where a strong recirculation air flow was noted that resulted from twin jets under high velocity. Other models, presented in the other figures, showed similar results. This model showed a Heat Transfer Coefficient (h) of 57.97 (W/m2·K).
Fig. 9. Local Nusselt number in the axial direction at Model 1
Figure 9 presents the distribution and characteristics of the local Nu. The peaks in the magnitude of fluctuation occurred at the various stagnation points of twin jets, which decreased away from all the stagnation points.
Figures 10-11 described the velocity vectors and the temperature contours in all the models. They presented
seen that the changing flow directions and the swirls that were generated increased the disturbances which subsequently increased the heat transfer coefficient and Nu.
The resultant temperature of the plate surface was 100 °C when the Reynolds number was 17,000.
Fig. 10. Static temperature contours of the twin jets impingement on the aluminium hot plate at S/d = 0.5 and H/d = 0.5
Fig. 11. Velocity vectors coloured by the velocity magnitude for the twin impingement jet mechanism at the Nozzle-Nozzle spacing equal to 0.5 and the Nozzle-Plate distance equal to 0.5
b. Model (2) Nozzle-Nozzle Spacing (S/d) = 0.5 and the Nozzle-Plate Distance (H/d) = 3
Fig. 12. Local Nusselt numbers in the axial direction at Model 2
Figure 13 presents the combined plot of all velocity vectors, which were coloured and based on the velocity magnitude of Model 2. This figure showed that the air flow on the heated flat plate surfaces and the resultant turbulence on the aluminium plates occurred when the jets were closer to the plate surface. The flow direction also changed and the swirls were generated, which increased the disturbance that further increased the heat transfer coefficient and the Nu value. In this model, the surface heat transfer coefficient (h) was 44.55 (W/m2·K).
Fig. 13. Velocity vectors coloured by the velocity magnitude for the TJIM at the Nozzle-Nozzle spacing = 0.5 and the Nozzle-Plate distance = 3
c. Model (3) Nozzle-Nozzle Spacing = 0.5 and the Nozzle-Plate Distance = 5.5
Model 3 showed the nozzle-nozzle distance (S/d) of 0.5, and nozzle-plate distance of 5.5. The Nu values were higher in the centre of the plate’s surface, which decreased significantly away from the plate centre. This high-temperature region was located at the surface of the plate when there was a strong recirculating air flow which originated from the twin jets at high velocity. In this model, the surface heat transfer coefficient (h) was 41.59 (W/m2·K). Figure 14 depicts the local Nu
Fig. 14. Local Nusselt number values in the axial direction at Model 3
Figure 15 depicts the velocity vectors, which were coloured based on the velocity magnitude of the cooling process of the plate surfaces of the twin impingement jets for Model 3, wherein the nozzle-nozzle distance was 0.5 and nozzle-plate distance was 5.5. A high-temperature region was noted on the surface of the plate where a strong re-circulating air flow arose from the twin jets under high velocity.
Fig. 15. Velocity vectors coloured by the velocity magnitude for the twin impingement jet mechanism at the Nozzle-Nozzle spacing equal to 0.5 and the Nozzle-Plate distance equal to 5.5
d. Model (4) Nozzle Spacing=1 and Nozzle-Plate Distance= 0.5
In Model 4, the nozzle-nozzle distance was 1, while the nozzle-plate distance was 0.5. Figure 16 showed that the local Nu values were high in the centre of the plate’s surface, and then decreased gradually when the distance was increased from the centre of the plate. The Nu number
of the air flow reflected the behaviour of this air flow and the heat transfer characteristics on the plate. This result indicated that the flow direction changed and the swirls were generated, which further increased the disturbances that increased the Nu. The surface heat transfer coefficient was 50.49 (W/m2·K) in this model. Figure 17 describes the
Fig. 16. Local Nusselt number values in axial direction at Model 4
Fig. 7. Velocity vectors coloured by velocity magnitude for twin impingement jet mechanism at Nozzle-Nozzle spacing equal 1 and Nozzle-Plate distance equal 0.5
e.
Model (5) Nozzle-Nozzle Spacing= 1 and Nozzle-Plate Distance= 3In Model 5, the nozzle-nozzle distance was 1, while the nozzle-plate distance was 3. Figures 18-19 presented the velocity vectors on an aluminium plate surface, which indicated that the flow direction was changed and the swirls were noted. The arrangement of the jet determines the turbulence intensity of the air flow, which further reflected the behaviour of the fluid flow and the heat transfer characteristics on the aluminium plate. An increase in the turbulence increased the heat transfer coefficient. The surface heat transfer coefficient was 41.94 (w/m2.k) in the model. The Nu number distribution was further
Fig. 18. Local Nusselt number values in axial direction at Model 5
Model 5 presented the combined distribution of the velocity vectors when the plate distance was 3 and the nozzle-nozzle distance was 1. A high-temperature zone was seen on the flat surfaces when a strong velocity of twin jets and strong turbulence was noted on the aluminium plates when the jets were closer to the plate’s surface.
Fig. 19. Velocity vectors coloured by velocity magnitude for twin impingement jet mechanism at Nozzle-Nozzle spacing equal 1 and Nozzle-Plate distance equal 3.
f. Model (6) Nozzle-Nozzle Spacing = 1 and Nozzle-Plate Distance= 5.5
Distribution of the velocity vectors on the surface of the plate was investigated and it was seen that the turbulence intensity of the air flow reflected the behaviour of the fluid flow and the heat transfer characteristics on the plate surface. Model 6 included the nozzle-nozzle distance of 1 and the nozzle-plate distance of 5.5. The arrangement of
heat transfer coefficient (h) was 42.03 (W/m2·K). Figures
Fig. 20. Local Nusselt number values in axial direction at Model 6
Fig. 21. Velocity vectors coloured by velocity magnitude for twin impingement jet mechanism at Nozzle-Nozzle spacing equal 1 and Nozzle-Plate distance equal 5.5
g. Model (7) Nozzle-Nozzle Spacing= 1.5 and Nozzle-Plate Distance=0.5
Model 7 showed the nozzle-nozzle distance of 1.5 and nozzle-plate distance of 0.5, which represent the velocity vectors and the temperature contours. Figures 22-23 present the results for Model 7, wherein they describe the velocity vectors of the static temperature for the cooling process in the TIJM. In this model, the Nu ranges between 30 and 110 (W/m2·K).
The value of the surface heat transfer coefficient was 51.33 (w/m2. k). The results indicated the presence of a strong
Fig. 22. Local Nusselt number values in axial direction at Model 7
Fig. 23. Velocity vectors coloured by velocity magnitude for twin impingement jet mechanism at Nozzle-Nozzle spacing equal 1.5 and Nozzle-Plate distance equal 0.5.
h. Model (8) Nozzle-Nozzle Spacing= 1.5 and Nozzle-Plate Distance= 3
In Model 8, the nozzle-nozzle distance was 1.5, while the nozzle-plate spacing was 3. Figure 24 presents the local Nu value in the axial directions, while Figure 25 described the velocity vectors that were coloured based on the velocity magnitude for the twin impingement jets in Model 8. The contours of the static temperature were presented for a k-ε model used in Model 8. This figure indicated that the air flow occurring on the heated flat surface of the plate along with the turbulence on this aluminium plate took plate when the twin jets were near the surface of the plate. Furthermore, the flow direction also changed and swirls
were generated. A high-temperature region was located on the plate’s surface, wherein a strong re-circulating air flow arose from the twin jets under a higher velocity. The temperature was seen to be 100 °C, while the Surface heat transfer coefficient (h) was 51.21 (W/m2.K). Figure 25
Fig. 24. Local Nusselt number values in axial direction at Model 8
Fig. 25. Velocity vectors coloured by velocity magnitude for twin impingement jet mechanism at Nozzle-Nozzle spacing equal 1.5 and Nozzle-Plate distance equal 3.
i. Model (9) Nozzle-Nozzle Spacing= 1.5 and Nozzle-Plate Distance= 5.5
In Model 9, the nozzle-nozzle distance was 1.5, while the nozzle-plate spacing was 5.5. The results indicated that the Nu value was higher in the centre of the plate surface, which then continued to increase for the next 3 points, and thereafter, it decreased as the distance increased from the centre. A high-temperature region was noted on the surface of the plate where strong circulating air flow was seen that originated from the twin jets under higher velocity. The value of the surface heat transfer coefficient was 40.83 (W/m2.K). Figure 26 showed the distribution of Nu at different points with respect to the
swirls, which highlighted the effect of the vortices. It described the local Nu distribution on the flat surface of the plate. The contour distribution of the axial temperature was in agreement with the heat transfer coefficient and the flow behaviour. A high-temperature area was seen on the surface of the plate wherein a strong recirculating air flow was noted that originated from the twin jets under high velocity as shown in figure 27.
Fig. 27. Velocity vectors coloured by velocity magnitude for twin impingement jet mechanism at Nozzle-Nozzle spacing equal 1.5 and Nozzle-Plate distance equal 5.5
The Nu values were seen to increase/ decrease with regards to the distance between the nozzles or nozzle and plate [21]. The results were more logical in comparison to others. Furthermore, when the steady or impinging twin jets were placed near the hot plate surface, the centre line of the interference zone passes through the twin jet holes at the edge of the surface plate. In this section, the experimental results were presented. The figures showed the effect of the TJIM on the plate surface temperature. As shown in the figures, the initial 4-5 points showed an obvious increase in the temperature of the plate surface that then gradually decreased after the distance measured by the 5 points. It was seen that the TJIM could affect the heat transfer coefficient at the centre or the midpoint between the twin jets that pass to the end of the interference zone at the terminal aluminium plate surface. The above figures showed the effect of the Nu on the simulation results. The observed Nu decreased with an increase in the distance between the centre of the plate to the edge of the surface (low rates were seen at the distant points which were away from the centre of the plate). This was in agreement between the simulation and experimental results, wherein an increase in the heat transfer rate was noted until the twin jets were closer to the surface of the plate. This was especially noted when the twin jet flow directly affected the surface. As shown in the figures about the Nu distribution, the heat transfer showed a gradual decrease when the distance increased between the stagnation points. This difference was very evident at other parameters like the increase or decrease in the distance between the nozzles or nozzle and plate. An apparent air mixing was noted in the intersection region between the nozzles, and there was a measured area which indicated the direct effect of the air originating from the nozzles. This decreased when the distance between the nozzles and the nozzle-plate increased. This result was accredited to the vortex
turbulence. This mixing of the air can decrease the temperatures of the wall jets and increase the heat transfer rate by increasing the temperature difference between the hot plate surface and the wall-jet air, at the centre of the interference zones [23].
4.CONCLUSIONS
However, there are still many areas that need to be addressed in this field. The results of these studies will assist to provide a clearer view of heat transfer enhancement, applicable to many applications. Among the issues that need to be further examined. Though there are some areas that need to further exploration such as there is a deficiency in the information about the behaviour of vortices formed. Thus, we suggest that this topic is investigated by using visualization techniques, such as particle image velocimetry, and a high-speed camera. Furthermore, the impact of using Nanofluid and Nano coating applications as (CNT, AL2O3, ZNC, CU, TiO2 etc.)
on the heat transfer rate and flow characteristics in different applications.
ACKNOWLEDGMENTS
We are thankful to the Universiti Kebangsaan Malaysia and
Ministry of Higher Education Malaysia,
FRGS/1/2018/TK03/UKM/02/2 for providing the financial supports and Prof. Dr. Faris Abdullah Aljanaby.
Author Contributions: Mahir Faris Abdullah, Designed the experiments, analyzed the data and wrote the paper, Humam Kareem Designed the simulation and meshing. Rozli Zulkifli, Zambri Harun, W. Ghopa. and Shahrir Abdullah, contributed materials, Editing, and supervision. Conflicts of Interest: The authors declare no conflict of interest.
REFERENCES
[1] J. Taghinia, M. M. Rahman, and T. Siikonen, “CFD study of turbulent jet impingement on curved surface,” Chinese J. Chem. Eng., vol. 24, no. 5, pp. 588–596, 2016.
[2] C. Wang, L. Luo, L. Wang, and B. Sundén, “Effects of vortex generators on the jet impingement heat transfer at different cross-flow Reynolds numbers,” Int. J. Heat Mass Transf., vol. 96, pp. 278–286, 2016.
[3] X. Bu, L. Peng, G. Lin, L. Bai, and D. Wen, “Jet impingement heat transfer on a concave surface in a wing leading edge: Experimental study and correlation development,” Exp. Therm. Fluid Sci., vol. 78, pp. 199–207, 2016.
[4] A. A. Gitan, R. Zulkifli, K. Sopian, and S. Abdullah, “Twin Pulsating Jets Impingement Heat Transfer for Fuel Preheating in Automotives,” Appl. Mech. Mater., no. 663, 2014. [5] K. Choo, B. K. Friedrich, A. W. Glaspell, and K. A. Schilling,
“The influence of nozzle-to-plate spacing on heat transfer and fluid flow of submerged jet impingement,” Int. J. Heat Mass Transf., vol. 97, pp. 66–69, 2016.
[6] Mahir Faris Abdullah, Rozli Zulkifli, Zambri Harun, Shahrir
Mechatronics Eng., vol. 17, no. 6, p. 16, 2017.
[10] M. Attalla, H. M. Maghrabie, and E. Specht, “Effect of inclination angle of a pair of air jets on heat transfer into the flat surface,” Exp. Therm. Fluid Sci., vol. 85, pp. 85–94, 2017. [11] I. M. Myung KiSung, “Experimental and numerical
investigation of single-phase heat transfer using a hybrid jet-impingement/micro-channel cooling scheme,” Int. J. Heat Mass Transf., vol. 49, no. 3–4, 2006.
[12] A. Abdel-Fattah, “Numerical and experimental study of turbulent impinging twin-jet flow,” Exp. Therm. Fluid Sci., vol. 31, no. 8, pp. 1061–1072, 2007.
[13] D. Zhang, H. Qu, J. Lan, J. Chen, and Y. Xie, “Flow and heat transfer characteristics of single jet impinging on protrusioned surface,” Int. J. Heat Mass Transf., vol. 58, no. 1–2, pp. 18–28, 2013.
[14] Z. X. Wen, Y. L. He, X. W. Cao, and C. Yan, “Numerical study of impinging jets heat transfer with different nozzle geometries and arrangements for a ground fast cooling simulation device,”
Int. J. Heat Mass Transf., vol. 95, pp. 321–335, 2016. [15] M. Draksler, B. Končar, L. Cizelj, and B. Ničeno, “Large Eddy
Simulation of multiple impinging jets in hexagonal configuration – Flow dynamics and heat transfer characteristics,” Int. J. Heat Mass Transf., vol. 109, pp. 16–27, 2017.
[16] P. A. K. Lam and K. A. Prakash, “A numerical investigation and design optimization of impingement cooling system with an array of air jets,” Int. J. Heat Mass Transf., vol. 108, pp. 880– 900, 2017.
[17] Zambri Harun, Suang NJ, M. Faizal W. Mahmood, Mahir Faris Abdullah, Eslam Reda “Computational Fluid Dynamics Simulation on the Heat Sink of the Graphics Processing Unit Thermal Management,” Jurnul kejuretraan, 31(1) 2019: 139-147, 2019.
[18] H. K. Versteeg and W. Malalasekera, An Introduction to Computational Fluid Dynamics The Finite Volume Method, vol. 572. 1996.
[19] D. Roy, Applied Fluid Mechanics. Affiliated East-West Private LTD, New Delhi., 1987.
[20] A. S. L. Theodore, L Bergman, F. P. Incropera, and David P Dewitt, Fundamentals of Heat And Mass Transfer. United States of America, 2011.
[21] Mahir Faris Abdullah, Rozli Zulkifli, Zambri harun, Shahrir abdullah, and W. A. Ghopa, “Experimental and Numerical Simulation of the Heat Transfer Enhancement on the Twin Impingement Jet Mechanism,” Energies 2018, 11(4), 927. [22] M. F. Abdullah, R. Zulkifli, Z. Harun, S. Abdullah, W. A. W.
Ghopa, and A. A. Abbas, “Experimental Investigation on Comparison of Local Nusselt Number Using Twin Jet Impingement Mechanism,” Int. J. Mech. Mechatronics Eng., vol. 17, no. 4, pp. 60–75, 2017.
[23] M. F. Abdullah, R. Zulkifli, Z. Harun, and S. Abdullah, W. Aizon. W. Ghopa, A. S. Najm, N. H. Sulaiman, “Impact of the TiO2 Nanosolution Concentration on Heat Transfer