Sudden
Infant
Death
Syndrome:
Sleep.
Apnea
and
Respiration
in Subsequent
Siblings
Toke Hoppenbrouwers, PhD, Joan E. Hodgman, MD,
Dennis McGinty, PhD, R. M. Harper, PhD, and
M.
B. Sterman, PhDFrom the Newborn Division of the Los Angeles County-University of Southern California Medical Center; Department of Pediatrics, University of Southern California School of Medicine; Sepulveda Veterans Hospital; Departments of Anatomy,
Psychiatry, and the Brain Research Institute, University of California, Los Angeles
ABSTRACT. Subsequent siblings of infants who died of
the Sudden Infant Death Syndrome are at a four- to
six-times increased risk to die of this syndrome. This study
compares the respiratory development during sleep state
of this epidemiologic high risk group with that of normal
infants during the first six months of life. Subsequent
siblings exhibited higher respiratory rates in all states at 3 months of age. Quiet sleep and indeterminate respira-tory rates were elevated at 1 week of age compared to control infants. Indeterminate respiratory rates remained
higher at 6 months of age. These differences were accom-panied by a reduced incidence of total breathing pauses
of two to five seconds and six to nine seconds duration in
siblings. Study groups could not be differentiated on the basis of either breathing pauses of more than ten seconds
or central apnea of six seconds or more. Obstructive and
mixed apnea (6 seconds or more) were infrequently
ob-served in these study groups. A high degree of
intersub-ject variability characterized all data on breathing pauses. Pediatrics 66:205-214, 1980; sudden infant death
syn-drome, sleep apnea, respiration, subsequent siblings.
Sudden infant death syndrome (SIDS) is the leading cause of infant mortality beyond the
neo-natal period in the United States.’ Scientific
inves-tigation of SIDS is hampered by the difficulty in identifying appropriate populations for study.
Frog-gatt et al2 reported that subsequent sibings of SIDS were at a four- to fivefold statistically increased risk
to die of SIDS. A recent study by Peterson et al3 confirmed the increased risk for this population.
Received for publication Aug 24, 1979; accepted Nov 29, 1979.
Reprint requests to (T.H.) Director, Sudden Infant Death
Syn-drome Research Project, Room 4L40B, Women’s Hospital,
LAC-USC Medical Center, 1240 N Mission Rd, Los Angeles, CA
90033.
PEDIATRICS (ISSN 0031 4005). Copyright © 1980 by the
American Academy of Pediatrics.
Whereas, in siblings the absolute risk of dying of
SIDS is below 2% so that the risk for the individual
infant is small, this group could provide clues to the
potential mechanism of SIDS and was therefore selected for study.
The highest risk for SIDS is between 2 and 3
months of age.’
Infants
die
during normal sleepinghours in 88% of the caseS.4 Thus, the variables of age and sleep are strongly related to SIDS. In adults, the cumulative effects of sleep apnea may
result in hypoxia leading to elevated pulmonary
arterial
pressure,
cor pulinonale, and sudden death.5Consequently, it has been proposed that an in-creased incidence of sleep apnea may characterize
high risk infants during the first months of life.6’7
We have monitored sleep and cardiopulmonary
variables
in subsequent
siblings of SIDS. Prelimi-naryfindings
indicated that these infants exhibited a decreased number of apneic episodesaccompa-nied by increased respiratory rates.8 The objective of this study is to provide complete data on
respi-ratory rates and apnea in control infants and sub-sequent siblings of SIDS during the first half year of life.
METHODS
Material and Monitoring Procedures
Selection criteria for 25 control subjects included the absence of both maternal disease and familial
incidence of SIDS. The experimental group con-sisted of 26 infants born to women who had lost an
infant to SIDS as confirmed by autopsy reports.
The two groups were homogeneous and comparable with respect to socioeconomic status, as estimated
by level of parental education. The experimental
26.10 3.64 20 1 2 2 2.84 1.43 2.48 1.19 3,575 465 2,890-4,550 40.78 1.64 37-44 8.52 1.64 9.28 0.54 26 26.45 5.06 21 0 2 3 3.13 0.90 1.92 0.83 3,594 496 2,821-4,593 40.06 1.31 38-42 8.14 1.04 9.04 1.04 19
TABLE 1
.
Characteristics of the Study GroupsControl Subsequent Subjects Siblings Maternal age Mean SD Maternal race White Black Asian American Mexican American Gravida Mean SD Parity Mean SD
Birth weight (gm)
Mean SD
Range
Gestational age (weeks)
Mean
SD
Range
Apgar at 1 mm
Mean SD
Apgar at 5 nun Mean SD
Respiratory infections at
time of monitoring
control group had nine girLs and 16 boys. A furthet description of the study groups is provided in Table 1. All infants were monitored on six occasions,
dur-ing the first week and at 1, 2, 3, 4, and 6 months of
age. Informed consent was obtained prior to each monitoring session. Ages at time ofmonitoring were
comparable in the two study groups.
Each infant was admitted at 5:00 PM to the sleep
laboratory
for 12-hour all night monitoring sessionsduring the first week of life and at 1, 2, 3, 4, and 6
months of age. The infants were fed during prepa-ration for monitoring and application of electrodes.
A demand
feeding
schedule was followed and inseveral instances the infants were breast-fed. Arm
restraints
were applied before the initiation ofre-cording.
Monitoring was carried out in a darkened room adjacent to the room containing recording equipment. Room temperatures ranged between 22 C and 30 C. The infants were placed in a supine orside-lying position and observed continuously with the use of a low ifiumination television camera and
monitor.
Behaviors
such as closing or opening ofthe eyes, startles, crying, and nursing interventions
were charted on the polygraph paper.
Physiologic Recording Methods
The sleep variables recorded included two EEG derivations, a chin electromyogram (EMG), and eye
movements. Thoracic or abdominal excursions were
monitored by impedance pneumography. In addi-tion, a Beckman PCO2 monitor sampled expired gas
through a two-pronged miniature cannula taped under the infant’s nostrils. In order to adjust for the
time lag inherent to this instrument, the phase of
respiration was simultaneously detected with a
thermistor placed into one arm of the cannula. The
ECG was recorded with two disposable electrodes
placed symmetrically beneath the clavicles. A ground electrode was applied above the umbilicus. Additionally, a skin temperature probe was applied to the abdomen below the right costal margin.
Electrodes on the mattress surface under the crib sheet registered the infant’s gross body move-ments.9
Data were recorded on a 16-channel Grass model 76 polygraph and simultaneously stored on a 14-channel Honeywell analog tape recorder together
with an IRIG E time code.
Data Analysis
Each minute of the record was coded as either
active sleep (AS), quiet sleep (QS), awake (AW), or
indeterminate (IN). Scoring criteria have been re-ported elsewhere.’#{176}’2
The entire data set for each infant was digitized on a PDP-12 laboratory computer and the PCO2
signal submitted to a breath-to-breath interval
de-tection program. This signal was selected for its
reliability and resistance to movement artifacts. Feeding and sometimes crying characterized wak-ing. When the infant cried for an extended period, the PCO2 respiratory tracing occasionally
disap-peared
entirely, indicating a complete shift tomouth breathing. The resulting long respiratory
pause would give erroneous results. To deal with this problem, long episodes of crying were deleted
from the analysis (0% to 10%). The respiratory signal was almost always preserved (although with
lower amplitude) throughout short cries and vocal-ization and could thus be calculated. The use of
median rather than mean values provided some
degree
of
protection against aberrant data as well. In all cases, the polygraphic Eecords and, inpartic-ular, the chart notations and the impedance respi-ratory signal, provided final reference for artifact evaluation. Median respiratory rates per minute
were obtained and mean values for each defined
sleep and waking state were determined.’3 The
mm-ute-by-minute
interquartile range was selected as ameasure of respiratory variability. Details of these
procedures were published previously.’4
Apnea and short breathing pauses were tabulated in three ways. First, the initial 18 recorded tracings
f .
‘1
L
R.
EYE
S0MCt
IMP
.V
.
-
10IIIIII(II1.IIIIII(tItIIIIIlIIIIIIIIIIIIIIIIlIIfIIIIII1IIIIIIIItIIIII(fIIlIIIIIl IL.IIhIIIlItIIIIIII I I I IIIIIIIiII IIiiIIiii iiIiIIIIIiiIiiiiiiIi IIIiiIIIIIiii,IlIlitilIIii.IiII.iiIiiiiiIIiIiiI, I I iI
L. EEG
R. EEG
EYE MOV.
vg-v
SOMCt
- ..
C...,1ltIlIhIIHt..h,.
‘“
.\y,
.‘\y, ‘‘\\\‘l\ \\\‘““‘
‘ s” II ‘t’of apnea in a 3-month-old infant in active sleep. The first
apnea is a mixed apnea. This segment illustrates the
difficulty in determining the exact duration of an apneic
episode. The second pause, of central origin, seems to be
interrupted by a shallow breath. The third pause appears
to contain an obstructive component, although the
therm-istor and Pco2 tracing provide somewhat conflicting
in-formation about air flow. Finally, the fourth pause (<6
seconds) is of central oi,gin. All pauses were preceded by
a deep breath.
Fig I
.
Top, Obstructive apnea in 3-month-old infant.Respiratory movements, evidenced in the impedance
tracing (IMP), were not accompanied by air flow, as can
be seen in the thermistor and Pco2 tracing. This sample
(100 seconds) was taken during active sleep. Motility was
limited to phasic twitches (see EMG) and did not
pre-dude identification ofwhat appeared to be an obstructive
component, following a central apnea of almost seven
seconds. Note that a heart rate below 100 beats per minute was observed twice, once following the obstructive
apnea and once not preceded by an apnea. Bottom, Series
Visually scanned for the presence of central apnea equal
to
or in excess of six seconds duration. The method has been described in detail previously.” Secondly, this study was replicated in 14 differentsubsequent siblings and ten different controls. In these latter recordings, apnea with a clearly ob-structive component and mixed apnea were identi-fled as well. Occasionally an initial
cessation
of air movement as measured by expiratory CO2 will be accompanied by identifiable respiratory excursions.We designated this
pattern
as obstructive
apnea of the unequivocal variety (Fig 1). In none of these episodes could mouth breathing be ruled out, butannotations by the nurses such as “grunting,
breathing
through the nose, noisy respirations”aided
in ruling
out false-positives. The actual inci-dence of obstructive episodes islikely
to be lower than reported here. Fig 1, bottom, represents amixed
apnea.
Finally,
the recordings
of all subjects
identification of breathing pauses involved measurement
between points e and f. Note that this interval is
approx-imately one second longer than the two former (a-b, c-d).
The interval g-h reflects the lag time between the respi-ratory cycle from a nasal thermistor and the Pco, signal.
AS OS
60
50
40
30
20
10
60
50
40
30
20
10
IN
0.0 00
AW
#{149}#{149}%%.._
-- -- Siblings (N25) - Controls (N =25)
6mo (st)
4R ‘, , -
i
I ISgt
4 )
\prj
jlI vsss( b
TIME IN SECONDS #{149} .. . . . . . . . . . #{149}
Fig 2. Measurement of breathing pauses. In a previous
study,” apneic episodes were identified through visual inspection of three respiratory tracings. The intervals
a-b
in the Pco tracing and c-d in the impedance tracinghad to be equal to or exceed six seconds. Computer
2mo 3rno 4rio 6mo lwk Imo 2mo 3mo
AGE
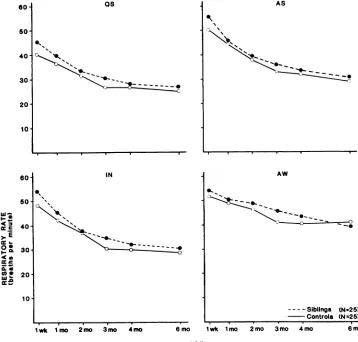
Fig 3. Median respiratory rate (ordinates) in breaths per minute as a function of age
(abscissae) in various states. Group means are based on 25 infants. At 3 months of age,
siblings breathed faster in all states.
aimed at identifying breathing pauses equal to or
longer than three seconds duration in each sleep state. Identification of the onset and termination of a breathing pause is fraught with problems,
espe-cially
when more than one respiratory signal is usedto define a pause. Fig 2 provides three respiratory tracings, an estimate of the length of a breathing
pause based upon criteria used for visual
identifi-cation
of apnea, and the computer-derived breath-ing pause based on peak-to-peak measurements ofthe PCO2 signal. The latter technique, while reliable,
tends to overestimate the duration of a pause by one second, compared to visual inspection criteria.”
Duration categories will be arbitrarily adjusted to
criteria
of
visualinspection:
short,
2, 3, 4, and 5seconds
duration; medium, between 5 and 9 sec-onds; and long, equal to or in excess of 10 seconds. Since the Pco2 signal was used, this computerstrat-egy did not differentiate between, but included, central, mixed, and obstructive pauses.
the number of minutes spent in each state. The resulting value was multiplied by 100 to obtain a
density score in percent. An analysis of variance
with the factors of age and experimental group was used to examine developmental trends and study group differences. A Tukey test was used to assess
differences between individual means.’5
RESULTS
Respiratory Rates
Rates in both study groups declined sharply
be-tween birth and 2 months of age in each state, as previously reported in control infants.’4 Respiratory rates continued to decrease up to 3 months of age
and leveled out thereafter. Group means for each
age and state are shown in Fig 3.
The mean, standard deviation, and range of me-dian respiratory rates in both study groups at each
age are provided in Table 2. Subsequent siblings breathed significantly faster than control infants in all states at 3 months of age. During the first week
of life, the QS and IN respiratory rates were also
elevated. Finally, at 6 months of age the IN respi-ratory rates of subsequent siblings remained higher
than those of controls (Table 2).
Median respiratory rates of individual infants at
1 and 3 months of age during quiet sleep are plotted in Fig 4. This figure illustrates the shift toward
faster respiratory frequencies in the subsequent
siblings
with
less overlap in study groups at 3 months compared to 1 month of age. Consequently, a statistically significant difference in QS meanswas limited to 3 months of age. The infants who contributed most to the shift in distribution at 3 months of age are not identical to the ones at 1
month of age.
A developmental decline in respiratory variabifity
paralleled
that
in respiratory
rate
(Fig
5). Breathingwas most variable during the waking state across the entire age span in both study groups. Variabifity was least during QS. The values of AS and IN were indistinguishable at all ages. Siblings exhibited a higher degree of variabifity in breathing, but
differ-ences were limited to QS variabifity at 1 week of
age (P = .034) and QS and IN variability at 3
months of age (P = .023 and .030).
TABLE 2. Mean, Standard Deviation,* and Range ofRespiratory Rates (Breaths per Minute) as a Function of Study
Group, Age, and Sleep State
Qui et Sleep Acti ye Sleep Indeterminate Awake
Control Siblings Control Siblings Control Siblings Control Siblings
Subjects Subjects Subjects Subjects
1 week
Mean 38.88 48.23 50.95 56.05 48.09 54.37 49.13 51.43
SD 7.68 13.18 10.76 11.19 13.13 13.01 9.58 10.55
Range 26.6-59.2 29.3-78.1 36.0-74.7 36.5-73.7 35.7-75.0 34.1-75.1 40.4-70.7 38.4-83.3
P value .003 .. . .039 ...
1 month
Mean 36.23 39.16 44.83 46.72 43.22 45.68 48.62 50.14
SD 6.98 7.14 7.29 8.03 7.19 9.60 5.71 7.91
Range 30.4-46.0 30.3-51.5 33.2-55.1 33.4-56.0 32.0-53.7 34.2-57.2 40.7-58.7 43.1-64.0
Pvalue ... ... ... ...
2 months
Mean 31.73 33.92 38.00 39.20 35.73 37.90 44.33 48.44
SD 5.62 5.64 6.14 5.20 6.57 6.84 8.07 10.48
Range 24.0-39.2 23.9-45.1 29.7-49.0 28.6-48.8 27.8-52.2 23.5-53.0 35.9-55.3 36.4-81.0
Pvalue ... ... ... ...
3 months
Mean 26.73 31.10 33.45 36.13 30.55 35.29 39.87 45.29
SD 4.07 4.65 5.11 5.89 5.28 7.69 6.52 8.26
Range 21.3-33.2 24.1-37.1 26.4-42.0 27.6-48.1 23.0-39.7 24.9-46.7 32.0-59.4 32.9-54.8
P value .001 .028 .001 .004
4 months
Mean 26.23 28.33 32.16 33.79 30.06 32.56 38.80 41.81
SD 3.64 5.44 4.66 6.26 4.72 7.74 6.77 10.34
Range 21.7-33.3 19.6-39.8 26.3-38.4 24.7-48.6 24.4-40.4 23.4-52.6 31.3-60.5 26.5-58.2
Pvalue ... ... ... ...
6 months
Mean 25.57 27.14 30.05 31.20 28.25 30.44 39.32 39.64
SD 4.84 3.83 5.63 4.51 5.24 4.82 9.25 8.12
Range
19.4-34.2
23.0-34.9 22.2-44.7 26.4-39.1 22.3-41.9 23.6-38.6 32.2-63.4 22.7-56.4Pvalue ... ... .026 ...
.
.
.
g00 - .e ?
cSCO
S
.
.
.
.
.
.
.
#{149},
I
#{149}#{149}
.
.
.
#{149}. 0,:
.
.S
.
U)
e1
.gS
-:1:
#{149}
:.
I-:#{149}
z
z
..-.0
#{149}
0
#{149} ()
#{149}
#{149}.
#{149}
#{149}
#{149}
#{149}
#{149}
#{149}#{149}
‘IIz::
I.
#{149}
#{149}:
:
#{149} g
#{149}
.
#{149}
.1
ce
#{149}:
0 c’
le
$
#{149}
.
#{149}#{149}
#{149}
cs4‘-‘
3
.1
#{149}
04
#{149}
;
#{149}#{149}
I’,
cJ
#{149} N
#{149}
. N
.
U)
(n.e
__J U) _J U)
0 0 0
‘I)
Z
u, tr , zzI-. w I- w
o z
z
j40 If ftf 0 lIf ._“o
U,
Os As
5
25 #{149} 11 25
Li:
TTT-T-T----
-,‘:_______
1WK. 1MO. 2M0. 3M0. 4M0. 6110. 1C. 11.10. 2MG. 31.10. 4MG. SMO
A A
Fig 5. Respiratory variability
in
breaths per minute (ordinates) as a function of age(abscissae). Differences between siblings (broken line) and controls (solid line) were
restricted to quiet sleep (QS) at 1 week and quiet sleep and indeterminate (IN) at 3 months
of age.
Visual Identification of Apnea (Six seconds or
More)
Densities of apneic episodes for each study group are shown in Fig 6. AS densities were approximately 12% during the first week of life, indicating the
occurrence
of one apneic
episode every eightmm-utes. A sharp reduction was seen at 1 month of age
o
to approximately 5%, indicating an apneic rate of
once every 20 minutes. No further change was seen
during subsequent ages. QS densities of apneic
ep-isodes were lower (2% to 3%) and did not decline
with increasing age.
The median and range of central breathing <
‘, ‘
‘.pauses at each age are provided in Table 3. An .
analysis of variance for the first 18 infants with - - o o - o
factors age and experimental group revealed that . - . 5 - - - 5
siblings
exhibited less apnea than control infants 5 S(P < .03). Data on an additional ten control and 14 subsequent siblings were then compared with the
original set. The apnea densities in the first and
,
,
,
,
,
second set of control infants could not be differen- 1 wk 1 mo 2 mo 3 mo 4 mo 6 mo
tiated.
However, a significant difference was found AGEbetween mean apnea densities of the first and sec- - - - - AS OCT (N 1 9) #{149}55 (N =23) ond set of siblings, with the latter resembling both
control groups. When the total data were resubmit- Fig 6. Central apnea density (6 seconds) in
subse-ted to an analysis of variance, no significant study quent siblings and controlinfants during active sleep (AS)
.
CONTROLS.
SIBLINGSQS
4M0 6M0
TABLE 4. Median and Range of Obstructive and
Mixed Apnea per Study Group and Age TABLE
in
Contr3.
ol S
Total Incidence of Central Apnea ( 6 Sec)
ubjects and Siblings as a Function of Age
Age Control Subjects Siblings
Median Range Median Range 1 wk
1 mo
2 mo 3mo 4 mo 6mo
49 2-277 33 1-276
21 4-119 15 1-102
10 1-98 13 1-68
18 0-71 6 1-38
17 0-51 5 0-34
13 1-58 13 0-51
300 IN
250
200
50
100
300 AS
i
:o(IuLJrIjL1LIL
::
I
50
IWK MO 2M0 3M0
AGE
Fig 7. Sleep state related density of breathing pauses
between two and five seconds (ordinates) as a function of
age (abscissae). Note the reduced incidence of these
pauses in subsequent siblings, particularly at 3 and 6
months of age in quiet sleep (QS).
Computer Identification of Breathing Pauses
Two to Five Seconds. In all sleep states
subse-quent siblings exhibited significantly fewer
respira-tory pauses between two and five seconds duration
(P < 0.03). Densities for each study group are plotted in Fig 7. In addition to these main effects, a significant age by study group interaction was
observed
in QS (P = .02). A Tukey test of multiplemeans revealed that at 3 and 6 months of age
subsequent siblings exhibited fewer QS breathing
pauses
of this duration.Six to Nine Seconds.
Subsequent
siblings
ex-hibited significantly fewer breathing pauses in both
AS and IN (P = .01 and .05). No additional age by study group interaction identified a specific age at
which differences were more pronounced.
Ten Seconds or More. No differences between
study groups were observed in the density of these
breathing
pauses, with the exception of a significantage by study group interaction in IN (P = .01).
Further examination showed that subsequent sib-lings exhibited significantly fewer pauses in excess
of nine seconds during IN at 1 week of age.
Six Seconds or More. To allow for comparison
with visually identified central apnea of this length,
the density of AS and QS apneic episodes six
sec-onds or more is provided in Table 4.
Density scores determined through computer analyses were considerably higher than densities of
central apneic episodes (six seconds or more), in
particular during the first month of life (Fig 5). A
small portion of this difference can be explained by obstructive and mixed apnea, but the difference is
mostly due to movement artifacts (vide infra).
Mixed and Obstructive Apnea
The conclusion that apnea density (six seconds
or more) derived from computer analysis of the PCO2 signal minus central apnea density (six sec-onds or more) based on visual analysis would reflect the incidence of mixed and obstructive apnea is not
Age Control Subjects Siblings
Median Range Median Range
1 wk 2.0 0-29 1.0 0-10
1 mo 2.0 0-11 1.0 0-7
2 mo 1.0 0-21 0.0 0-3
3 mo 1.0 0-16 0.0 0-2
4 mo 0.0 0-8 0.0 0-2
6 mo 0.0 0-7 0.0 0-2
TABLE 5. Density of Computer Identified Apneic
Ep-isodes (6 See) as a Function of Age, State, and Study
Group
Age State
Quiet Sleep Active Sleep
Control Siblings Control Siblings
Subjects Subjects
1wk 18.4 11.4 32.6 19.1
1 mo 7.1 5.4 13.9 12.0
2 mo 6.6 5.1 10.5 8.6
3 mo 8.2 3.8 12.8 7.5
4mo 6.1 4.1 14.7 9.1
warranted. Approximately 40% of the pauses were preceded by a movement which induced artifact in
the thermistor and impedance tracings and
pre-vented identification of the origin of the breathing pause. Subtraction of central from total
breathing
pauses overestimates the incidence of obstructive
apnea. The number of obstructive and mixed
breathing
pauses
proved
infrequent
in both studygroups and the variability among infants was again large. Table 5 provides the median number of summed obstructive and mixed pauses and the range at each age for both study stroups. Siblings tended to exhibit fewer obstructive and mixed ap-neic episodes than control infants.
DISCUSSION
The data presented here demonstrate that short
breathing
pauses
were abundant throughout the age span under investigation. A sharp increase es-pecially in QS at 3 months of age reflects thedevelopmental slowing in respiratory rates.’4”6
Ap-nea between six and nine seconds duration were
also
common
but
declined with increasing age.Ap-nea in excess of nine seconds duration were most
prevalent during the first week of life in all sleep states. Finally, obstructive and mixed apnea were
seen infrequently at any age.
Siblings of SIDS victims exhibited higher
respi-ratory
rates
in IN and QS at 1 week of age, in allstates at 3 months, and in IN at 6 months of age. This effect was not attributable to a few infants
who exhibited abnormal patterns; instead, as a group the siblings showed a comparable distribution with an elevated mean respiratory rate. The uneven sex distribution with fewer boys who were
subse-quent siblings was not responsible for this finding. Respiratory rates in normal male infants were found
to be higher at certain ages, and never lower than female infants.’7 As the control group consisted of more boys, this sex distribution would favor higher
respiratory rates in the control group. Respiratory rates rise
following
feeding
and are influenced byambient
temperature.’8”9
Feeding patterns changed with age, as expected, but could not account for the differences between the subsequent siblings andcontrols.20
Seasonal
temperature
changes
and
their effect on hospital temperatures were also evenly distributed among study group infants. The rise in respiratory rate was accompanied by a significantdecrease
in short
and
intermediate breathing pauses in subsequent siblings. Apnea in excess of nineseconds were not different in the study groups.
Upper respiratory infections, reported to increase apnea,2’ occurred with comparable frequency in
control infants and siblings and exerted no
predict-able influence on the number of apneic episodes whether central, obstructive or mixed.
It is useful to distinguish between predisposing factors that contribute to increased risk for SIDS
and precipitating events that caused death.
Al-though much attention has been paid to the final
common
pathway
accounting
for death, less atten-tion has been directed to physiologic factors thatpredispose to risk. Evidence that chronic or
inter-mittent hypoxia preceded death from
sIDs,
whileindirect,
is
mounting. The increased respiratoryrates in siblings are compatible with the hypothesis that the risk infants were responding to a relative oxygen lack. Br#{252}cket al observed a similar
venti-latory
adjustment of increased rates in infants be-tween 1 and 13 weeks of age known to behypox-ernie. Thoman et al, in monitoring a group of normal infants, identified two infants with tachyp-flea, one of whom subsequently died of SIDS.
Fi-nally, kittens monitored while breathing 10%
oxy-gen also
exhibited
increased
respiratory rates and decreased apnea.27 Although obstructive sleep ap-nea has been proposed as the etiology for chronichypoxia,7 transient or persistent air flow obstruction
was infrequent in both study groups and tended to
be even less common in siblings.
The etiology of SIDS has been sought for a number of decades and is still obscure. The
elusive-ness of this disease suggests that a constellation of
minor alterations each of which alone cannot
ex-plain death interacts to produce vulnerability to
SIDS. Recent evidence indicates that risk infants may have already been challenged in utero, and that environmental pollutants, in particular carbon monoxide, may contribute to functional hypoxia.’20 Such minor aberrant stimuli in prenatal and post-natal life may trigger compensatory physiologic
re-sponses or aggravate existing minor abnormalities.
These adjustments, while initially adaptive, when prolonged may initiate a sequence of events which perpetuates rather than limits abnormal
function-ing. In this model, increased respiratory rates rep-resent such an adaptive response. The majority of
infants
would
be expected
to successfullycompen-sate with little or no clinical symptomatology. For
an occasional infant the accumulation of minor abnormalities or the occurrence of a sudden stress may present a challenge for which the infant cannot
continue to compensate. In this context, it is inter-esting that hypoxic
conditioning
of young kittensresulted
in a separation of kittens that coped andthose that failed to compensate and died.27
Identi-fication of compensatory responses, while poten-tially useful to elucidate underlying mechanisms,
cannot be expected to identify the individual infant
SUMMARY
Subsequent siblings of infants who died of SIDS are at a four- to six-times increased statistical risk to die of SIDS.2 The objective of this study is to compare the respiratory development of normal control infants and subsequent siblings of SIDS.
Subsequent siblings exhibited higher respiratory
rates
in all states
at
3 months of age. QS and INrespiratory
rates
were elevated at 1 week of age compared to control infants. IN respiratory rates remained higher at 6 months of age. These differ-ences were accompanied by a reduced incidence oftotal
breathing
pauses
of two to five seconds and six to nineseconds
duration
in siblings. Study groups could not be differentiated on the basis of either breathing pauses of more than ten seconds or central apnea of six seconds or more. Obstructiveand mixed
apnea
(six seconds
or more)
were
infre-quently observed in these study groups; siblings
exhibited
fewer apneic episodes of the unequivocal obstructive and mixed variety. The reduction in computer identified apneic episodes between six and nine seconds in siblings can be accounted for by a reduction in numbers of equivocal breathingpauses
of thislength.
A
high degree of intersubjectvariability characterized all data on breathing
pauses.
ACKNOWLEDGMENTS
This research was supported by National Institutes of
Child Health and Human Development contract no.
NOl-HD-2-2777
and HD 4-2810. Computing assistance wasobtained from the Health Sciences Computing Facility,
UCLA, supported by the National InstitUtes of Health
Special Resources grant RR-3.
We thank Ms B. Havens, E. Hofmann, and S. Geidel
for
the development of the monitoring program and fortheir contribution to the data collection. We also
acknowl-edge the contribution of Mrs K. Arakawa, Ms Mary
Fairbanks, Ms D. Jensen, and Mr J. Mason.
REFERENCES
1. Beckwith JB: The sudden infant death syndrome. Curr Probi Pediatr 3:1, 1973
2. Froggatt P, Lynas MA, MacKenzie G: Epidemiology of
sud-den unexpected death in infants (“cot death”) in Northern
Ireland. Br J Prey Soc Med 25:119, 1971
3. Peterson D: Genetic su8ceptibility to sudden infant death.
Paper presented at the research reporting workshop for the
National Institute of Child Health and Human
Develop-ment, Sudden Infant Death Syndrome Grantees and
Con-tracts, Alexandria, VA, September 1977
4. Valdes-Dapena M: Serum proteins, viral isolation, antibodies
in milk, and epidemiologic factors in sudden death, in
Wedge-wood RJ, Benditt EP (eds): Sudden Death in Infants,
Wash-ington DC, US Government Printing Office, 1965, p75
5. Gastaut H, Tassinari CA, Duron B: Polygraphic study of the episodic diurnal and nocturnal (hypnic and respiratory)
man-ifestations of the Pickwick’s syndrome. Brain Res 2:167,
1966
6. Steinschneider A: Prolonged apnea and the sudden infant
death syndrome: Clinical and laboratory observations.
Pe-diatrics 50:646, 1972
7. Guilleminault C, Peraita R, Souquet M, et al: Apneas during
sleep in infants: Possible relationship with sudden infant
death syndrome. Science 190:677, 1975
8. Hoppenbrouwers T, Hodgman JE, Harper RM, et al:
mci-dence of apnea in infants at high and low risk for sudden
infant death syndrome (SIDS). Pediatr Res 10:425, 1976
9. Hofmann E, Havens B, Geidel 5, et al: Long-term,
continu-ous monitoring of multiple physiological parameters in
new-born and young infants. Acta Pediatr ScaM 266(Suppl):5,
1977
10. Harper RM, Hoppenbrouwers T, Sterman MB, et al:
Poly-graphic studies of normal infants during the first six months of life. I. Heart rate and variability as a function of state.
Pediatr Res 10:945, 1976
11. Hoppenbrouwers T, Hodgman JE, Harper RM, et al:
Poly-graphic studies of normal infants during the first six months
of life. III. Incidence of apnea and periodic breathing.
Pedi-atrics 60:418, 1977
12.
Sterman MB, Harper RM, Havens R, et al: Quantitativeanalysis of central cortical EEG activity during quiet sleep
in infants. Electroencephalogr Clin Neurophysiol 43:371,
1977
13. Mason J, Harper RM, Pacheco R: Analysis of respiratory
data during sleep and waking. Proc Dig Equp Comput Users Soc 567, 1974
14. Hoppenbrouwers T, Harper RM, Hodgman JE, et al:
Poly-graphic studies of normal infants during the first six months
of life. II. Respiratory rate and variability as a function of
state. Pediatr Res 12:120, 1978
15.
Winer BJ: Statistical Principles in Experimental Design.New York, McGraw-Hill, 1962
16.
Hoppenbrouwers T, Jensen D, Hodgman JE, et al:Respi-ration during the first six months of life. II. The emergence of a circadian pattern. Neurop#{224}diatrie 10:264, 1979
17. Hoppenbrouwers T, Hodgman JE, Sterman MB, et al:
Gen-der differences in respiratory rates and apnea density in
infants between birth and six months of age. Pediatr Res 13:
359, 1979
18. Prechtl HFR, Weinmann H, Akiyama Y: Organization of
physiological parameters in normal and neurologically
ab-normal infants. Neurop#{246}4iatrie 1:101,1969
19. Hoppenbrouwers T, Harper RM, Hodgman JE, et al: Effects
of feeding on respiratory regulation. Sleep Res 7:133, 1978
20. Hoppenbrouwers T, Jensen DK, Hodgman JE, et a!: The
emergence of a circadian pattern in respiratory rates:
Corn-parison between control infants and subsequent siblings of SIDS. Pediatr Res 14:345, 1980
21. Steinschneider A: Nasopharyngitis and prolonged sleep ap-nea. Pediatrics 56:967, 1975
22. Naeye RL: Hypoxernia and the sudden infant death
syn-drorne. Science 186:837, 1974
23. Valdes-Dapena M: Sudden infant death syndrome case
anal-yses. Paper presented at the research reporting workshop
for the National Institute of Child Health and Human
De-veloprnent, Sudden Infant Death Syndrome Grantees and Contracts, Alexandria, VA, September 1977
24. Williams A, Vawter G, Reid L: Increased muscularity of the
pulmonary circulation in victims of sudden infant death
syndrome. Pediatrics 63:18, 1979
25. Br#{252}ckK, Adams FR, Br#{252}ckM: Temperature regulation in
infants with chronic hypoxernia. Pediatrics 80:350,1962 26. Thornan EB, Miano YN, Freese MB: The role of respiratory
instability in the sudden infant death syndrome. Dev Med
Child Neurol 19:729, 1977
27.
Baker T, McGinty DJ: Reversal of cardiopulmonary failureduring active sleep in hypoxic kittens: Implications for
sud-den infant death. Science 198:419, 1977
28. Hoppenbrouwers T, Hodgman JE, Sterman MB, et al: Fetal
heart rate (FHR) patterns during maternal sleep and risk
for sudden infant death syndrome (SIDS). Sleep Res
8:126,
1979
29. Hoppenbrouwers T, Calub M, Arakawa K, et al: Seasonal
relafionship ofSIDS and environmental pollutants. Clin Res