101
Volume LIX 11 Number 1, 2011
THE EFFECTS OF SAMPLE FAT VALUE
MANIPULATION ON RAW COW MILK
COMPOSITION AND INDICATORS
O. Hanuš, M. Vyletělová, M. Tomáška, E. Samková, V. Genčurová, R. Jedelská,
J. Kopecký
Received: August 8, 2010
Abstract
HANUŠ, O., VYLETĚLOVÁ, M., TOMÁŠKA, M., SAMKOVÁ, E., GENČUROVÁ, V., JEDELSKÁ, R., KOPECKÝ, J.: The eff ects of sample fat value manipulation on raw cow milk composition and indicators. Acta univ. agric. et silvic. Mendel. Brun., 2011, LIX, No. 1, pp. 101–112
Values of milk indicators (MIs) can be infl uenced by sampling errors and milk manipulation. This paper estimated the freezing point depression (FPD) and other MIs dri s which can cause fat move-ment. That is important for: – preparation of reference milk samples (MSs) for profi ciency testing and instrument calibrations; – estimation of the impact of milk treatment as centrifugation in dairy plants on FPD. Five MSs (A = original milk; milk with modifi ed fat (F) content; B = less F, C = low F, D = more F, E = high F) were created (gravitation F separation at 4 °C for 12 hours) with the same milk matrix 12× per year. F averages increased by 4.80% (122.1%) from 1.68 to 6.48% due to manipulation. It increased variability of MIs especially for SNF (solids non fat), L (lactose) and CP (crude protein). SCC (somatic cell count) averages increased by 803 (196.8%) from 9 to 812 thousand.ml−l. Correlation (r) F × SCC was 0.85 (P < 0.001). SNF, L and CP averages decreased by 0.47% (5.3%), 0.31% (6.3%) and 0.17% (5.0%). Corre-lations were −0.78, −0.75 and −0.64 (P < 0.001). Urea decreased along with F increase by 1.05 mg.100ml−l (2.9%) but with r −0.13 (P > 0.05). Acetone increased by 1.37 mg.l−l (47.6%) with r 0.21 (P > 0.05). Electri-cal conductivity decreased by 0.23 mS.cm−l (6.0%) with r −0.15 (P > 0.05). Alcohol stability was reduced by 0.14 ml (23.3%) with r −0.15 (P > 0.05). FPD, titration and actual acidity were not infl uenced.
milk, sample, fat manipulation, milk freezing point, somatic cell count, milk indicators
The quality of milk as composition and proper-ties depend in the fi rst place on primary milk pro-duction technology and the nutritional and health state of dairy cows. However, milk quality assesss-ment also depends on sampling accuracy and milk sample manipulation apart from the reliability of the analysis. In particular the fat (F) content, somatic cell count, free fatty acid content (Hanuš et al., 2008 b) and total mesophilic bacteria count (Cempírková, 2002, 2007) may be infl uenced by these factors as they are most sensitive to sampling accuracy. This is relevant to the price of milk according to quality.
The freezing point depression (FPD) is a very im-portant physical property of raw and treated (pas-teurized) drinking milk. FPD is investigated along
milk FPD (Demott, 1969; Brouwer, 1981; Walstra and Jenness, 1984; Koops et al., 1989) is linked to the lactose content (53.8%), with macroelement concen-trations (K+ 12.7%, Cl− 10.5%, Na+ 7.2%), citrates 4.3%, urea 1.9% and other components 6.9% (fat, protein et cetera). Other authors (Freeman and Bucy, 1967; Eisses and Zee, 1980; Buchberger, 1990 a, b, 1994; Kološta, 2003; Kirchnerová and Foltys, 2005) inves-tigated and partly explained all the other eff ects on FPD such as biological, biochemical (dairy cow feed-ing and dairy cow mammary gland health state) and technological (milking, collecting, transport and pasteurization). Milk watering owing to foreign wa-ter penetration is connected with these technologi-cal steps. Also milk sampling and treatment (manip-ulation) can infl uence FPD.
Fat is the milk component that is most changed by various technological factors in the milk processing chain and in the case of both raw unpasteurized and pasteurized milk, during mixing, cooling, storage, transport, preparation and treatment (centrifuga-tion). All this can simultaneously infl uence the FPD (as dri s) and aff ect other milk component propor-tions and properties as well (Hanuš et al., 2003).
For these reasons the aim of this paper was to ex-plain the FPD and other milk component and prop-erty value dri s which may be caused by incidental fat content changes. There is a dearth of relevant in-formation on the three main reasons for this investi-gation: 1) the information acquired could be impor-tant for explaining possible eff ects of milk sampling errors and sample manipulations on milk compo-sition and properties; 2) the methodological data is signifi cant for milk reference laboratories and dairy analytical technologies in the preparation of milk standard or reference samples for interlaboratory profi ciency testing and instrument calibrations for measurement of various milk indicators; 3) this es-timation is essential for determinating the impact of basic milk treatment such as centrifugation in dairy plants on milk freezing point. The second rea-son is the importance of reference sets of milk sam-ples (MSs) today at a time of rapid dissemination of new eff ective milk analytical methods like NIR–FT and MIR–FT, near and mid infra–red spectropho-tometry with Fourier transformations, which are able to measure simultaneously a large number of milk indicators and must be calibrated regularly ac-cording to reference method results and using reli-able methodical procedures (Tsenkova et al., 2000; Kukačková et al., 2000; Jankovská and Šustová, 2003; Šustová et al., 2007; Hanuš et al., 2008 a; Hering et al., 2008).
MATERIAL AND METHODS
Animals and bulk milk samples
Bulk milk samples (MSs) from a commercial dairy farm store tank were used for the analyses in this study. These originated from both milked cattle breeds in the country, that is Czech Fleckvieh and
Holstein dairy cows which were kept in one herd in the ratio 1:1. Cows were milked twice a day in a milk-ing parlour. The milk was sampled over the whole year each month one MS. In this way the sample ma-terial covered all feeding seasons.
Experimental milk fat content manipulations
Five MSs (A = original milk, normal fat (F); B, C, D, E = milk sub–samples with modifi ed (manipu-lation) fat content; B = less fat, C = low fat, D = more F, E = high F) were created on the basis of each bulk milk sample by the relevant modifi cation (accord-ing to Hanuš et al., 2003). Milk fat was withdrawn from sub–samples B and C and the same fat milk was added to sub-samples D and E by regulated hy-dromechanical gravitation fat separation (at 4 °C for 12 hours) and by the back homogenization mixing of the relevant portions as well. This ensured that all sub–samples B, C, D and E had the same milk matrix of original sample A.
Chemical, physical and microbiological analyses
All MSs were analysed in the accredited laboratory and National reference laboratory for raw milk of Agrovýzkum Rapotín. The investigated milk indica-tors (MIs) were as follows: fat (F) content (in g.100g−l, %); crude protein (CP) content (in g.100g−l, %); lactose (L) content (in g.100g−l of monohydrate, %); content of solids non fat (SNF, in g.100g−l, %); total solids con-tent (TS, in g.100g−l, %).
All mentioned MIs were measured using MilkoScan 133B (Foss Electric, Denmark) equip-ment which was regularly calibrated (Hanuš et al., 1995 a) according to reference method results (stan-dard CSN 57 0536 by the Gerber’s method for fat content, Kjeldahl’s method for crude protein con-tent and polarimetric and gravimetric methods for lactose and SNF contents, according to standard CSN 57 0530).
The somatic cell count (SCC, in thousand.ml−l) was determined using a Fossomatic 90 instrument (Foss Electric, Denmark) according to standard CSN EN ISO 13366–2. Both instruments are used regu-larly in the relevant national profi ciency testing with good results.
The milk urea (U, in mg.100ml−l) concentration was determined by spectrophotometry at 420 nm wavelength. The specifi c reaction solution was pre-pared as sour mixture with the p–dimethylamino-benzaldehyde (Hering et al., 2008; Hanuš et al., 1995 b, 2008 a). The Spekol 11 instrument (Carl Zeiss Jena, Germany) was calibrated using six samples in a scale with the increased urea concentrations from 6 to 60 mg.100ml−l.
cali-brated by fi ve points on the scale with the increased AC concentration from 1 to 20 mg.l−l.
The milk electrical conductivity (EC) was mea-sured using OK 102/1 (Radelkis, Hungary) conduc-tometer at 20 °C (in mS.cm−l) with the help of the geometrically exactly defi ned bell glass electrode with ring platinum contacts. The instrument was calibrated by the relevant salt (KCl) solution (10.2 mS.cm−l) at the each MS set measurement.
The active (pH) acidity was measured using pH– meter CyberScan 510 (EUTECH INSTRUMENTS) at 20 °C. This instrument is regularly calibrated by the standard buff er solutions (pH 4.0 and 7.0 Hamilton Duracal Buff er, Switzerland) at the each MS set mea-surement.
The milk freezing point depression (FPD, in °C) was measured by the reference cryoscopic method with the Cryo–Star automatic instrument (Funke– Gerber, Germany). This instrument was regularly calibrated (Bauch et al., 1993; Buchberger and Klos-termeyer, 1995; Tomáška et al., 2005) by standard NaCl solutions (Funke–Gerber) and used in the na-tional profi ciency testing with regularly successful results.
The titration acidity (TA) was measured using the milk titration by the alkaline solution to the light pink colour of the mixture (in ml 0.25 mol.l−l NaOH solution, which was used to the titration of 100 ml of milk). The method was performed according to stan-dard CSN 57 0530 (the Soxhlet–Henkel method).
The total mesophilic bacteria count (TMBC) was investigated (Cempírková, 2002, 2007) using calcu-lation of the colony forming units (CFU) and
tra-ditional plate cultivation methode (at 30 °C for 72 hours) with GTK M (Milcom Tábor) agar or agar with the glucose monohydrate, triptone–peptone, dehydrated yeast extract and skim milk powder, ac-cording to standard CSN ISO 6610 (in thousands of CFU.ml−l).
The alcohol stability (AS) was determined with the help of the milk titration (5 ml) by 96% ethanol to the formation of the fi rst visible milk protein fl akes (in ml of used alcohol).
Design of statistical treatment
The main statistical characteristics as arithmeti-cal mean (x) and standard deviation (sd) of milk in-dicators (MIs) were calculated separately for original milk samples (MSs; n = 12) and all original and ma-nipulated MSs (n = 60) together. SCC, CPM and AC values were logarithmically transformed on deci-mal basis (log) because of non–nordeci-mal distribution in most cases (Ali and Shook, 1980; Raubertas and Shook, 1982; Shook, 1982; Reneau, 1986; Reneau et al., 1988; Meloun and Militký, 1994; Hanuš et al., 2001). This was followed by geometric means. Cor-relations between MIs were calculated separately for original MSs and all original and manipulated MSs together. The Excel programme was used for the statistical evaluation. Because of the overstrik-ing of fat manipulation eff ect the original and mod-ifi ed groups (5 groups × 12 samples) of MSs were displayed by box graphs in terms of data frequency distributions.
I: Main statistical parameters of milk indicators for original milk samples (A)
n x sd min. max.
F 12 3.93 0.262 3.48 4.40
CP 12 3.40 0.076 3.20 3.50
L 12 4.96 0.121 4.74 5.19
SNF 12 8.91 0.163 8.65 9.19
TS 12 12.83 0.198 12.41 13.23
SCC 12 408 181 275 940
log SCC 12 2.5799 0.1496 2.4393 2.9731
FPD 12 −0.5234 0.0085 −0.5321 −0.5054
TMBC 11 243,364 447,172 19,000 1,600,000
log TMBC 11 4.9008 0.5982 4.2788 6.2041
U 12 36.76 10.56 10.56 50.93
AC 12 2.88 2.14 0.79 8.40
log AC 12 0.3551 0.2955 −0.1048 0.9245
AS 12 0.60 0.185 0.40 0.90
TA 12 7.66 0.320 7.19 7.99
EC 12 3.86 0.600 2.85 4.57
pH 12 6.67 0.108 6.57 6.90
RESULTS AND DISCUSSION
Variability in milk indicators via fat content manipulation
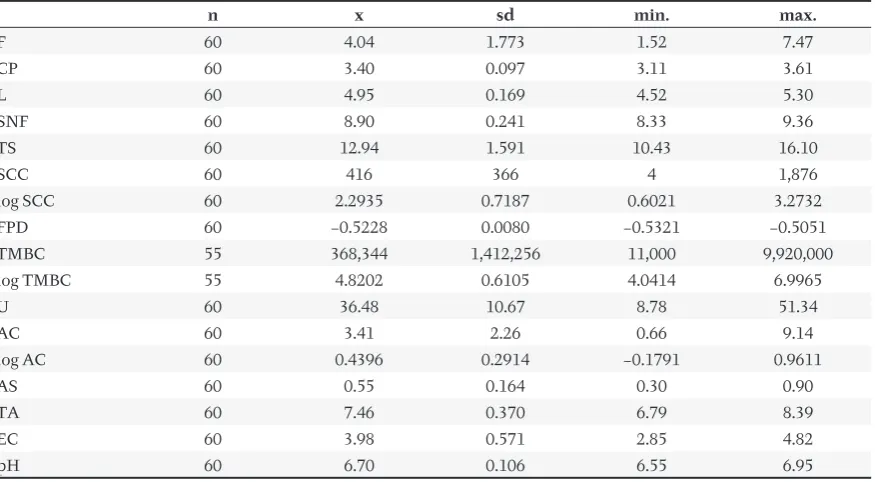
The main statistical characteristics of MIs of orig-inal MSs are shown in Tab I and all MSs including fat manipulated samples are in Tab. II. The methodi-cal and technologimethodi-cal changes in milk fat content or changes that could be caused by milk sampling er-rors, can infl uence the results of the other measure-ments (Fig. 1, F and other MIs). As the tables show, the variability (sd and variability range) of MIs was marked o en in both directions, due to fat manip-ulation in SCC and also in other main milk com-ponents as the results for identical MIs as these in Tab. I are compared to Tab. II.
Eff ect of fat content manipulation on hygienic milk indicators
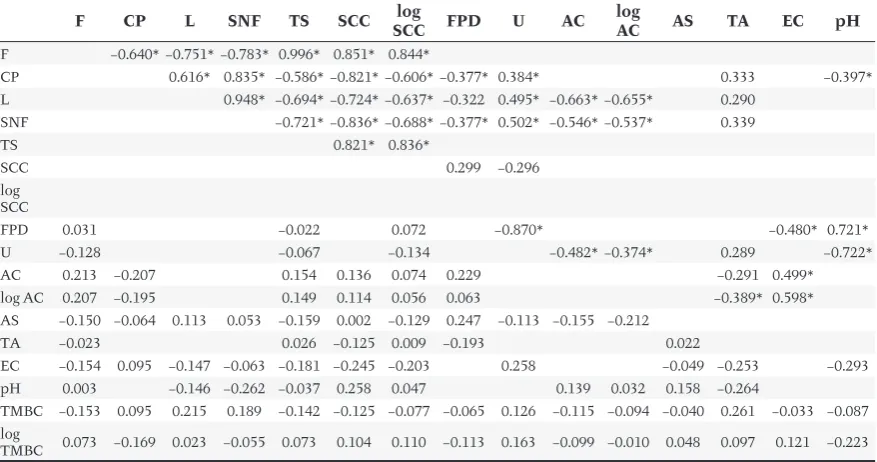
The change trends of MIs depending on F ma-nipulations in identical milk matrix are clearly vis-ible in Fig. 1. The natural F variation range was from 3.48 to 4.40% (Tab. I; Fig. 1), a er manipulation it was from 1.52 to 7.47% (Tab. II). F group averages for MSs (C, B, A, D, E) increased regularly (Fig. 1) from 1.68 to 6.48% or by 4.80% (by 122.1% relatively). The same SCC values varied from 275 to 940 thousand. ml−l (Tab. I; Fig. 1) and from 4 to 1,876 thousand.ml−l (Tab. II). Also SCC group averages for MSs (C, B, A, D, E) increased consistently in relation to F manip-ulations (Fig. 1) from 9 to 812 thousand.ml−l. On av-erage it was by 803 thousand.ml−l (by 196.8%) along experimental F increasing at signifi cant (P < 0.001) correlation coeffi cients (F × SCC and F × log SCC 0.85 and 0.84; Tab. IV; F × log SCC nonlinear 0.93; Fig. 2). This phenomenon can be explained by
adhe-sion of somatic cells to fat globules which have larger diameter and lower specifi c weight than other cells and the water phase of milk and tend to increase to-wards milk level together with adherent somatic cells. A similar trend in relation to F changes but of course not as marked has been observed for TMBC too as an important hygienic indicator (Cempírková, 2002, 2007).
Eff ect of fat content modifi cation on other major milk components
In contrast, weaker but clear trends were ob-served for main milk components in decreasing or-der: SNF, L and CP. In these cases group averages (C, B, A, D, E) decreased by 0.47% for SNF, 0.31% for L and 0.17% for CP or by 5.3?%, 6.3% and 5.0% relatively along with increase with milk fat (Fig. 1). Correla-tions were statistically signifi cant (Tab. IV; P < 0.001; −0.78, −0.75 and −0.64). These results are in good ac-cord with our preliminary paper (Hanuš et al., 2003). Certainly the TS results were expected where the trend was logically and markedly in agreementt with F (Fig. 1). These facts are explainable by the mutual movements of proportions of specifi c weights in milk components during F manipulation which for fat is lower and for other main components higher than in the water phase.
Eff ect of fat content manipulation on minor milk components and health indicators
From the same mentioned reasons too, minor milk component a U (nutrition milk indicator with relation to fertility and production traits of cows; Zhai et al., 2006; Jílek et al., 2006; Řehák et al., 2009) decreased a little along with F increase (Fig. 1). On average this was by 1.05 mg.100ml−l (by 2.9%) but with a correlation coeffi cient of −0.13 (Tab. IV; P >
II: Main statistical parameters of milk indicators for all, original and modifi ed milk samples (A, B, C, D and E)
n x sd min. max.
F 60 4.04 1.773 1.52 7.47
CP 60 3.40 0.097 3.11 3.61
L 60 4.95 0.169 4.52 5.30
SNF 60 8.90 0.241 8.33 9.36
TS 60 12.94 1.591 10.43 16.10
SCC 60 416 366 4 1,876
log SCC 60 2.2935 0.7187 0.6021 3.2732
FPD 60 −0.5228 0.0080 −0.5321 −0.5051
TMBC 55 368,344 1,412,256 11,000 9,920,000
log TMBC 55 4.8202 0.6105 4.0414 6.9965
U 60 36.48 10.67 8.78 51.34
AC 60 3.41 2.26 0.66 9.14
log AC 60 0.4396 0.2914 −0.1791 0.9611
AS 60 0.55 0.164 0.30 0.90
TA 60 7.46 0.370 6.79 8.39
EC 60 3.98 0.571 2.85 4.82
C B A D E 1
2 3 4 5 6 7 8
0 1 2 3 4 5
F
C B A D E
3.00 3.10 3.20 3.30 3.40 3.50 3.60 3.70
0 1 2 3 4 5
CP
C B A D E
4.40 4.50 4.60 4.70 4.80 4.90 5.00 5.10 5.20 5.30 5.40
0 1 2 3 4 5
L
C B A D E
8.00 8.20 8.40 8.60 8.80 9.00 9.20 9.40 9.60
0 1 2 3 4 5
SNF
C B A D E
10.00 11.00 12.00 13.00 14.00 15.00 16.00 17.00
0 1 2 3 4 5
TS
C B A D E
3.50 13.50 23.50 33.50 43.50 53.50 63.50
0 1 2 3 4 5
C B A D E
0 500 1000 1500 2000
0 1 2 3 4 5
SCC
C B A D E
0.0000 0.5000 1.0000 1.5000 2.0000 2.5000 3.0000 3.5000
0 1 2 3 4 5
log SCC
C B A D E
0.00 1.00 2.00 3.00 4.00 5.00 6.00 7.00 8.00 9.00 10.00
0 1 2 3 4 5
AC
C B A D E
-0.4000 -0.2000 0.0000 0.2000 0.4000 0.6000 0.8000 1.0000 1.2000
0 1 2 3 4 5
log AC
C B A D E
-0.5350 -0.5300 -0.5250 -0.5200 -0.5150 -0.5100 -0.5050 -0.5000 -0.4950
0 1 2 3 4 5
FPD
C B A D E
0.20 0.30 0.40 0.50 0.60 0.70 0.80 0.90 1.00
0 1 2 3 4 5
0.05). That is in agreement with our preliminary re-sults (Hanuš et al., 2003). In contrast to this, however, the next minor milk component AC (cow health and nutrition milk indicator; Vojtíšek et al. 1991; Janů et al., 2007) increased by 1.37 mg.l−l (by 47.6%; Fig. 1) along with increase in experimental F with a corre-lation coeffi cient 0.21 (Tab. IV; P > 0.05). This phe-nomenon confi rms a closer link of AC to milk fat fraction. An impact trend was investigated for EC as this health indicator decreased by 0.23 mS.cm−l (by 6.0%) along with F increase (Fig. 1). However this ef-fect was also insignifi cant (correlation −0.15; P > 0.05; Tab. IV).
Eff ect of fat content modifi cation on some milk physical and technological properties
In agreement with assumption, the FPD was only minimally aff ected (Fig. 1) due to milk F manipula-tion with very low correlamanipula-tion (0.03; P > 0.05; Tab. IV). It is in good accordance with estimations of the pos-sible impact of fat content on FPD in previous pa-pers by Demott (1969), Brouwer (1981), Walstra and Jenness (1984) and Koops et al. (1989). That is one
reason why possible milk sampling errors and milk technological centrifugation should not be a source of FPD deterioration in terms of quality change on milk market as it has been o en mistakenly done in practice. Titration acidity and actual acidity were likewise aff ected insignifi cantly without visible trends (Fig. 1; Tab. IV) by F changes. An impact trend was observed for alcohol stability (Fig. 1). AS was re-duced via F increase by 0.14 ml (by 23.3%). The corre-lation was −0.15 (P > 0.05; Tab. IV).
Changes of milk indicator relations via fat content manipulation
The comparison of mutual relations (correla-tions) between MIs in natural and all MSs including F modifi ed MSs is interesting (Tab. III and Tab. IV). Some relationships were changed very markedly by F value modifi cation. Some even changed the dependence under experimental conditions. This means the development of quite a new kind of re-lationship and strong eff ect using the F content ma-nipulation. There are more signifi cant correlations in Tab. IV than in Tab. III. This may be due to a larger
C B A D E
6.45 6.50 6.55 6.60 6.65 6.70 6.75 6.80 6.85 6.90 6.95 7.00
0 1 2 3 4 5
pH
C B A D E
3.5000 4.0000 4.5000 5.0000 5.5000 6.0000 6.5000 7.0000 7.5000
0 1 2 3 4 5
log TM BC
C B A D E
6.50 6.70 6.90 7.10 7.30 7.50 7.70 7.90 8.10 8.30 8.50
0 1 2 3 4 5
TA
C B A D E
2.50 3.00 3.50 4.00 4.50 5.00
0 1 2 3 4 5
EC
number of observations but it is partly due to F ma-nipulations as well. Therefore, some of correlations coeffi cients between F and other manipulation in-fl uenced milk indicators (Tab. III and Tab. IV) ap-proach more closely (for instance for CP, SNF, TS, SCC) and some changed their dependence (for stance for AS or F manipulation had no marked in-fl uence on TA as can bee seen in the group means, Fig. 1). On the other hand, the uninfl uenced indica-tor FPD lost its original positive correlation (Tab. IV) with F manipulation which means deterioration in
FPD with F increase (0.71; P < 0.01; Tab. III). The cor-relation coeffi cients between MIs and experimen-tal F manipulations mostly confi rmed the fi ndings based on the MI group means in a logical way.
CONCLUSION
The dynamics of milk indicator changes through fat content manipulation are described. The tech-nological and methodical milk fat content changes or changes caused by milk sampling errors, can in-III: Correlations coeffi cients between milk indicators in group of native milk samples (A; n = 12, TMBC 11)
F CP L SNF TS SCC SCC FPDlog U AC log AC AS TA EC pH TMBC
F −0.733* −0.657 0.782* 0.610 0.709 0.712* −0.580
CP −0.251 0.721* −0.851* −0.818* −0.626
L 0.361 0.906* −0.593 0.654 −0.778* −0.778* 0.649
SNF −0.745* −0.808* −0.618 0.690 −0.693 −0.694 −0.609
TS 0.263 −0.223 −0.044
SCC −0.489 0.192 0.761* 0.659
log SCC 0.272 0.771* −0.595 0.634
FPD −0.566 −0.493 0.432 −0.859* 0.635 0.764*
U 0.455 −0.198 −0.557 −0.805*
AC 0.399 −0.244 −0.045 0.108 0.220 0.279 −0.505
log AC 0.250 −0.246 −0.243 0.065 0.169 0.077 −0.365 0.701
AS 0.456 −0.330 −0.190 −0.289 0.365 0.416 0.430 −0.388 0.255 0.031
TA 0.326 0.410 −0.022 0.168 0.570 −0.245 −0.163 0.121 −0.023 0.213 0.032 0.033
EC −0.253 0.029 −0.307 −0.218 −0.514 −0.254 −0.218 −0.499 0.288 0.523 −0.188 −0.169
pH 0.368 −0.448 −0.015 0.363 0.228 0.406 −0.090 −0.145
TMBC −0.296 0.117 0.525 0.065 −0.204 −0.244 −0.134 0.471 −0.233 −0.378 0.439 0.320 0.004 −0.182
log
TMBC −0.435 −0.101 0.537 0.337 −0.249 −0.100 −0.151 −0.123 0.420 −0.143 −0.170 0.344 0.149 0.173 −0.179
Insignifi cant coeffi cients (P > 0.05) below diagonale. Signifi cant coeffi cients above diagonale: P < 0.05 without sign; P < 0.01 with*.
IV: Correlations coeffi cients between milk indicators in groups of original and modifi ed milk samples (A, B, C, D and E; n = 60, TMBC 55)
F CP L SNF TS SCC SCC FPDlog U AC log AC AS TA EC pH
F −0.640* −0.751* −0.783* 0.996* 0.851* 0.844*
CP 0.616* 0.835* −0.586* −0.821* −0.606* −0.377* 0.384* 0.333 −0.397*
L 0.948* −0.694* −0.724* −0.637* −0.322 0.495* −0.663* −0.655* 0.290
SNF −0.721* −0.836* −0.688* −0.377* 0.502* −0.546* −0.537* 0.339
TS 0.821* 0.836*
SCC 0.299 −0.296
log SCC
FPD 0.031 −0.022 0.072 −0.870* −0.480* 0.721*
U −0.128 −0.067 −0.134 −0.482* −0.374* 0.289 −0.722*
AC 0.213 −0.207 0.154 0.136 0.074 0.229 −0.291 0.499*
log AC 0.207 −0.195 0.149 0.114 0.056 0.063 −0.389* 0.598*
AS −0.150 −0.064 0.113 0.053 −0.159 0.002 −0.129 0.247 −0.113 −0.155 −0.212
TA −0.023 0.026 −0.125 0.009 −0.193 0.022
EC −0.154 0.095 −0.147 −0.063 −0.181 −0.245 −0.203 0.258 −0.049 −0.253 −0.293
pH 0.003 −0.146 −0.262 −0.037 0.258 0.047 0.139 0.032 0.158 −0.264
TMBC −0.153 0.095 0.215 0.189 −0.142 −0.125 −0.077 −0.065 0.126 −0.115 −0.094 −0.040 0.261 −0.033 −0.087
log
fl uence the results of the other measurements. The main impacts were identifi ed on somatic cell count, solids non fat, total solids, lactose and protein con-tent. Other milk indicators were less infl uenced. These data can be practically used in the methodical
and technological procedures of milk laboratories for reference sample preparation and in dairy plants for technology milk processing and milk market in-formation.
y = 175.61x – 293.9 R2 = 0.7233
0 500 1000 1500 2000
1 2 3 4 5 6 7 8
F (%)
SCC (thou
sa
nd.ml
-1)
y = 1.3653Ln(x) + 0.5367 R2 = 0.8562
0 1 2 3 4
1 2 3 4 5 6 7 8
F (%)
log SCC
2: Regression relationships of fat manipulations to somatic cell count in raw cow milk Sample groups A, B, C, D and E, n = 60, correlation 0.85 and 0.93.
SUMMARY
A number of milk indicators (MIs) aff ecting the economic impact of milk quality can also be infl u-enced by sampling accuracy and milk manipulation. The goal of this paper was to examine and quan-tify the freezing point depression (FPD) and other milk component and property dri s which could be caused by fat movement. Explanations for the possible eff ects of sampling errors and sample and milk manipulations on milk component and property changes are important for: – reference labora-tories for the preparation of reference milk samples for profi ciency testing and instrument calibra-tions; – estimation of the impact of milk treatment as centrifugation in dairy plants on FPD. Five milk samples (A = original milk; milk with modifi ed fat (F) content; B = less F, C = low F, D = more F, E = high F) were created (gravitation F separation at 4 °C for 12 hours) with the same milk matrix 12× per year. F averages increased by 4.80% (122.1%) from 1.68 to 6.48% due to manipulation. It increased variability of MIs especially for SNF (solids non fat), L (lactose) and CP (crude protein). SCC (somatic cell count) averages increased by 803 (196.8%) from 9 to 812 thousand.ml−l. Correlation (r) F × SCC was 0.85 (P < 0.001). SNF, L and CP averages decreased by 0.47% (5.3%), 0.31% (6.3%) and 0.17% (5.0%). Correla-tions were −0.78, −0.75 and −0.64 (P < 0.001). Urea decreased along with F increase by 1.05 mg.100ml−l (2.9%) but with r −0.13 (P > 0.05). Acetone increased by 1.37 mg.l−l (47.6%) with r 0.21 (P > 0.05). Electri-cal conductivity decreased by 0.23 mS.cm−l (6.0%) with r −0.15 (P > 0.05). Alcohol stability was reduced by 0.14 ml (23.3%) with r −0.15 (P > 0.05). FPD, titration and actual acidity were not infl uenced. The re-sults can be used for various estimations at methodical (laboratories) and technological (dairy facto-ries) procedures.
Paper was supported by projects MSM 2678846201 and ME 09081 and by activities of NRL–RM in Ra-potín and education project CZ.1.07/2.3.00/09.0081.
REFERENCE
ALI, A. K. A., SHOOK, G. E., 1980: An optimum transformation for somatic cells concentration in milk. Journal of Dairy Science, 63, 487–490. BAUCH, W., HUBER, B., BUCHBERGER, J., 1993:
Zum Einfl uss einiger Parameter auf die Bestim-mung des Gefrierpunktes von Milk mit den Cryostar II – LC. DMZ Lebensmittel und Milch-wirtscha , 114, 5, ISSN 0938-9369,112–114. BROUWER, T., 1981: Calculations concerning the
determination of the freezing-point depression of milk. Netherlands Milk and Dairy Journal, 35.
BUCHBERGER, J., 1990 a: Einfl uss von Rasse, Lak-tationsstadium und Untersuchungsfehler auf den Gefrierpunkt der Milch. Schule und Beratung, 11/90, IV–9–11.
BUCHBERGER, J., 1990 b: Ursachen von Überschrei-tungen des Grenzwertes von –0,515 °C beim Ge-frierpunkt der Milch. Schule und Beratung, 9–10, IV–8–10.
BUCHBERGER, J., KLOSTERMEYER, H., 1995: Determination of freezing point in milk with the „System 4000 Milko-Scan” from FOSS ELECTRIC A/S. DMZ Lebensmittel und Milchwirtscha , 23/24, ISSN 0938-9369, 1–14.
CEMPÍRKOVÁ, R., 2002: Psychrotrophic vs. total bacterial counts in bulk milk samples. Veterinary Medicine–Czech, 47, 8, 227–233.
CEMPÍRKOVÁ, R., 2007: Contamination of cow’s raw milk by psychrotrophic and mesophilic mi-crofl ora in relation to selected factors. Czech Jour-nal of Animal Science, 52, 11, 387–393.
CROMBRUGGE VAN, J. M., 2003: Freezing point. Bulletin of International Dairy Federation, 383, 15–22.
CSN EN ISO 13366–2 (57 0531), 2007: Milk – Enu-meration of somatic cells – Part 2: Manual for control of fl uoro-opto-electronic instrument. (In Czech) CNI Prague.
CSN 57 0536, 1999: Determination of milk compo-sition by mid–infrared analyzer. (In Czech) CNI Prague.
CSN ISO 6610, 1996: Milk and milk products – Enumeration of colony forming units of micro-organisms Colony–count technique at 30 °C. (In Czech) CNI Prague.
CSN 57 0530, 1973: Methods for testing of milk and milk products. (In Czech) CNI Prague.
DEMOTT, B. J., 1969: Relationship of freezing point of milk to its specifi c gravity and concentration of lactose and choride. Journal of Dairy Science, 52, 6, 882.
EISSES, J., ZEE, B., 1980: The freezing point of autentic cow’s milk and farm tank milk in the Netherlands. Netherlands Milk and Dairy Journal, 34, 162–180.
FREEMAN, T. R., BUCY, J. L., 1967: Distribution of milk freezing points in authentic herd samples. Journal of Dairy Science, 50, 6, 951.
HANUŠ, O., BJELKA, M., TICHÁČEK, A., JEDELSKÁ, R., KOPECKÝ, J., 2001: Substantia-tion and usefulness of transformaSubstantia-tions in data sets of analyzed milk parameters. (In Czech) In pro-ceedings VÚCHS Rapotín, 122–137.
HANUŠ, O., FICNAR, J., JEDELSKÁ, R., KOPECKÝ, J., BERANOVÁ, A., GABRIEL, B., 1995 a: Method-ical problems of nitrogen matter determination in cow’s milk. (In Czech) Veterinary Medicine– Czech, 40, 12, 387–396.
HANUŠ, O., HERING, P., FRELICH, J., JÍLEK, M., GENČUROVÁ, V., JEDELSKÁ, R., 2008 a: Reliabil-ity of milk urea analyse results by various meth-ods in use of artifi cial milk control samples. Czech Journal of Animal Science, 53, 4, 156–165.
HANUŠ, O., JÍLEK, M., FICNAR, J., BERANOVÁ, A., JEDELSKÁ, R., HAVLÍČKOVÁ, K., MÍČOVÁ, Z., 1995 b: Ways of preparing standards for cali-bration of indirect methods of determination of urea concentration in milk. (In Czech) Živočišná Výroba / Czech Journal of Animal Science, 40, 10, 441–451.
HANUŠ, O., KLIMEŠ, M., MIHULA, P., KOZÁKOVÁ, A., JEDELSKÁ, R., 2003: Impacts of the sampling of milk and the basic milk treatment on its freez-ing point and other compositional parameters. (In Czech) Výzkum v chovu skotu / Cattle Research, XLV, 164, 4, 10–17.
HANUŠ, O., VEGRICHT, J., FRELICH, J., MACEK, A., BJELKA, M., LOUDA, F., JANŮ, L., 2008 b: Analyse of raw cow milk quality according to free fatty acids contents in the Czech Republic. Czech Journal of Animal Science, 53, 1, 17–30.
HERING, P., HANUŠ, O., FRELICH, J., PYTLOUN, J., MACEK, A., JANŮ, L., KOPECKÝ, J., 2008: Rela-tionships between the results of various methods of urea analysis in native and enriched milk. Czech Journal of Animal Science, 53, 2, 64–76.
CHLÁDEK, G., ČEJNA, V., 2005: The relationships between freezing point of milk and milk compo-nents and their changes during lactation in Czech Pied and Holstein cows. (In Czech) Acta Univer-sitatis Agriculturae et Silviculturae Mendelianae Brunensis, LIII, 5, 63–70.
JANKOVSKÁ, R., ŠUSTOVÁ, K., 2003: Analysis of cow milk by near-infrared spectroscopy. Czech Journal of Food Science, 21, 4, 123–128.
JANŠTOVÁ, B., DRAČKOVÁ, M., NAVRÁTILOVÁ, P., HADRA, L., VORLOVÁ, L., 2007: Freezing point of raw and heat-treated goat milk. Czech Journal of Animal Science, 52, 11, 394–398. JANŮ, L., HANUŠ, O., FRELICH, J., MACEK, A.,
ZAJÍČKOVÁ, I., GENČUROVÁ, V., JEDELSKÁ, R., 2007: Infl uences of diff erent milk yields of Hol-stein cows on milk quality indicators in the Czech Republic. Acta Veterinaria Brno, 76, 4, 553–561. JÍLEK, F., ŘEHÁK, D., VOLEK, J., ŠTÍPKOVÁ, M.,
NĚMCOVÁ, E., FIEDLEROVÁ, M., RAJMON, R., ŠVESTKOVÁ, D., 2006: Eff ect of herd, parity, stage of lactation and milk yield on urea concentration in milk. Czech Journal of Animal Science, 51, 12, 510–517.
KIRCHNEROVÁ, K., FOLTYS, V., 2005: The bio-chemical parameters of milk quality in relation-ship to freezing point. (In Slovak) Sborník: XXXII. seminář o jakosti potravin a potravinových suro-vin. Brno MZLU, 17.
KOLOŠTA, M., 2003: Eff ect of pasture dairy cow nourishment level on the milk freezing point. (In Slovak) Mliekarstvo, 34, 3, 25–27.
KOOPS, J., KERKHOF MOGOT, M. F., VAN HEMERT, H., 1989: Routine testing of farm tank milk by infra-red analysis. IV Prediction of the freezing-point depression from infra-red mea-surements and conductivity. Netherlands Milk and Dairy Journal, 43, 3–16.
KUKAČKOVÁ, O., ČURDA, L., JINDŘICH, J., 2000: Multivariate calibration of raw cow milk using NIR spectroscopy. Czech Journal of Food Science, 18, 1, 1–4.
RAUBERTAS, J. K., SHOOK, G. E., 1982: Relation-ship between lactation measures of SCC and milk yield. Journal of Dairy Science, 65, 419–425. RENEAU, J. K., 1986: Eff ective use of dairy herd
im-provement somatic cell counts in mastitis control. Journal of Dairy Science, 69, 1708–1720.
RENEAU, J. K., APPLEMAN, R. D., STEUERNAGEL, G. R., MUDGE, J. W., 1988: Somatic cell count. An eff ective tool in controlling mastitis. Agricultural Extension Service, University of Minnesota, AG– FO–0447, 8.
ROHM, H., PLESCHBERGER, C., FOISSY, F., 1991: Der Gefrierpunkt pasteurisierter Milch in Öster-reich. Ernährung / Nutrition, 15, 11/12, 667–671. ŘEHÁK, D., RAJMON, R., KUBEŠOVÁ, M.,
ŠTÍPKOVÁ, M., VOLEK, J., JÍLEK, F., 2009: Rela-tionships between milk urea and production and fertility traits in Holstein dairy herds in the Czech Republic. Czech Journal of Animal Science, 54, 5, 193–200.
SHOOK, G. E., 1982: Approaches to summarizing somatic cell count which improve interpretability. In: Nat. Mast. Council, Louisville, Kentucky, 1–17. ŠUSTOVÁ, K., RŮŽIČKOVÁ, J., KUCHTÍK, J., 2007:
Application of FT near spectroscopy for determi-nation of true protein and casein in milk. Czech Journal of Animal Science, 52, 9, 284–291.
TOMÁŠKA, M., HOFERICOVÁ, M., KOLOŠTA, M., 2005: The measurement of equivalent of milk freezing point. (In Slovak) Mliekarstvo, 36, 4, 7–9. TSENKOVA, R., ATANASSOVA, S., ITOH, K.,
OZAKI, Y., TOYODA, K., 2000: Near infrared spectroscopy for biomonitoring: Cow milk com-position measurement in a spectral region from 1,100 to 2,400 nanometers. Journal of Animal Science, 78, 515–522.
VOJTÍŠEK, B., HRONOVÁ, B., HAMŘÍK, J., JANKOVÁ, B., 1991. Milk thistle (Silybum maria-num) in feed rations administered to ketotic cows. (In Czech) Veterinary Medicine (Praha), 36, 6, 321– 330.
WALSTRA, P., JENNESS, R., 1984: Dairy Chemistry and Physics, New York – Chichester – Brisbane – Toronto – Singapore.
WIEDEMANN, M., BUCHBERGER, J., KLOSTER-MEYER, H., 1993: Ursachen für anomale Gefrier-punkte der Rohmilch. 1 und 2. Mitteilung, DMZ Lebensmittel und Milchwirtscha , 114, 22, ISSN 0938-9369, 634–644, 114, 23, 656–663.
ZHAI, S. W., LIU, J. X., WU, Y. M., YE, J. A., XU, Y. N., 2006: Responses of milk urea nitrogen content to dietary crude protein level and degradability in lactating Holstein dairy cows. Czech Journal of Animal Science, 51, 12, 518–522.
Address